Changes in PRIMAP-hist v2.6_final compared to v2.5.1_final for China
2024-09-24
Johannes Gütschow
Change analysis for China for PRIMAP-hist v2.6_final compared to v2.5.1_final
Overview over emissions by sector and gas
The following figures show the aggregate national total emissions excluding LULUCF AR6GWP100 for the country reported priority scenario. The dotted linesshow the v2.5.1_final data.
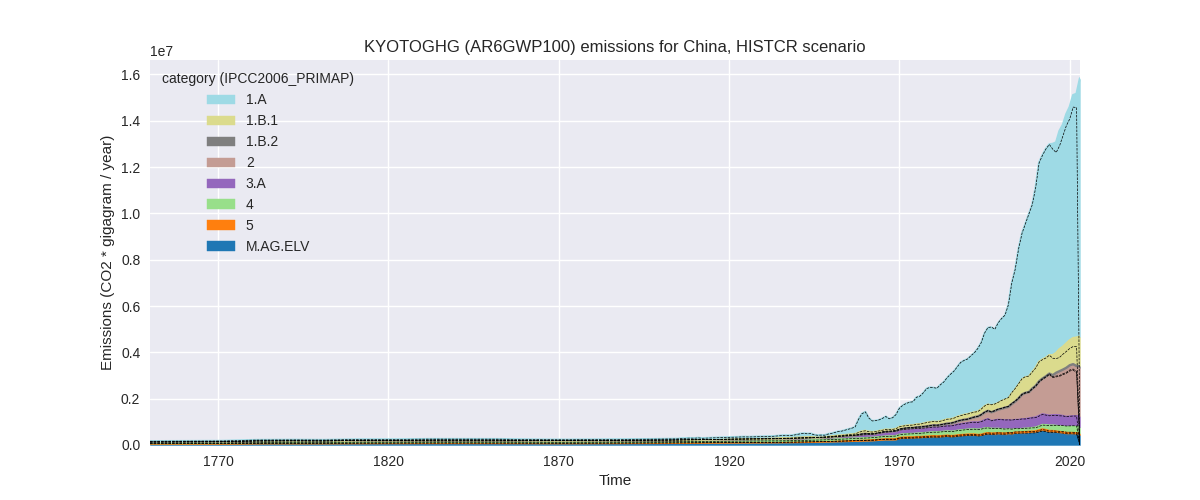
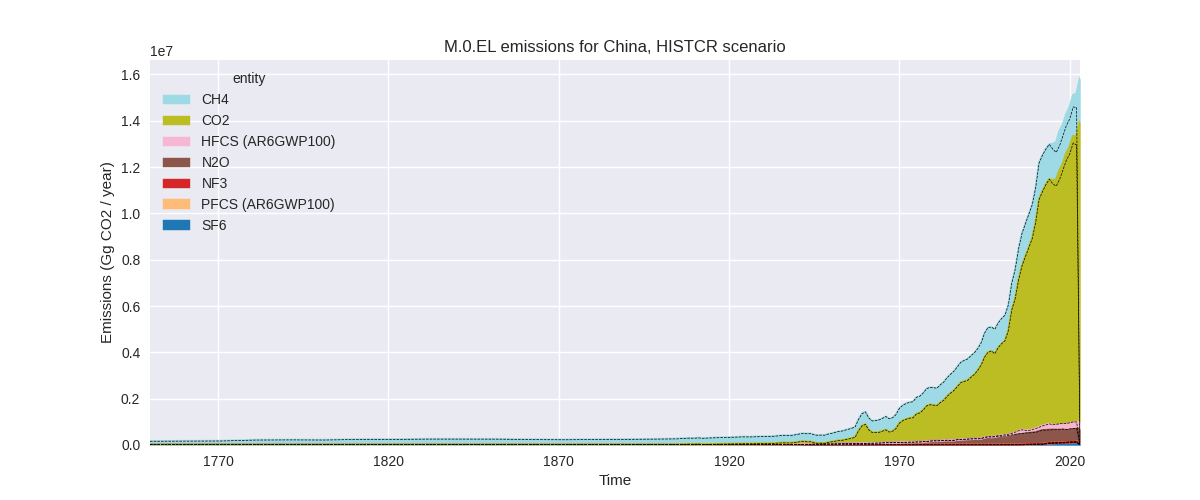
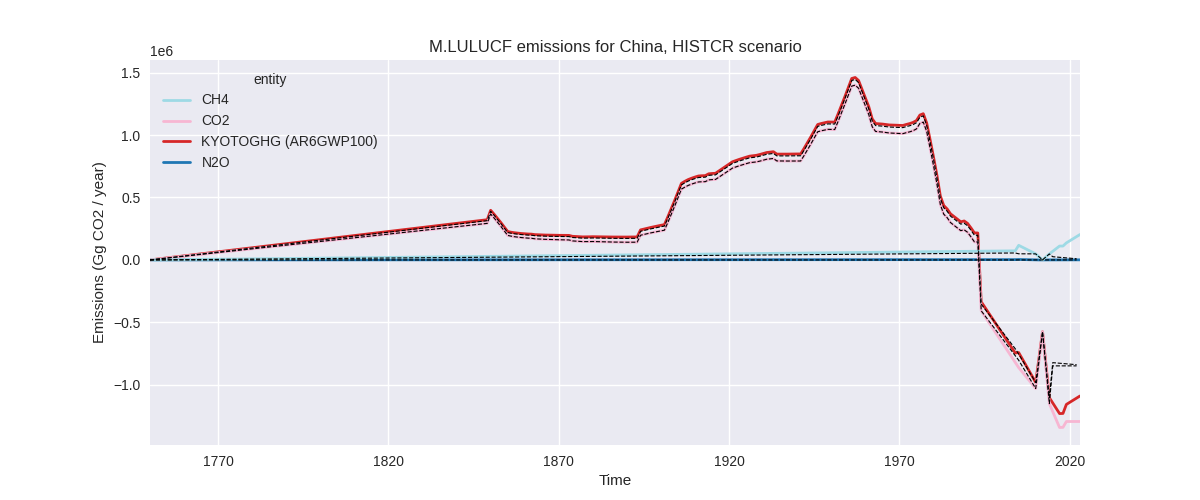
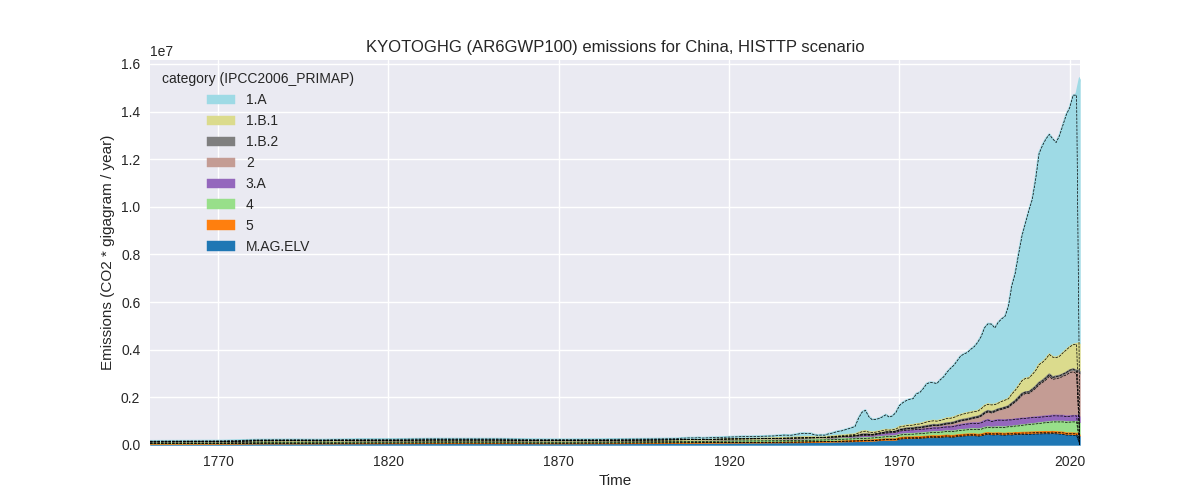
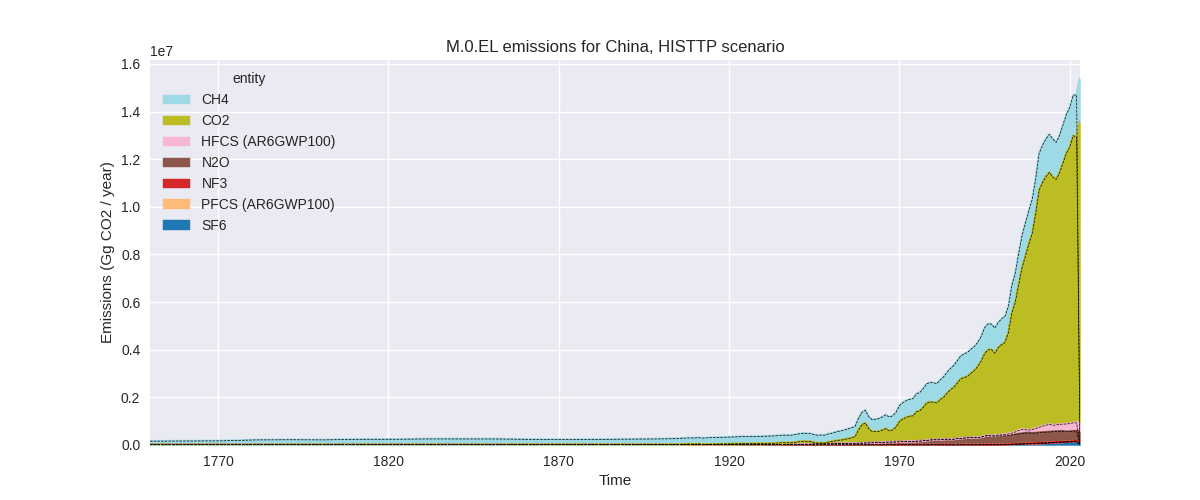
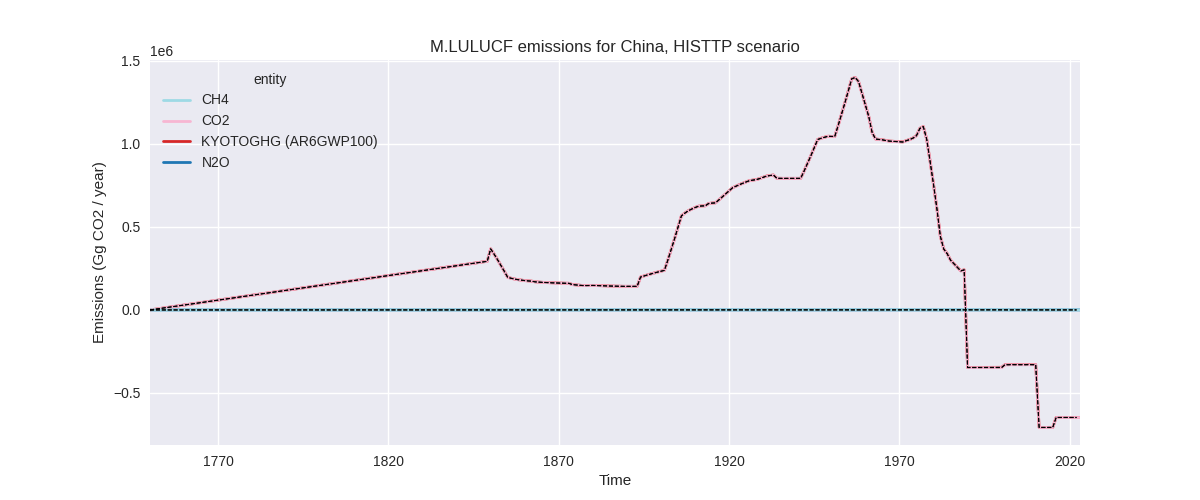
The following figures show the aggregate national total emissions excluding LULUCF AR6GWP100 for the third party priority scenario. The dotted linesshow the v2.5.1_final data.
Overview over changes
In the country reported priority scenario we have the following changes for aggregate Kyoto GHG and national total emissions excluding LULUCF (M.0.EL):
- Emissions in 2022 have changed by 4.1%% (593737.00 Gg CO2 / year)
- Emissions in 1990-2022 have changed by 1.2%% (109792.09 Gg CO2 / year)
In the third party priority scenario we have the following changes for aggregate Kyoto GHG and national total emissions excluding LULUCF (M.0.EL):
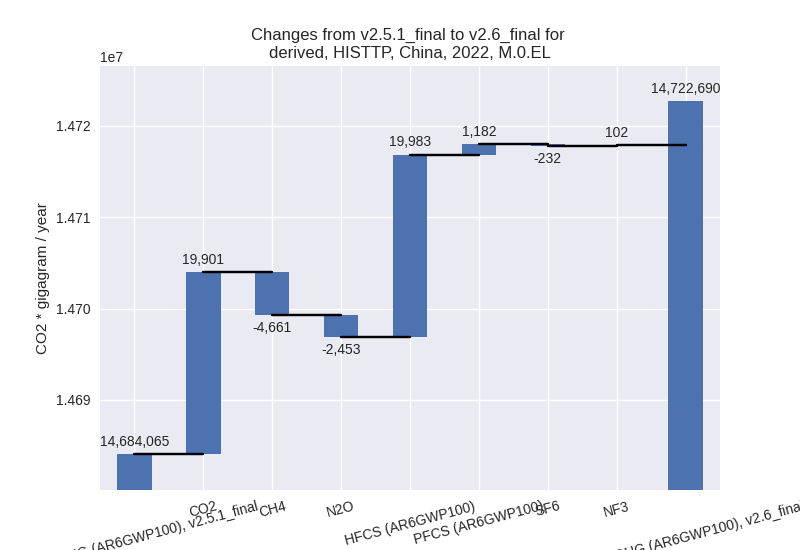
- Emissions in 2022 have changed by 0.3%% (38625.00 Gg CO2 / year)
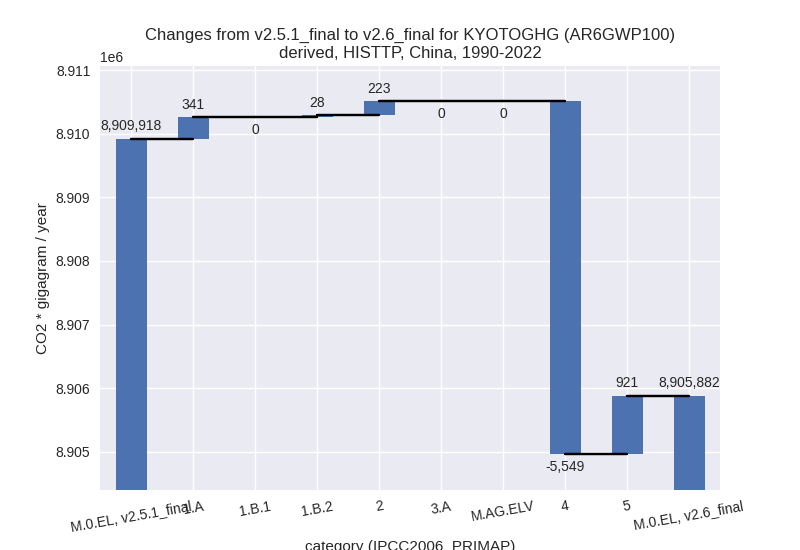
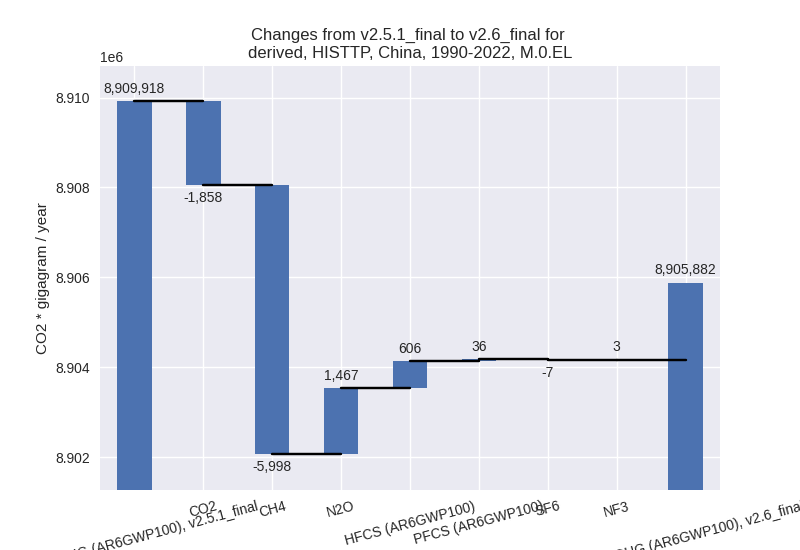
- Emissions in 1990-2022 have changed by -0.0%% (-4035.97 Gg CO2 / year)
Most important changes per scenario and time frame
In the country reported priority scenario the following sector-gas combinations have the highest absolute impact on national total KyotoGHG (AR6GWP100) emissions in 2022 (top 5):
- 1: 1.A, CO2 with 208454.00 Gg CO2 / year (2.1%)
- 2: 2, CO2 with 188880.30 Gg CO2 / year (14.1%)
- 3: 1.B.1, CH4 with 165878.36 Gg CO2 / year (24.5%)
- 4: 3.A, CH4 with 42405.21 Gg CO2 / year (11.7%)
- 5: M.AG.ELV, N2O with -39949.88 Gg CO2 / year (-19.1%)
In the country reported priority scenario the following sector-gas combinations have the highest absolute impact on national total KyotoGHG (AR6GWP100) emissions in 1990-2022 (top 5):
- 1: 1.A, CO2 with 53698.08 Gg CO2 / year (0.9%)
- 2: 2, CO2 with 33293.33 Gg CO2 / year (4.1%)
- 3: 1.B.1, CH4 with 25809.53 Gg CO2 / year (5.8%)
- 4: M.AG.ELV, N2O with -18645.23 Gg CO2 / year (-7.7%)
- 5: 3.A, CH4 with 13415.83 Gg CO2 / year (3.9%)
In the third party priority scenario the following sector-gas combinations have the highest absolute impact on national total KyotoGHG (AR6GWP100) emissions in 2022 (top 5):
- 1: 1.A, CO2 with 28003.00 Gg CO2 / year (0.3%)
- 2: 2, HFCS (AR6GWP100) with 19983.39 Gg CO2 / year (5.8%)
- 3: 2, CO2 with -7400.00 Gg CO2 / year (-0.6%)
- 4: 4, CH4 with -4661.03 Gg CO2 / year (-1.0%)
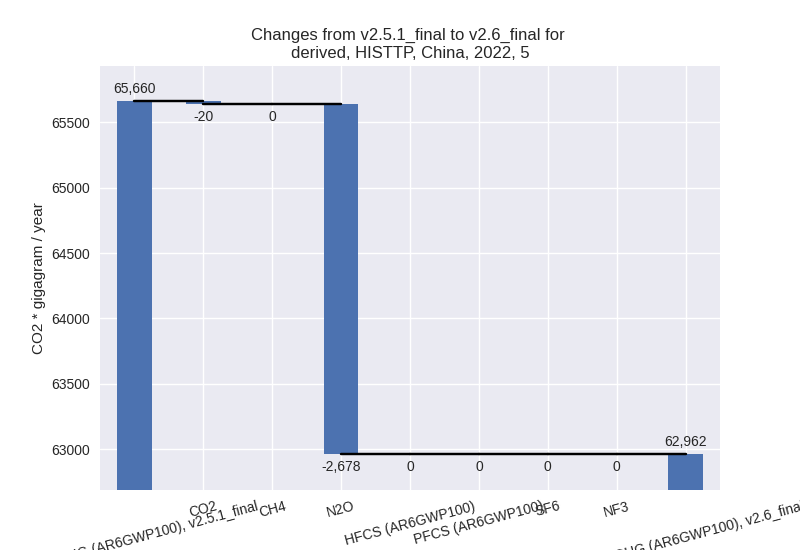
- 5: 5, N2O with -2678.09 Gg CO2 / year (-7.7%)
In the third party priority scenario the following sector-gas combinations have the highest absolute impact on national total KyotoGHG (AR6GWP100) emissions in 1990-2022 (top 5):
- 1: 4, CH4 with -5997.54 Gg CO2 / year (-1.9%)
- 2: 2, CO2 with -2130.30 Gg CO2 / year (-0.3%)
- 3: 5, N2O with 941.42 Gg CO2 / year (3.8%)
- 4: 2, HFCS (AR6GWP100) with 605.56 Gg CO2 / year (0.4%)
- 5: 4, N2O with 525.69 Gg CO2 / year (2.6%)
Notes on data changes
Here we list notes explaining important emissions changes for the country. ’' means that the following text only applies to the TP time series, while means that it only applies to the CR scenario. Otherwise the note applies to both scenarios.
- Overall 2022 emissions in the CR scenario are 3.9% lower than in PRIMAP-hist v2.5.1. Cumulative emissions are 1.2% higher (CR scenario). The main reason is the inclusion of BUR3 and NC4 which adds country reported data for 2017 and 2018.
- Some inconsistencies in the downscaling od UNFCCCDI data were fixed.
- The main contributions come from energy CO2, CO2 from mineral and chemical industry, and fugitive CH4 from solid fuels for both 2022 and cumulative emissions.
- Total agricultural emissions have only slight changes, because higher CH4 from livestock mostly cancel with lower N2O from agricultural emissions excluding livestock.
- Changes in the TP scenario are small and mainly in sectors 4 and 5 due to the removal of FAOSTAT data.
Changes by sector and gas
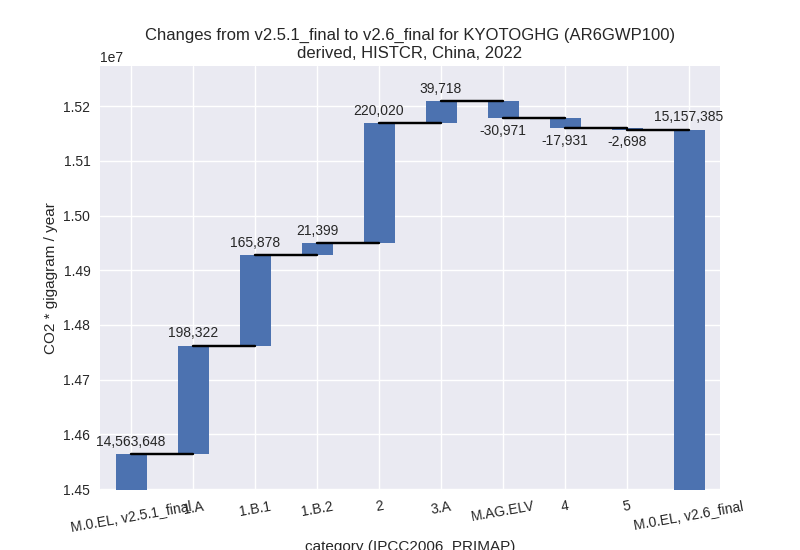
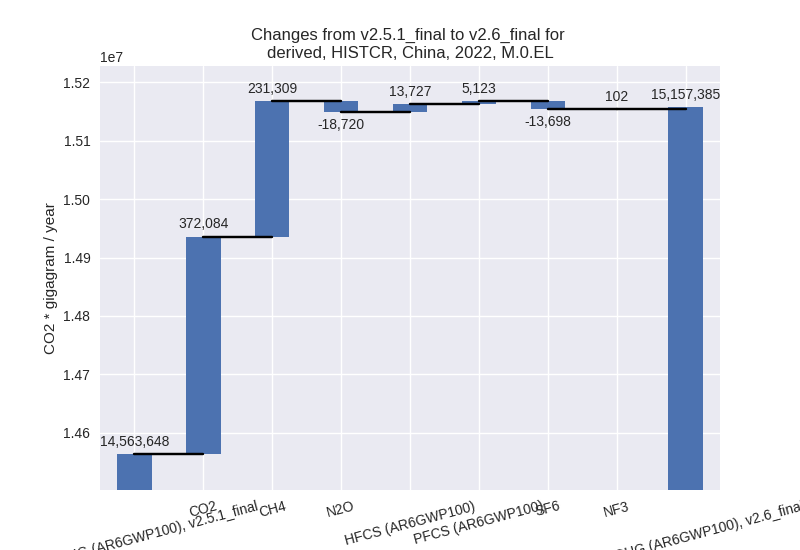
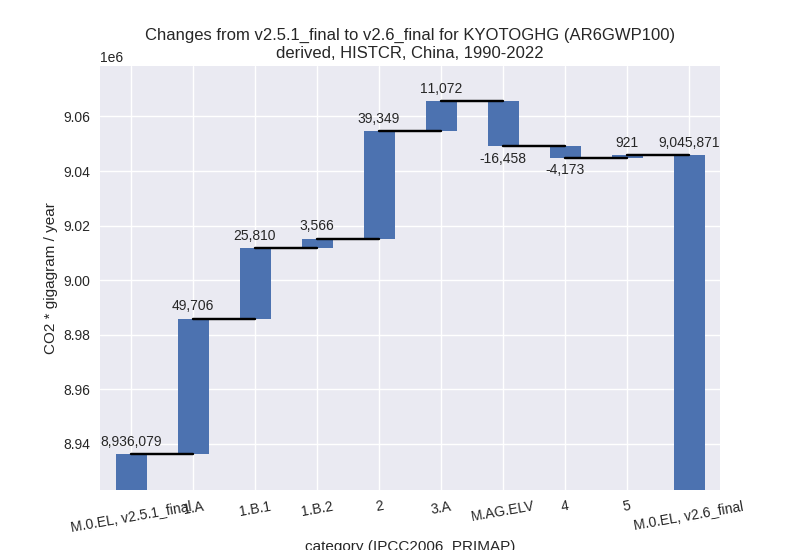
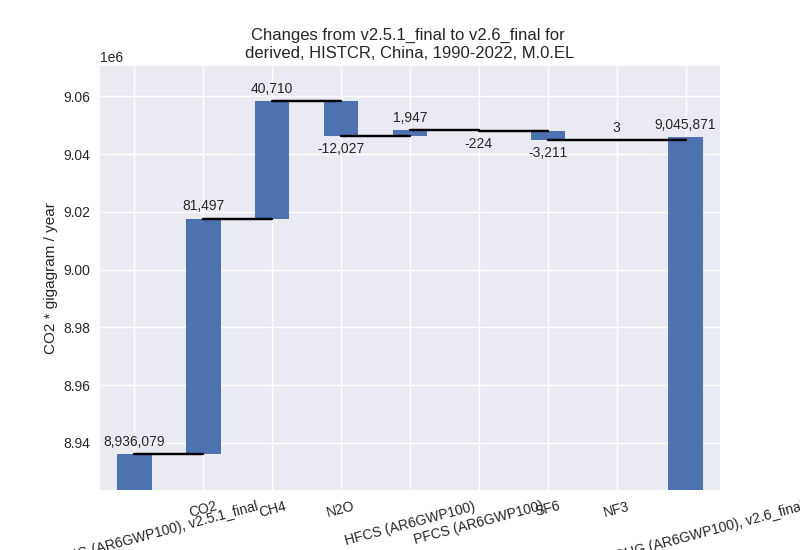
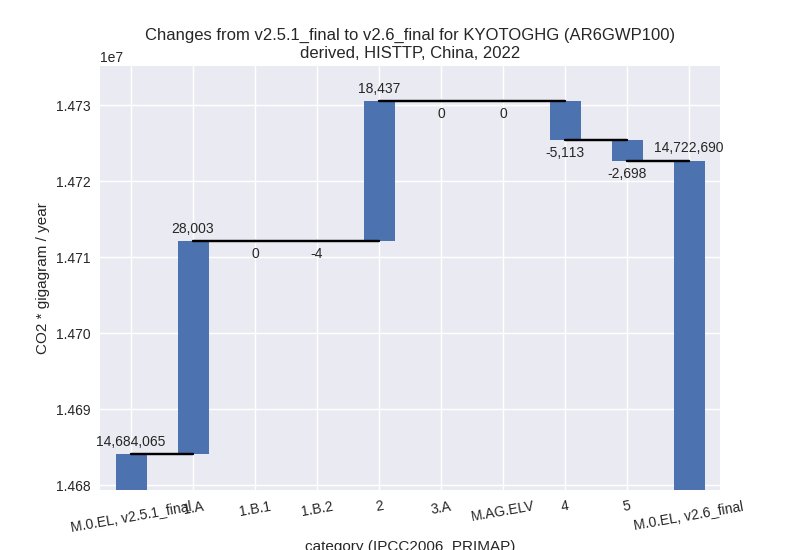
For each scenario and time frame the changes are displayed for all individual sectors and all individual gases. In the sector plot we use aggregate Kyoto GHGs in AR6GWP100. In the gas plot we usenational total emissions without LULUCF. ## country reported scenario
2022
1990-2022
third party scenario
2022
1990-2022
Detailed changes for the scenarios:
country reported scenario (HISTCR):
Most important changes per time frame
For 2022 the following sector-gas combinations have the highest absolute impact on national total KyotoGHG (AR6GWP100) emissions in 2022 (top 5):
- 1: 1.A, CO2 with 208454.00 Gg CO2 / year (2.1%)
- 2: 2, CO2 with 188880.30 Gg CO2 / year (14.1%)
- 3: 1.B.1, CH4 with 165878.36 Gg CO2 / year (24.5%)
- 4: 3.A, CH4 with 42405.21 Gg CO2 / year (11.7%)
- 5: M.AG.ELV, N2O with -39949.88 Gg CO2 / year (-19.1%)
For 1990-2022 the following sector-gas combinations have the highest absolute impact on national total KyotoGHG (AR6GWP100) emissions in 1990-2022 (top 5):
- 1: 1.A, CO2 with 53698.08 Gg CO2 / year (0.9%)
- 2: 2, CO2 with 33293.33 Gg CO2 / year (4.1%)
- 3: 1.B.1, CH4 with 25809.53 Gg CO2 / year (5.8%)
- 4: M.AG.ELV, N2O with -18645.23 Gg CO2 / year (-7.7%)
- 5: 3.A, CH4 with 13415.83 Gg CO2 / year (3.9%)
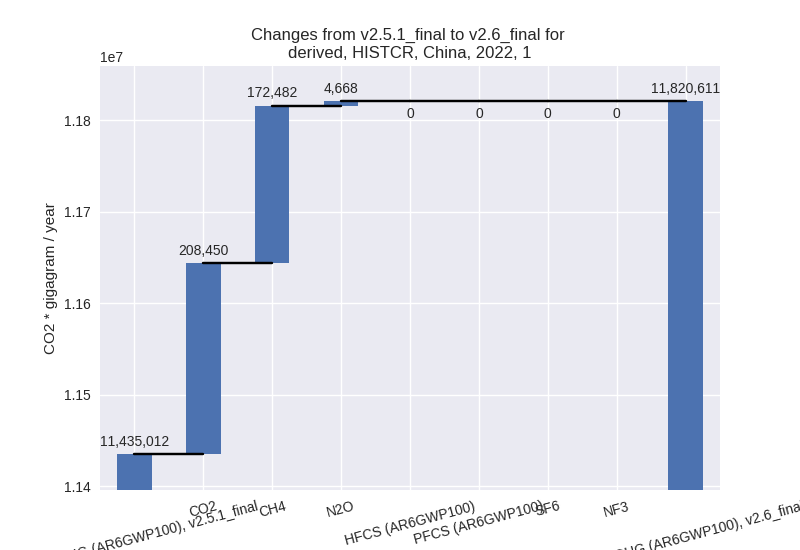
Changes in the main sectors for aggregate KyotoGHG (AR6GWP100) are
- 1: Total sectoral emissions in 2022 are 11820611.00
Gg CO2 / year which is 78.0% of M.0.EL emissions. 2022 Emissions have
changed by 3.4% (385599.00 Gg CO2 /
year). 1990-2022 Emissions have changed by 1.2% (79080.87 Gg CO2 / year). For 2022
the changes per gas
are:
The changes come from the following subsectors:- 1.A: Total sectoral emissions in 2022 are 10520618.00 Gg CO2 / year which is 89.0% of category 1 emissions. 2022 Emissions have changed by 1.9% (198322.00 Gg CO2 / year). 1990-2022 Emissions have changed by 0.8% (49705.81 Gg CO2 / year).
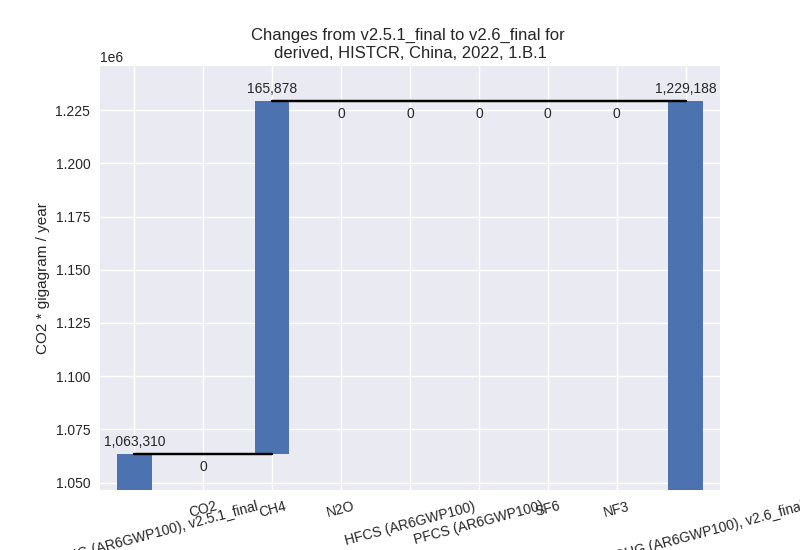
- 1.B.1: Total sectoral emissions in 2022 are
1229188.30 Gg CO2 / year which is 10.4% of category 1 emissions. 2022
Emissions have changed by 15.6%
(165878.30 Gg CO2 / year). 1990-2022 Emissions have changed by 4.5% (25809.54 Gg CO2 / year). For 2022
the changes per gas
are:
For 1990-2022 the changes per gas are: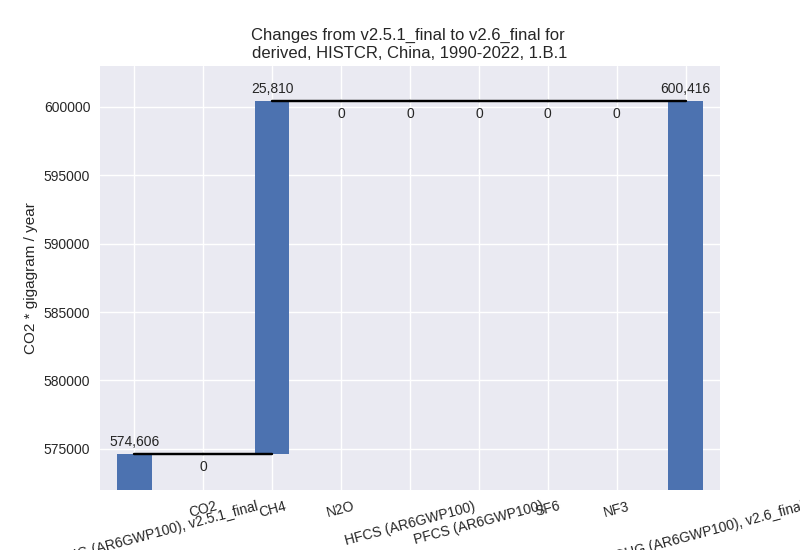
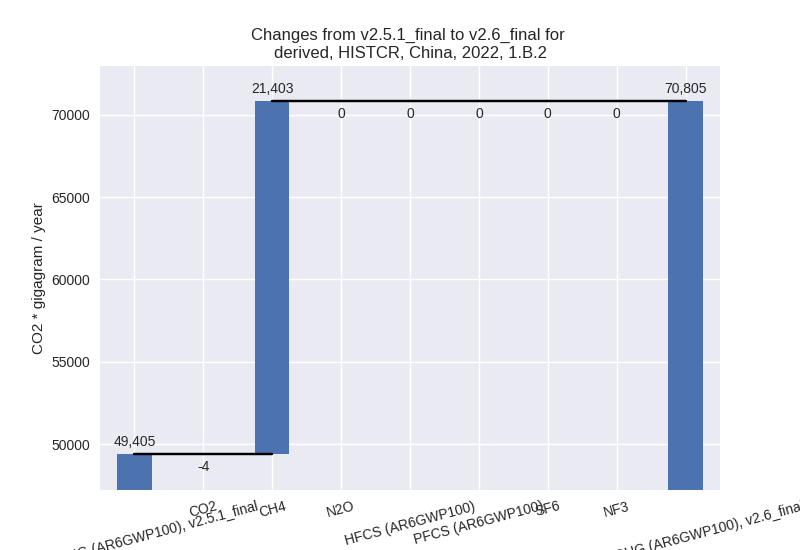
There is no subsector information available in PRIMAP-hist. - 1.B.2: Total sectoral emissions in 2022 are
70804.51 Gg CO2 / year which is 0.6% of category 1 emissions. 2022
Emissions have changed by 43.3%
(21399.06 Gg CO2 / year). 1990-2022 Emissions have changed by 14.5% (3565.53 Gg CO2 / year). For 2022
the changes per gas
are:
For 1990-2022 the changes per gas are: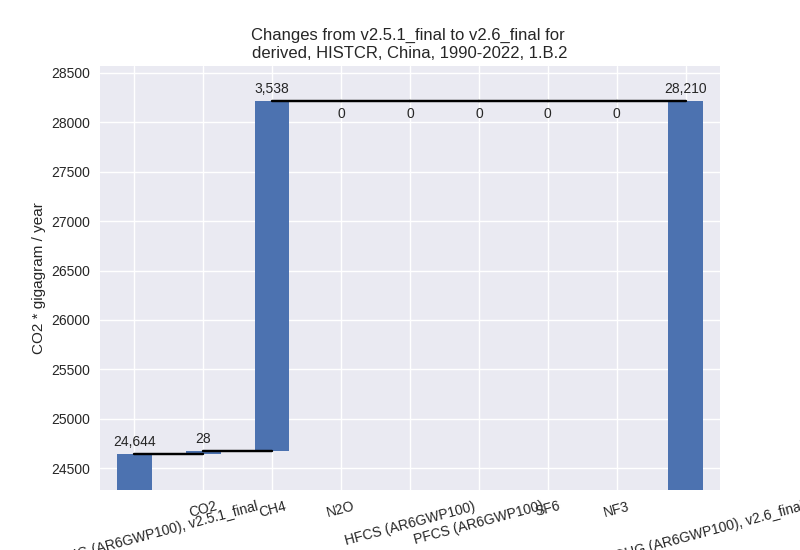
There is no subsector information available in PRIMAP-hist.
- 2: Total sectoral emissions in 2022 are 2099645.90
Gg CO2 / year which is 13.9% of M.0.EL emissions. 2022 Emissions have
changed by 11.7% (220020.20 Gg CO2 /
year). 1990-2022 Emissions have changed by 3.8% (39348.92 Gg CO2 / year). For 2022
the changes per gas
are:
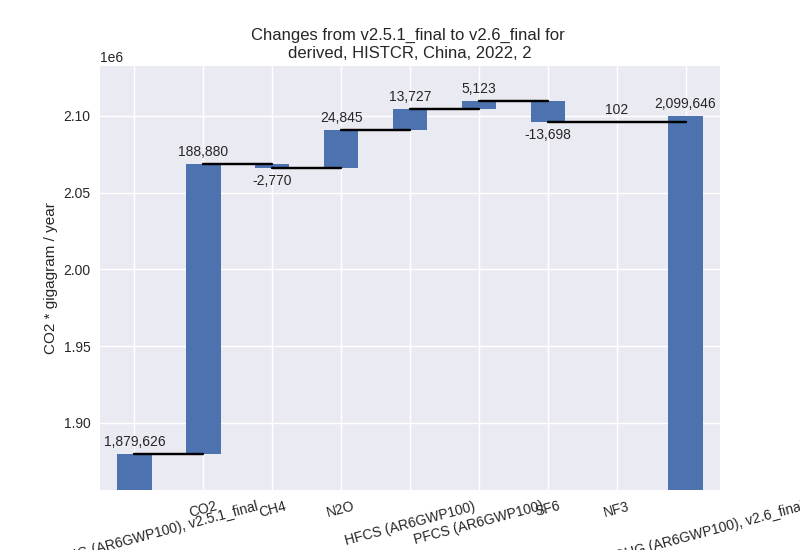
For 1990-2022 the changes per gas are: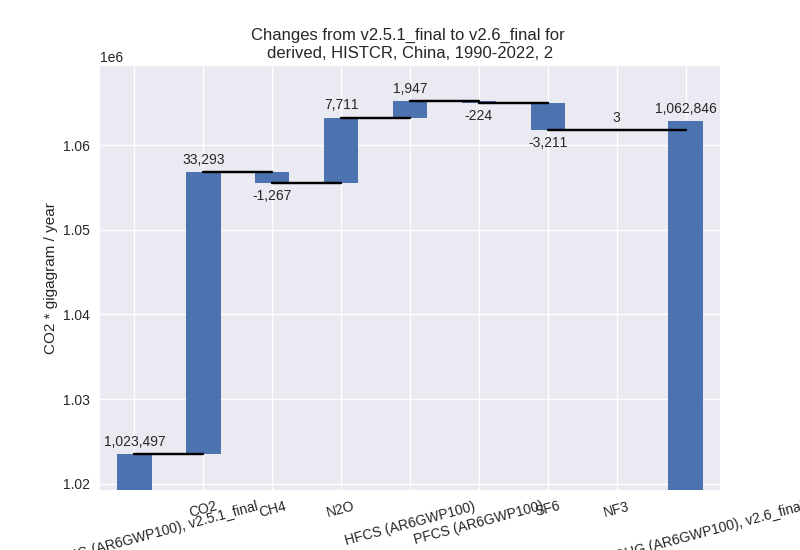
- M.AG: Total sectoral emissions in 2022 are 906892.14 Gg CO2 / year which is 6.0% of M.0.EL emissions. 2022 Emissions have changed by 1.0% (8746.80 Gg CO2 / year). 1990-2022 Emissions have changed by -0.6% (-5386.30 Gg CO2 / year).
- 4: Total sectoral emissions in 2022 are 267274.47
Gg CO2 / year which is 1.8% of M.0.EL emissions. 2022 Emissions have
changed by -6.3% (-17931.23 Gg CO2 /
year). 1990-2022 Emissions have changed by -2.0% (-4172.82 Gg CO2 / year). For 2022
the changes per gas
are:
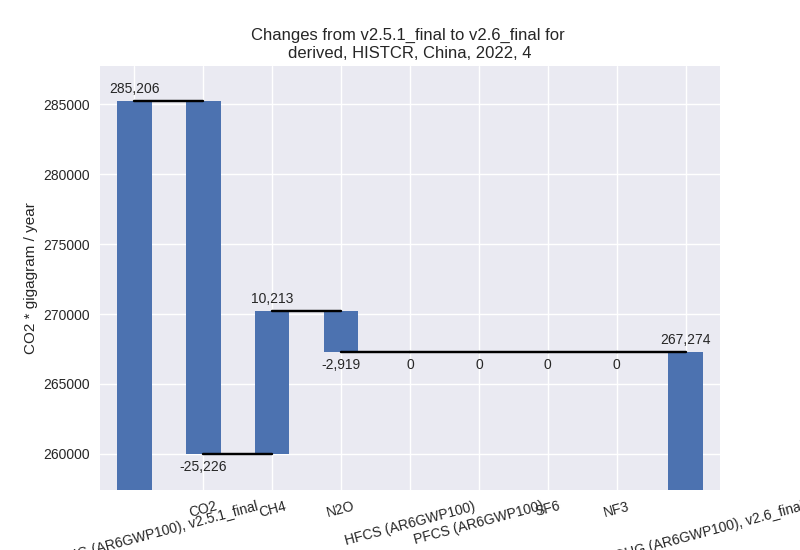
For 1990-2022 the changes per gas are: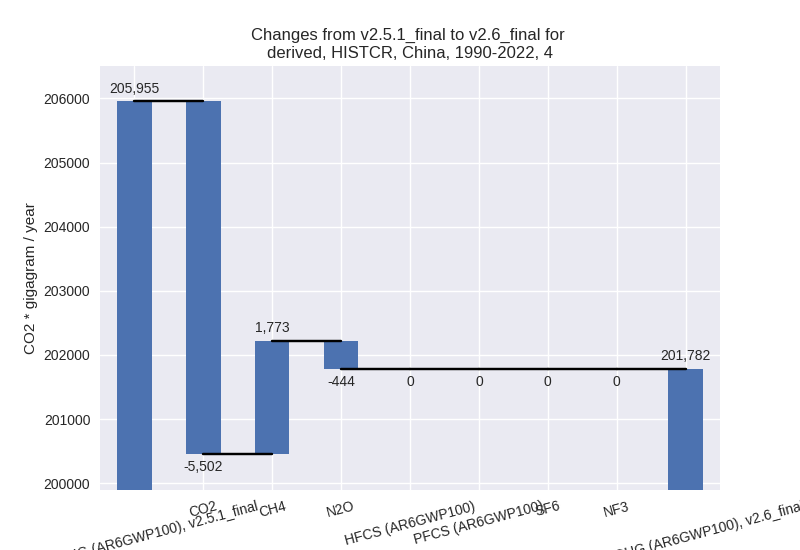
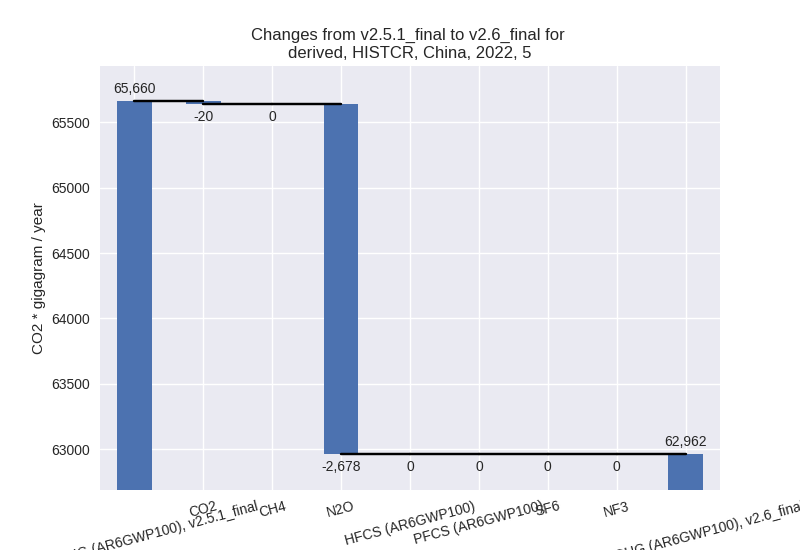
- 5: Total sectoral emissions in 2022 are 62961.95 Gg
CO2 / year which is 0.4% of M.0.EL emissions. 2022 Emissions have
changed by -4.1% (-2698.09 Gg CO2 /
year). 1990-2022 Emissions have changed by 1.7% (921.42 Gg CO2 / year). For 2022 the
changes per gas
are:
third party scenario (HISTTP):
Most important changes per time frame
For 2022 the following sector-gas combinations have the highest absolute impact on national total KyotoGHG (AR6GWP100) emissions in 2022 (top 5):
- 1: 1.A, CO2 with 28003.00 Gg CO2 / year (0.3%)
- 2: 2, HFCS (AR6GWP100) with 19983.39 Gg CO2 / year (5.8%)
- 3: 2, CO2 with -7400.00 Gg CO2 / year (-0.6%)
- 4: 4, CH4 with -4661.03 Gg CO2 / year (-1.0%)
- 5: 5, N2O with -2678.09 Gg CO2 / year (-7.7%)
For 1990-2022 the following sector-gas combinations have the highest absolute impact on national total KyotoGHG (AR6GWP100) emissions in 1990-2022 (top 5):
- 1: 4, CH4 with -5997.54 Gg CO2 / year (-1.9%)
- 2: 2, CO2 with -2130.30 Gg CO2 / year (-0.3%)
- 3: 5, N2O with 941.42 Gg CO2 / year (3.8%)
- 4: 2, HFCS (AR6GWP100) with 605.56 Gg CO2 / year (0.4%)
- 5: 4, N2O with 525.69 Gg CO2 / year (2.6%)
Changes in the main sectors for aggregate KyotoGHG (AR6GWP100) are
- 1: Total sectoral emissions in 2022 are 11726280.00 Gg CO2 / year which is 79.6% of M.0.EL emissions. 2022 Emissions have changed by 0.2% (27999.00 Gg CO2 / year). 1990-2022 Emissions have changed by 0.0% (368.64 Gg CO2 / year).
- 2: Total sectoral emissions in 2022 are 1782728.30 Gg CO2 / year which is 12.1% of M.0.EL emissions. 2022 Emissions have changed by 1.0% (18437.30 Gg CO2 / year). 1990-2022 Emissions have changed by 0.0% (222.51 Gg CO2 / year).
- M.AG: Total sectoral emissions in 2022 are 656423.37 Gg CO2 / year which is 4.5% of M.0.EL emissions. 2022 Emissions have changed by 0.0% (0.00 Gg CO2 / year). 1990-2022 Emissions have changed by 0.0% (0.00 Gg CO2 / year).
- 4: Total sectoral emissions in 2022 are 494296.44 Gg CO2 / year which is 3.4% of M.0.EL emissions. 2022 Emissions have changed by -1.0% (-5112.97 Gg CO2 / year). 1990-2022 Emissions have changed by -1.6% (-5548.58 Gg CO2 / year).
- 5: Total sectoral emissions in 2022 are 62961.95 Gg
CO2 / year which is 0.4% of M.0.EL emissions. 2022 Emissions have
changed by -4.1% (-2698.09 Gg CO2 /
year). 1990-2022 Emissions have changed by 1.7% (921.42 Gg CO2 / year). For 2022 the
changes per gas
are:
