Changes in PRIMAP-hist v2.6.1_final compared to v2.6_final for Albania
2025-03-19
Johannes Gütschow
Change analysis for Albania for PRIMAP-hist v2.6.1_final compared to v2.6_final
Overview over emissions by sector and gas
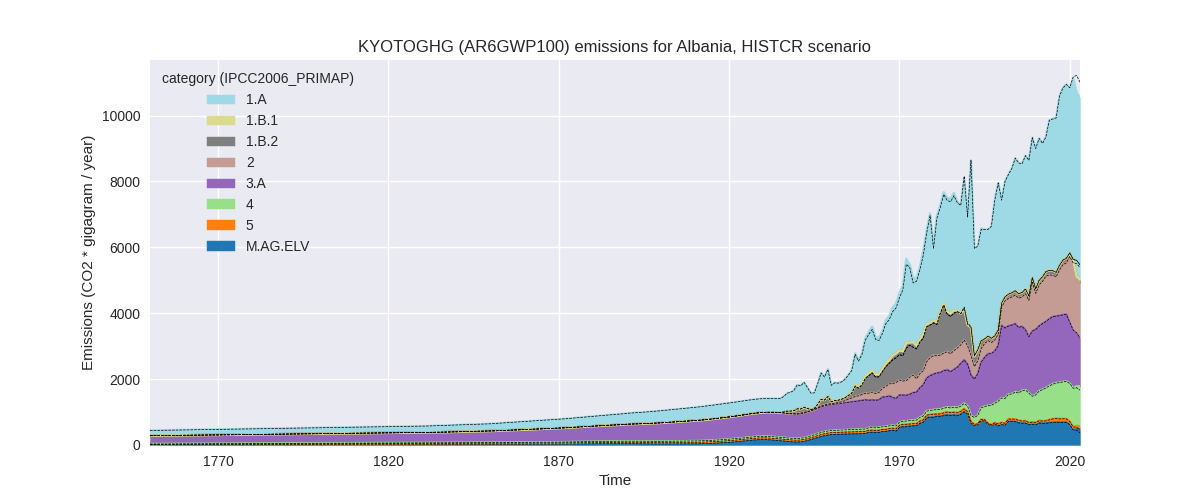
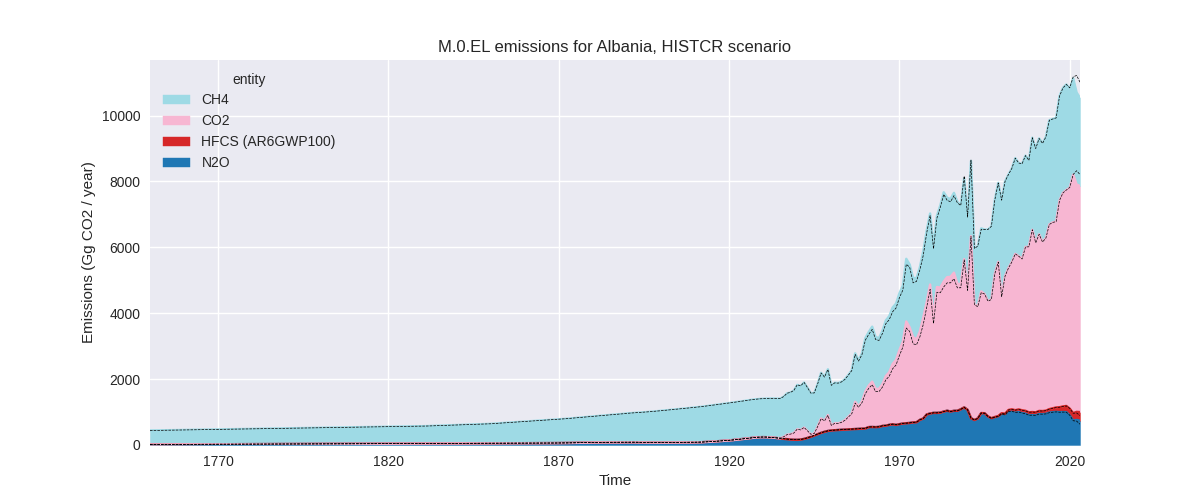
The following figures show the aggregate national total emissions excluding LULUCF AR6GWP100 for the country reported priority scenario. The dotted linesshow the v2.6_final data.
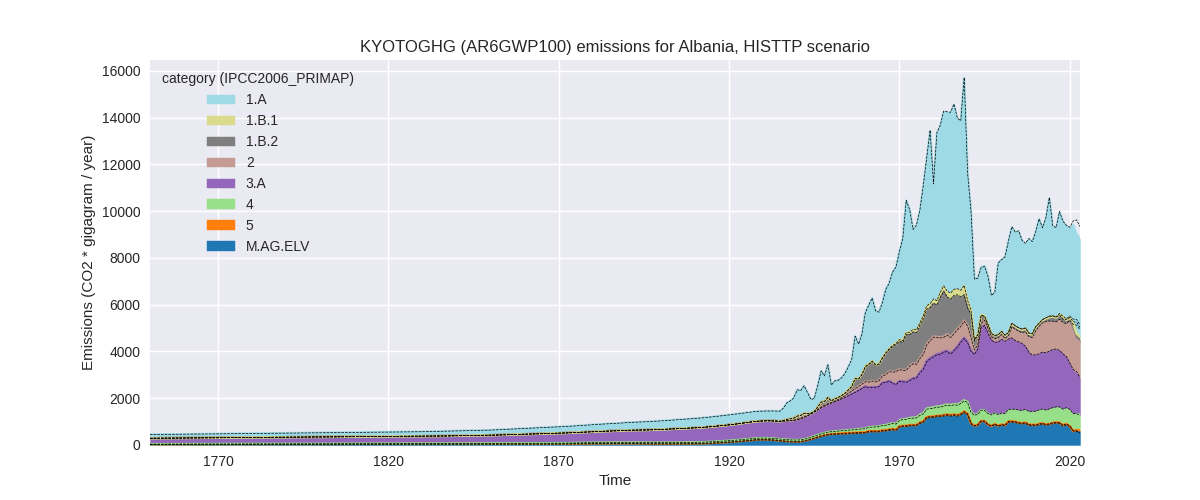
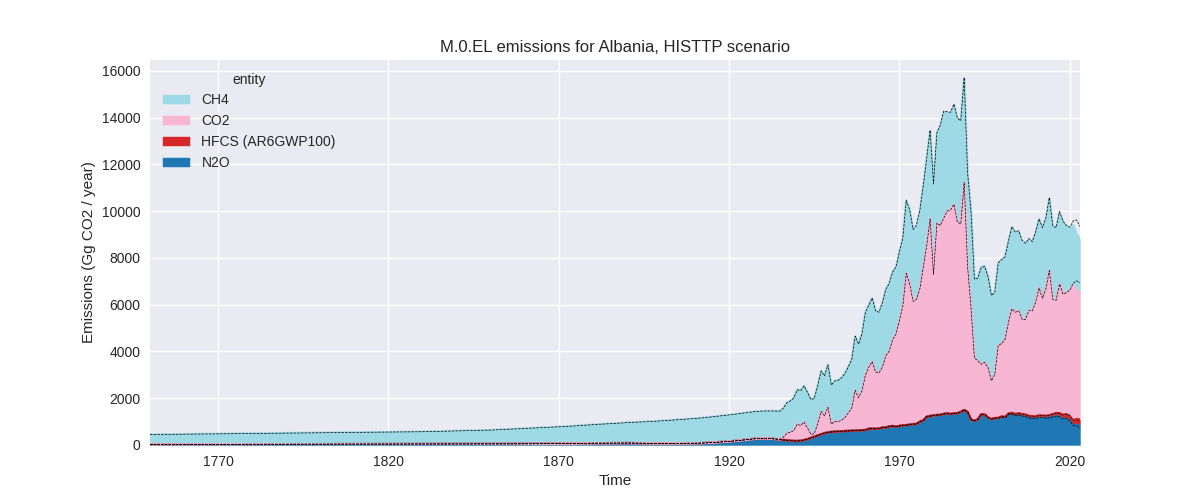
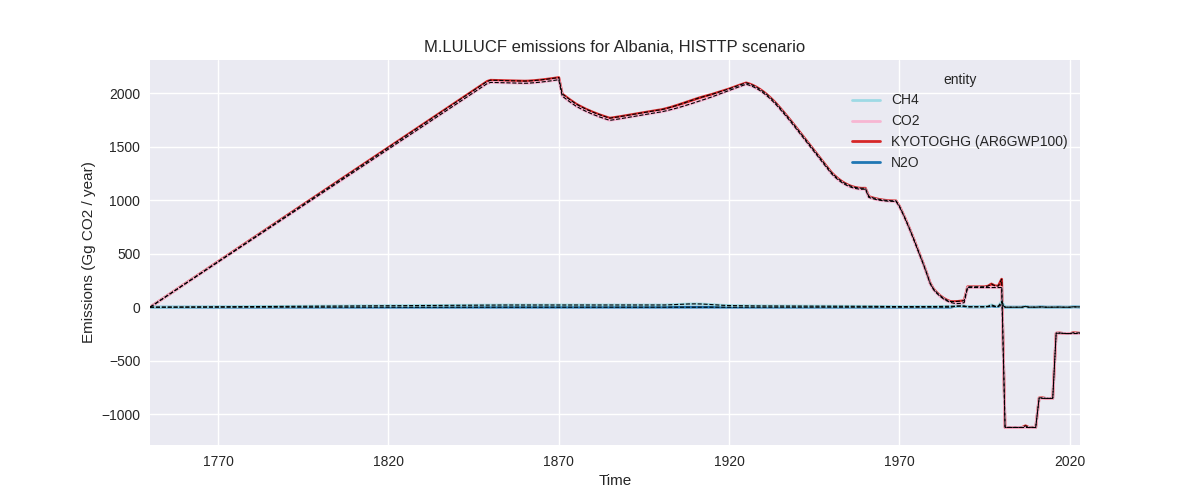
The following figures show the aggregate national total emissions excluding LULUCF AR6GWP100 for the third party priority scenario. The dotted linesshow the v2.6_final data.
Overview over changes
In the country reported priority scenario we have the following changes for aggregate Kyoto GHG and national total emissions excluding LULUCF (M.0.EL):
- Emissions in 2023 have changed by -4.3%% (-478.45 Gg CO2 / year)
- Emissions in 1990-2023 have changed by -0.4%% (-34.72 Gg CO2 / year)
In the third party priority scenario we have the following changes for aggregate Kyoto GHG and national total emissions excluding LULUCF (M.0.EL):
- Emissions in 2023 have changed by -5.6%% (-523.99 Gg CO2 / year)
- Emissions in 1990-2023 have changed by -0.7%% (-57.47 Gg CO2 / year)
Most important changes per scenario and time frame
In the country reported priority scenario the following sector-gas combinations have the highest absolute impact on national total KyotoGHG (AR6GWP100) emissions in 2023 (top 5):
- 1: 2, CO2 with -446.28 Gg CO2 / year (-23.9%)
- 2: 3.A, CH4 with -125.04 Gg CO2 / year (-8.4%)
- 3: M.AG.ELV, N2O with 102.06 Gg CO2 / year (30.1%)
- 4: 1.A, CH4 with -19.52 Gg CO2 / year (-22.7%)
- 5: 5, N2O with 11.33 Gg CO2 / year (13.7%)
In the country reported priority scenario the following sector-gas combinations have the highest absolute impact on national total KyotoGHG (AR6GWP100) emissions in 1990-2023 (top 5):
- 1: 2, CO2 with -26.27 Gg CO2 / year (-2.8%)
- 2: 3.A, CH4 with -7.68 Gg CO2 / year (-0.5%)
- 3: 1.B.2, CH4 with -5.39 Gg CO2 / year (-3.1%)
- 4: M.AG.ELV, N2O with 3.57 Gg CO2 / year (0.6%)
- 5: 1.B.2, CO2 with 2.89 Gg CO2 / year (678.3%)
In the third party priority scenario the following sector-gas combinations have the highest absolute impact on national total KyotoGHG (AR6GWP100) emissions in 2023 (top 5):
- 1: 2, CO2 with -467.36 Gg CO2 / year (-26.6%)
- 2: M.AG.ELV, N2O with 109.34 Gg CO2 / year (25.6%)
- 3: 4, CH4 with -62.54 Gg CO2 / year (-10.4%)
- 4: 3.A, CH4 with -61.35 Gg CO2 / year (-4.0%)
- 5: M.AG.ELV, CO2 with -21.00 Gg CO2 / year (-30.0%)
In the third party priority scenario the following sector-gas combinations have the highest absolute impact on national total KyotoGHG (AR6GWP100) emissions in 1990-2023 (top 5):
- 1: 4, CH4 with -42.80 Gg CO2 / year (-9.4%)
- 2: 2, CO2 with -28.71 Gg CO2 / year (-4.0%)
- 3: 1.B.1, CH4 with 26.44 Gg CO2 / year (87.4%)
- 4: 1.B.2, CH4 with -6.55 Gg CO2 / year (-3.3%)
- 5: 3.A, CH4 with -6.09 Gg CO2 / year (-0.2%)
Notes on data changes
Here we list notes explaining important emissions changes for the country.
- There is no new country reported data for Albania. Chnages in both CR ant TP time-series are small and come from updated EDGAR and FAO data.
Changes by sector and gas
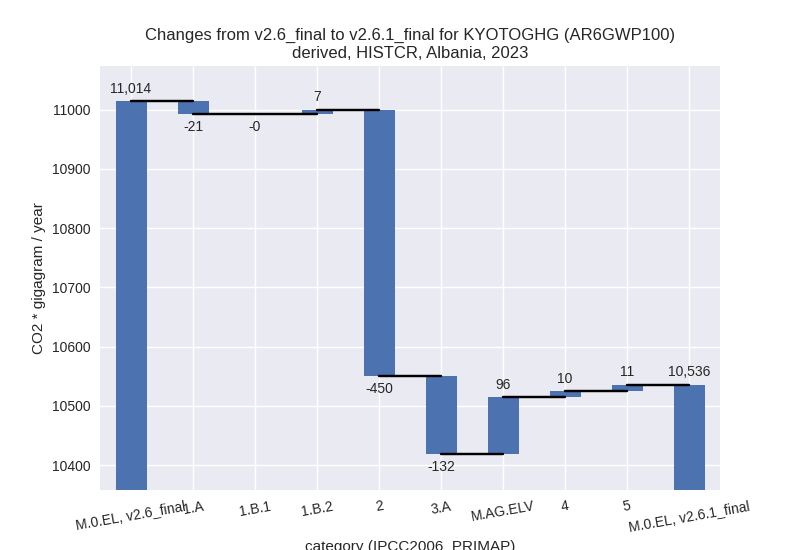
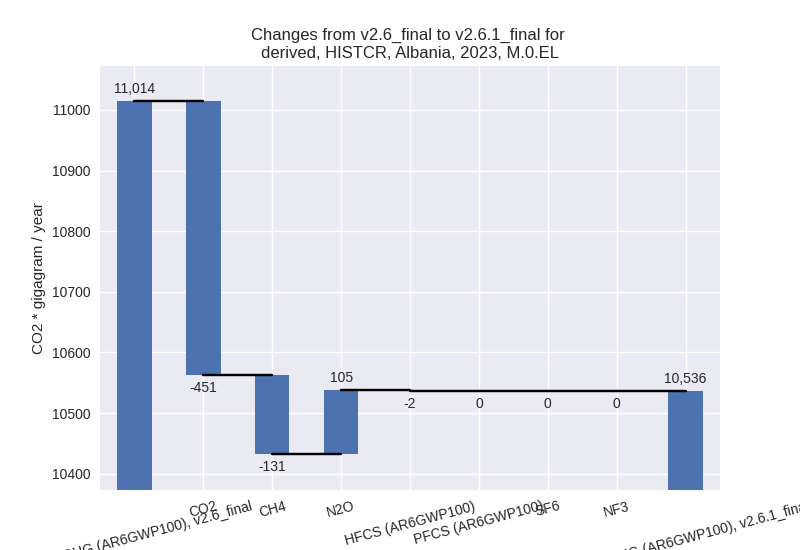
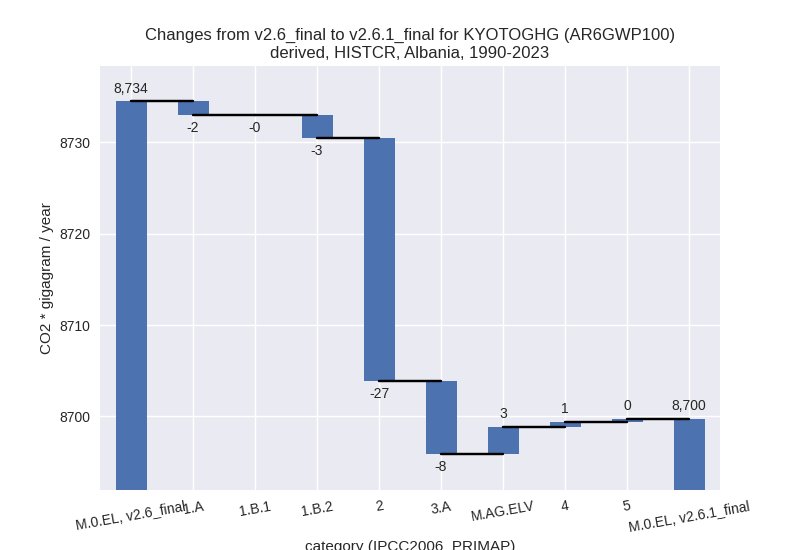
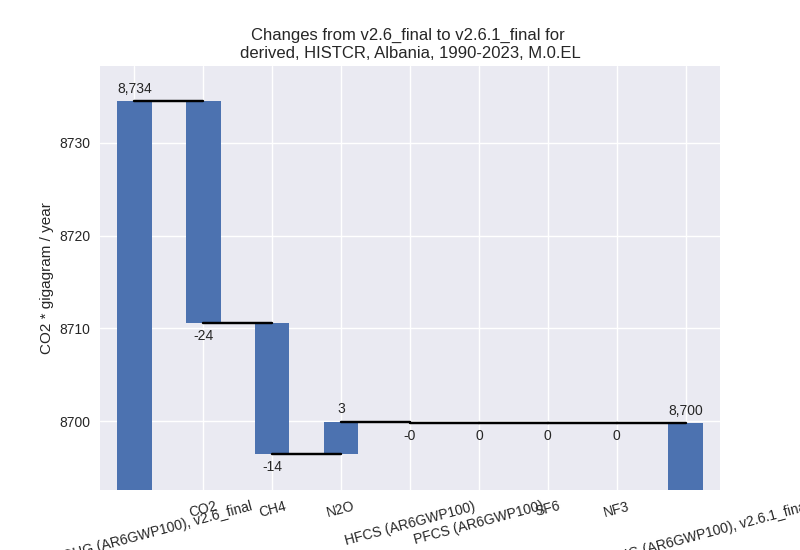
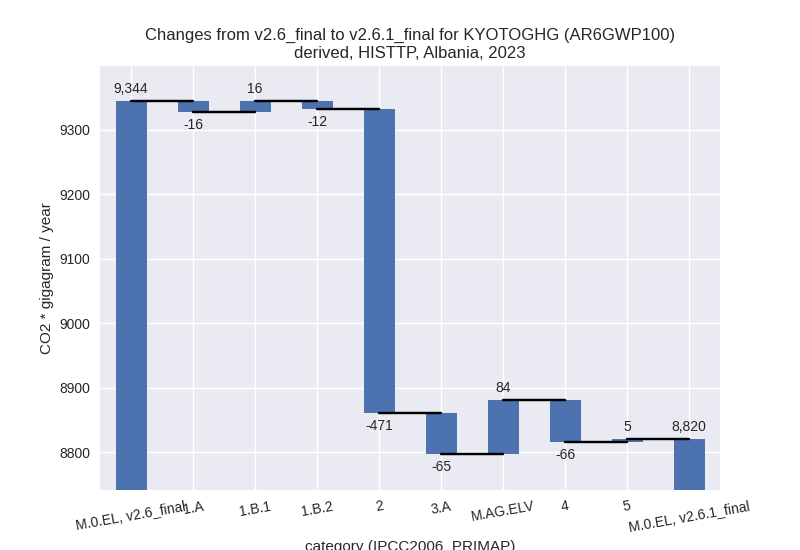
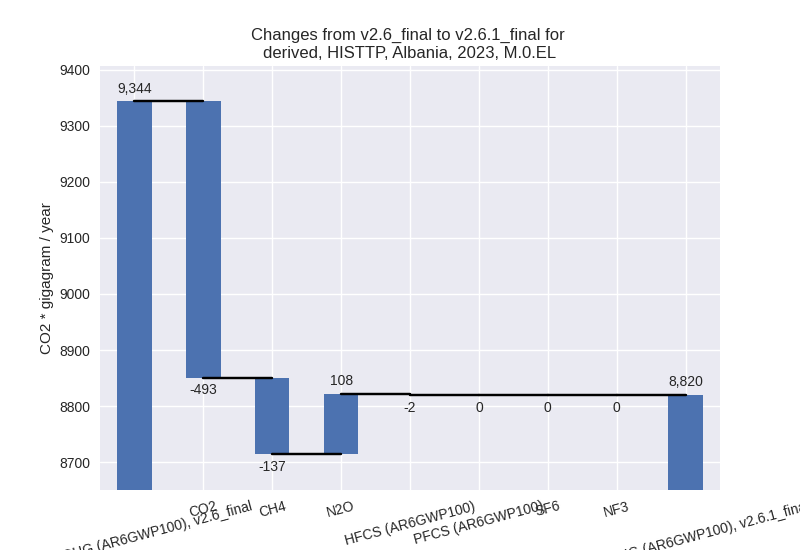
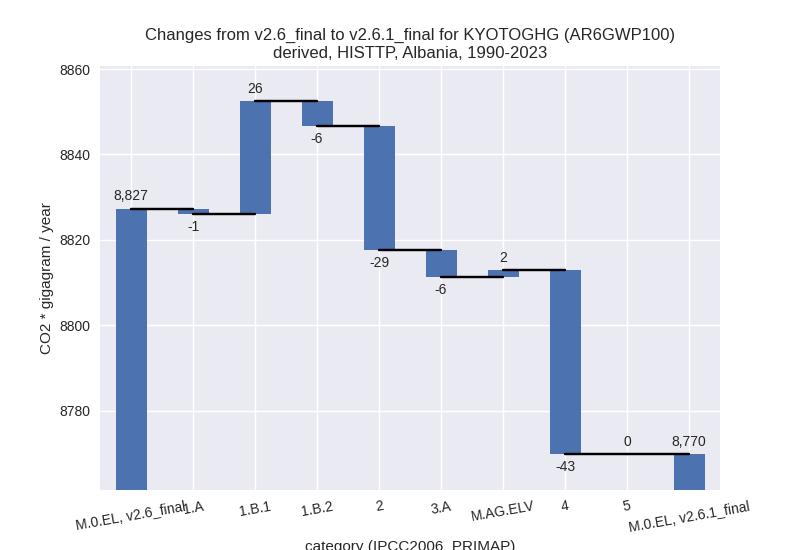
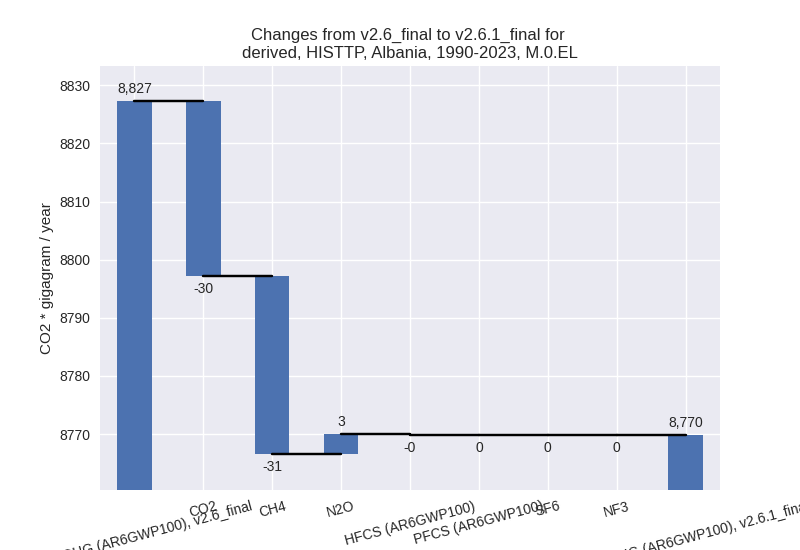
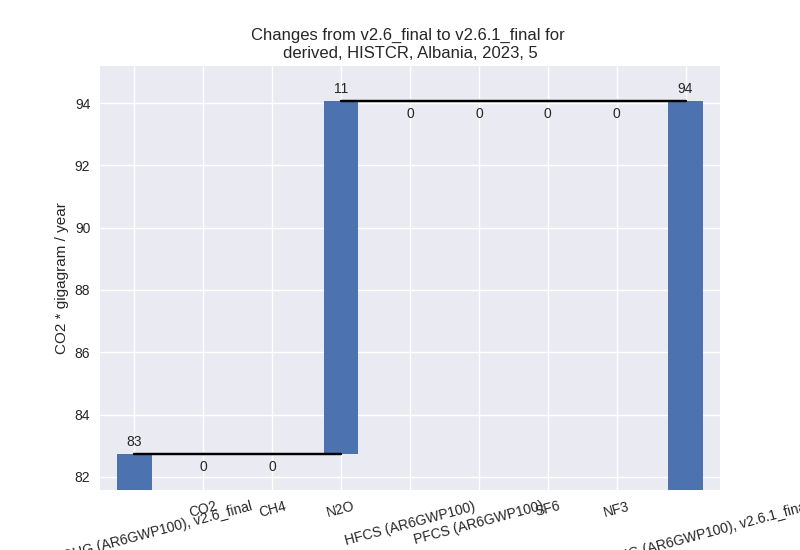
For each scenario and time frame the changes are displayed for all individual sectors and all individual gases. In the sector plot we use aggregate Kyoto GHGs in AR6GWP100. In the gas plot we usenational total emissions without LULUCF.
country reported scenario
2023
1990-2023
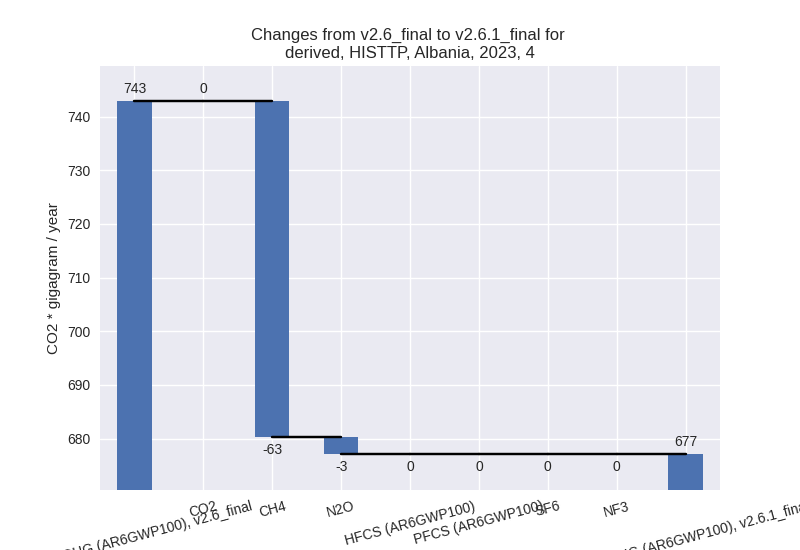
third party scenario
2023
1990-2023
Detailed changes for the scenarios:
country reported scenario (HISTCR):
Most important changes per time frame
For 2023 the following sector-gas combinations have the highest absolute impact on national total KyotoGHG (AR6GWP100) emissions in 2023 (top 5):
- 1: 2, CO2 with -446.28 Gg CO2 / year (-23.9%)
- 2: 3.A, CH4 with -125.04 Gg CO2 / year (-8.4%)
- 3: M.AG.ELV, N2O with 102.06 Gg CO2 / year (30.1%)
- 4: 1.A, CH4 with -19.52 Gg CO2 / year (-22.7%)
- 5: 5, N2O with 11.33 Gg CO2 / year (13.7%)
For 1990-2023 the following sector-gas combinations have the highest absolute impact on national total KyotoGHG (AR6GWP100) emissions in 1990-2023 (top 5):
- 1: 2, CO2 with -26.27 Gg CO2 / year (-2.8%)
- 2: 3.A, CH4 with -7.68 Gg CO2 / year (-0.5%)
- 3: 1.B.2, CH4 with -5.39 Gg CO2 / year (-3.1%)
- 4: M.AG.ELV, N2O with 3.57 Gg CO2 / year (0.6%)
- 5: 1.B.2, CO2 with 2.89 Gg CO2 / year (678.3%)
Changes in the main sectors for aggregate KyotoGHG (AR6GWP100) are
- 1: Total sectoral emissions in 2022 are 5688.40 Gg CO2 / year which is 53.2% of M.0.EL emissions. 2023 Emissions have changed by -0.3% (-14.17 Gg CO2 / year). 1990-2023 Emissions have changed by -0.1% (-4.05 Gg CO2 / year).
- 2: Total sectoral emissions in 2022 are 1645.88 Gg
CO2 / year which is 15.4% of M.0.EL emissions. 2023 Emissions have
changed by -21.0% (-449.96 Gg CO2 /
year). 1990-2023 Emissions have changed by -2.6% (-26.53 Gg CO2 / year). For 2023 the
changes per gas
are:

For 1990-2023 the changes per gas are: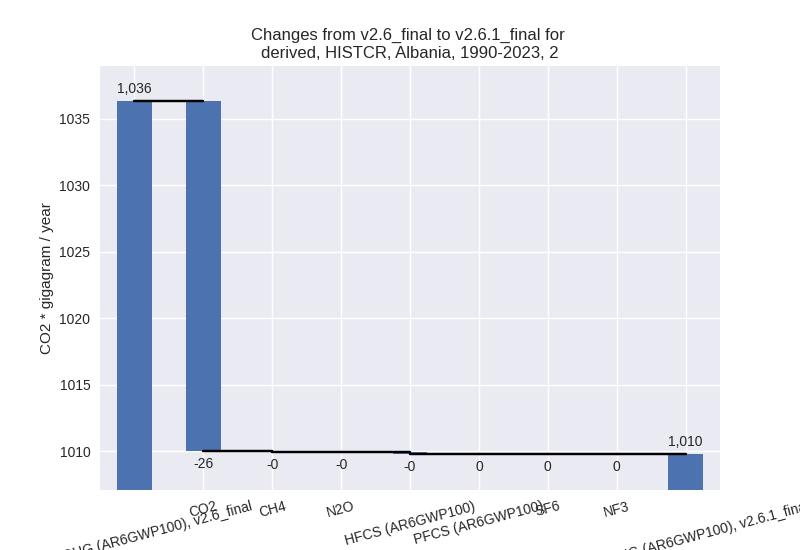
- M.AG: Total sectoral emissions in 2022 are 2068.65 Gg CO2 / year which is 19.3% of M.0.EL emissions. 2023 Emissions have changed by -1.8% (-35.27 Gg CO2 / year). 1990-2023 Emissions have changed by -0.2% (-5.04 Gg CO2 / year).
- 4: Total sectoral emissions in 2022 are 1200.98 Gg CO2 / year which is 11.2% of M.0.EL emissions. 2023 Emissions have changed by 0.8% (9.61 Gg CO2 / year). 1990-2023 Emissions have changed by 0.1% (0.55 Gg CO2 / year).
- 5: Total sectoral emissions in 2022 are 95.98 Gg
CO2 / year which is 0.9% of M.0.EL emissions. 2023 Emissions have
changed by 13.7% (11.33 Gg CO2 /
year). 1990-2023 Emissions have changed by 0.5% (0.35 Gg CO2 / year). For 2023 the
changes per gas
are:
third party scenario (HISTTP):
Most important changes per time frame
For 2023 the following sector-gas combinations have the highest absolute impact on national total KyotoGHG (AR6GWP100) emissions in 2023 (top 5):
- 1: 2, CO2 with -467.36 Gg CO2 / year (-26.6%)
- 2: M.AG.ELV, N2O with 109.34 Gg CO2 / year (25.6%)
- 3: 4, CH4 with -62.54 Gg CO2 / year (-10.4%)
- 4: 3.A, CH4 with -61.35 Gg CO2 / year (-4.0%)
- 5: M.AG.ELV, CO2 with -21.00 Gg CO2 / year (-30.0%)
For 1990-2023 the following sector-gas combinations have the highest absolute impact on national total KyotoGHG (AR6GWP100) emissions in 1990-2023 (top 5):
- 1: 4, CH4 with -42.80 Gg CO2 / year (-9.4%)
- 2: 2, CO2 with -28.71 Gg CO2 / year (-4.0%)
- 3: 1.B.1, CH4 with 26.44 Gg CO2 / year (87.4%)
- 4: 1.B.2, CH4 with -6.55 Gg CO2 / year (-3.3%)
- 5: 3.A, CH4 with -6.09 Gg CO2 / year (-0.2%)
Changes in the main sectors for aggregate KyotoGHG (AR6GWP100) are
- 1: Total sectoral emissions in 2022 are 4477.34 Gg CO2 / year which is 49.7% of M.0.EL emissions. 2023 Emissions have changed by -0.3% (-11.59 Gg CO2 / year). 1990-2023 Emissions have changed by 0.5% (19.37 Gg CO2 / year).
- 2: Total sectoral emissions in 2022 are 1510.98 Gg
CO2 / year which is 16.8% of M.0.EL emissions. 2023 Emissions have
changed by -23.2% (-471.04 Gg CO2 /
year). 1990-2023 Emissions have changed by -3.6% (-28.97 Gg CO2 / year). For 2023 the
changes per gas
are:

For 1990-2023 the changes per gas are: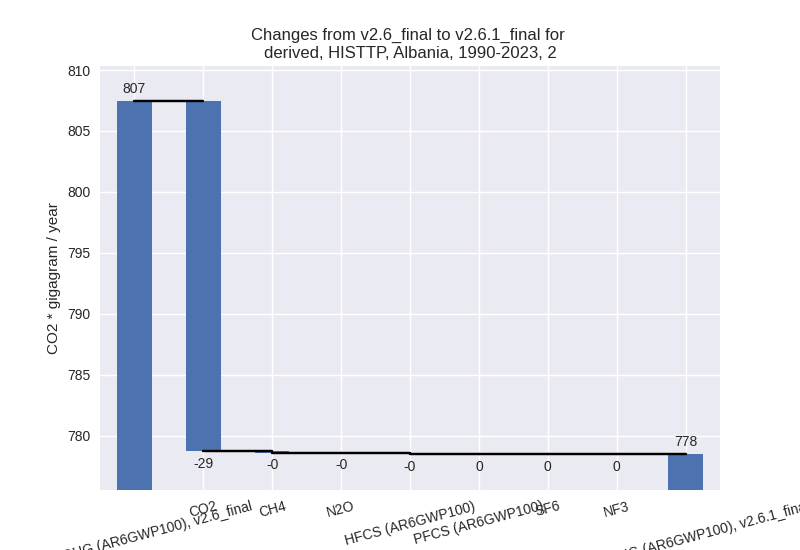
- M.AG: Total sectoral emissions in 2022 are 2314.34 Gg CO2 / year which is 25.7% of M.0.EL emissions. 2023 Emissions have changed by 0.9% (19.38 Gg CO2 / year). 1990-2023 Emissions have changed by -0.1% (-4.79 Gg CO2 / year).
- 4: Total sectoral emissions in 2022 are 665.62 Gg
CO2 / year which is 7.4% of M.0.EL emissions. 2023 Emissions have
changed by -8.9% (-65.75 Gg CO2 /
year). 1990-2023 Emissions have changed by -7.6% (-43.10 Gg CO2 / year). For 2023 the
changes per gas
are:
For 1990-2023 the changes per gas are: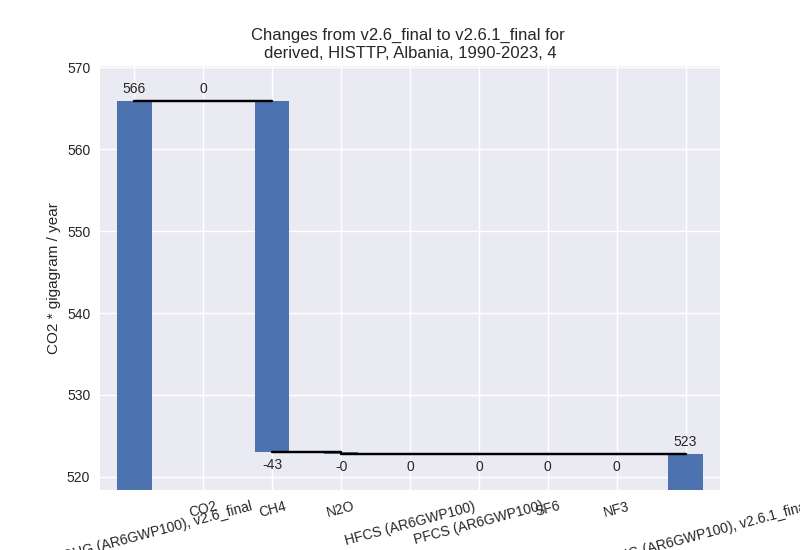
- 5: Total sectoral emissions in 2022 are 32.40 Gg
CO2 / year which is 0.4% of M.0.EL emissions. 2023 Emissions have
changed by 18.7% (5.01 Gg CO2 /
year). 1990-2023 Emissions have changed by 0.1% (0.02 Gg CO2 / year). For 2023 the
changes per gas
are:
