Changes in PRIMAP-hist v2.6.1_final compared to v2.6_final for Argentina
2025-03-19
Johannes Gütschow
Change analysis for Argentina for PRIMAP-hist v2.6.1_final compared to v2.6_final
Overview over emissions by sector and gas
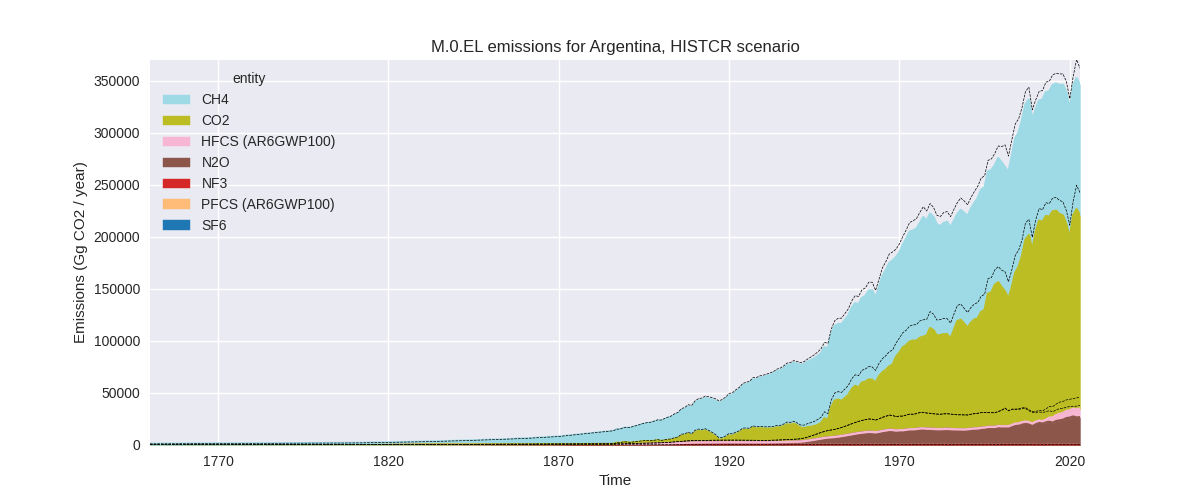
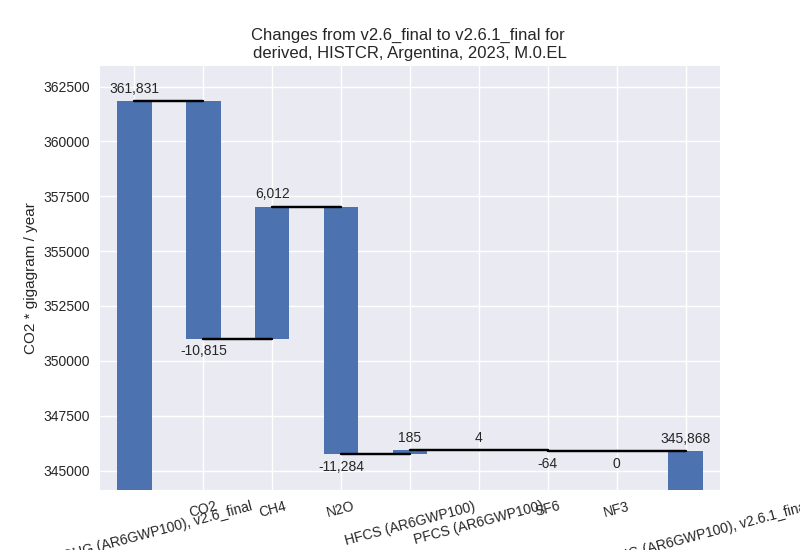
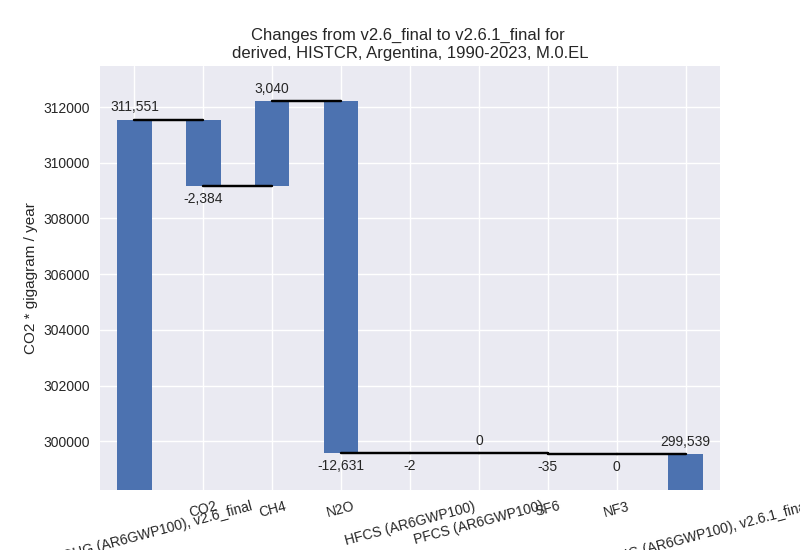
The following figures show the aggregate national total emissions excluding LULUCF AR6GWP100 for the country reported priority scenario. The dotted linesshow the v2.6_final data.
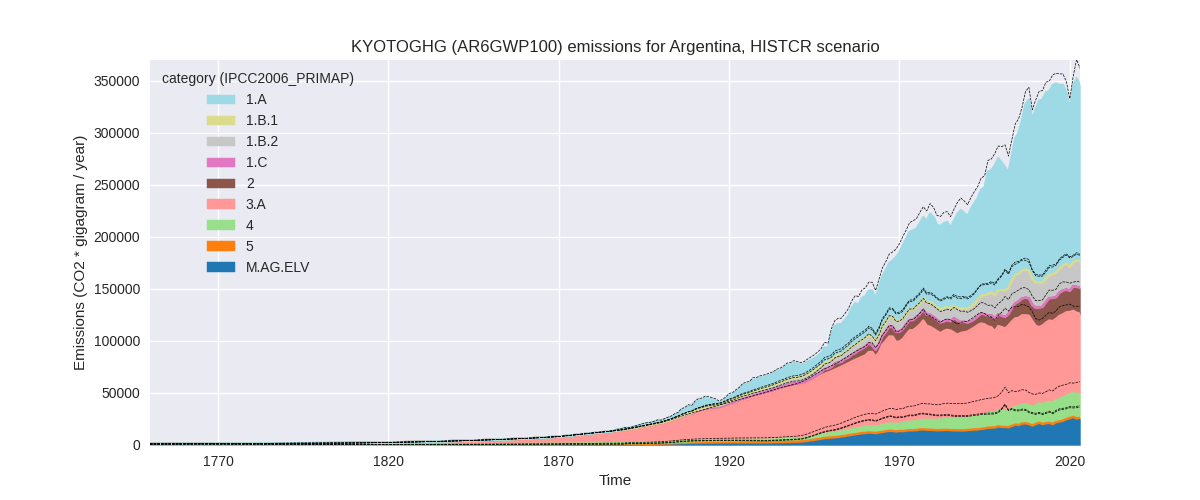
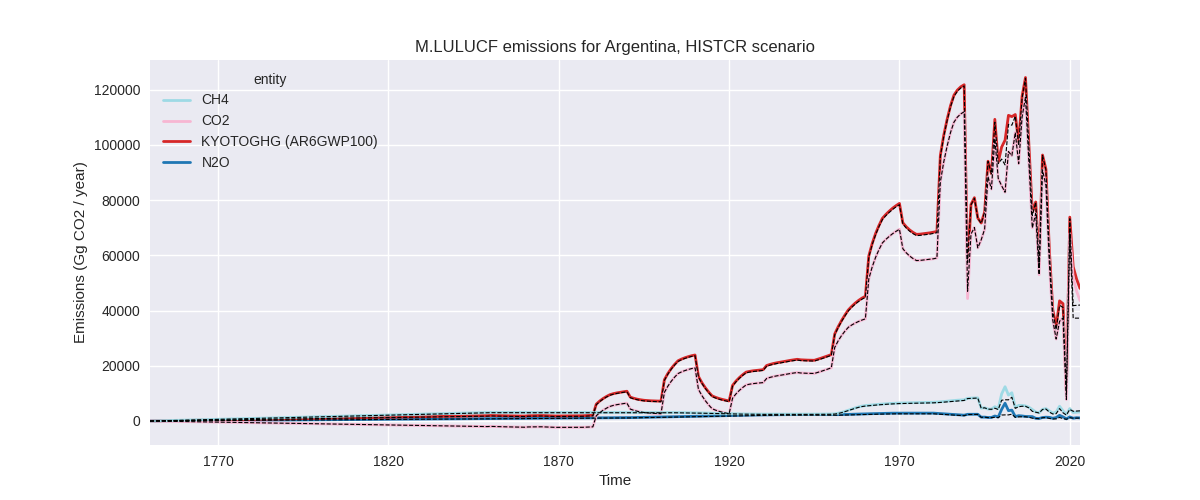
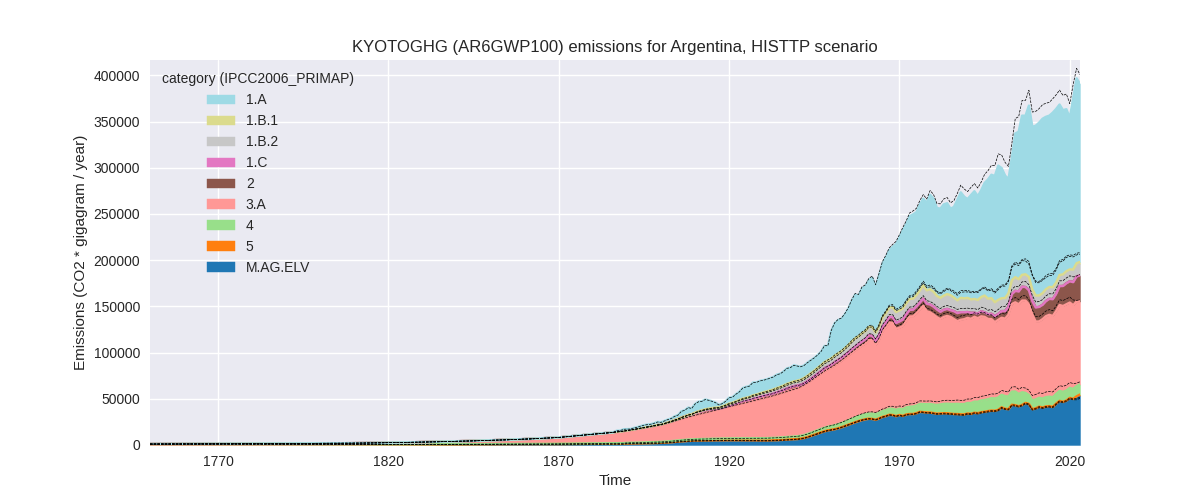
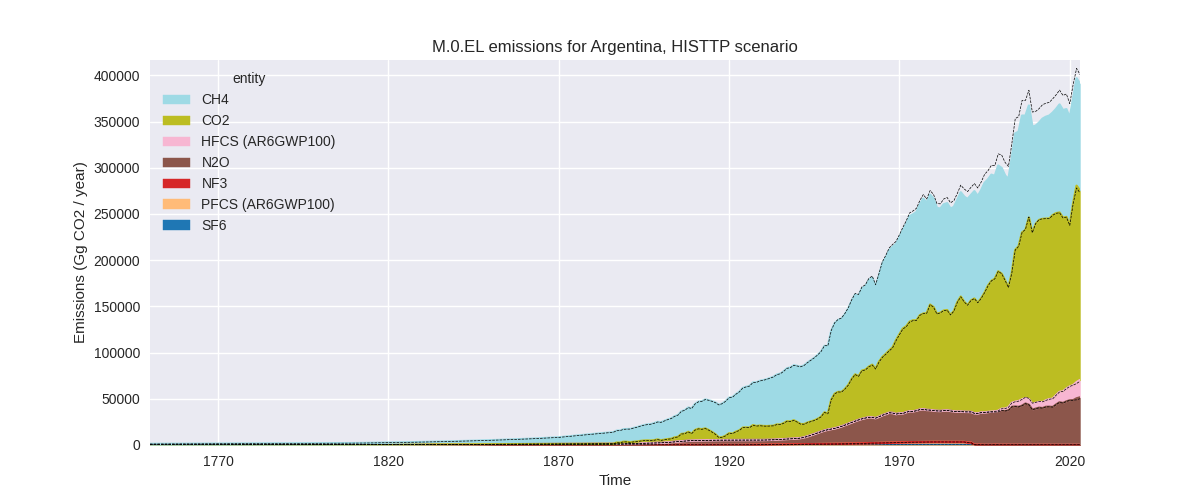
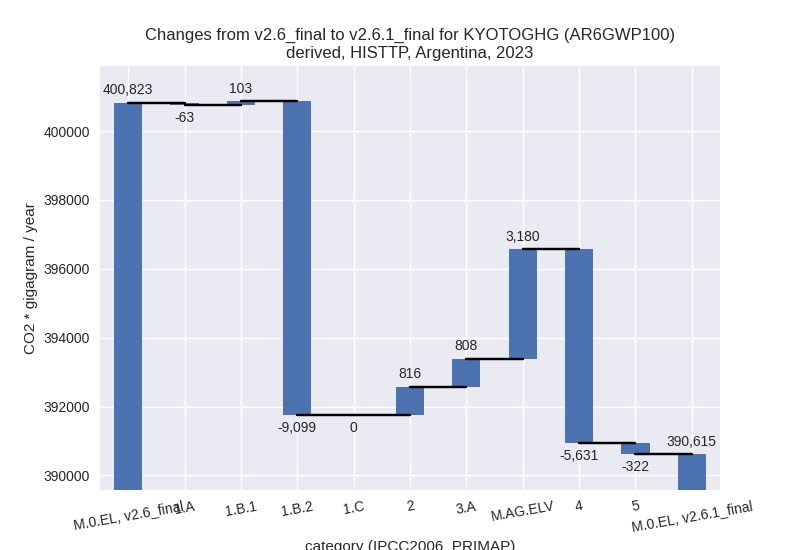
The following figures show the aggregate national total emissions excluding LULUCF AR6GWP100 for the third party priority scenario. The dotted linesshow the v2.6_final data.
Overview over changes
In the country reported priority scenario we have the following changes for aggregate Kyoto GHG and national total emissions excluding LULUCF (M.0.EL):
- Emissions in 2023 have changed by -4.4%% (-15962.64 Gg CO2 / year)
- Emissions in 1990-2023 have changed by -3.9%% (-12011.87 Gg CO2 / year)
In the third party priority scenario we have the following changes for aggregate Kyoto GHG and national total emissions excluding LULUCF (M.0.EL):
- Emissions in 2023 have changed by -2.5%% (-10207.61 Gg CO2 / year)
- Emissions in 1990-2023 have changed by -3.9%% (-13467.93 Gg CO2 / year)
Most important changes per scenario and time frame
In the country reported priority scenario the following sector-gas combinations have the highest absolute impact on national total KyotoGHG (AR6GWP100) emissions in 2023 (top 5):
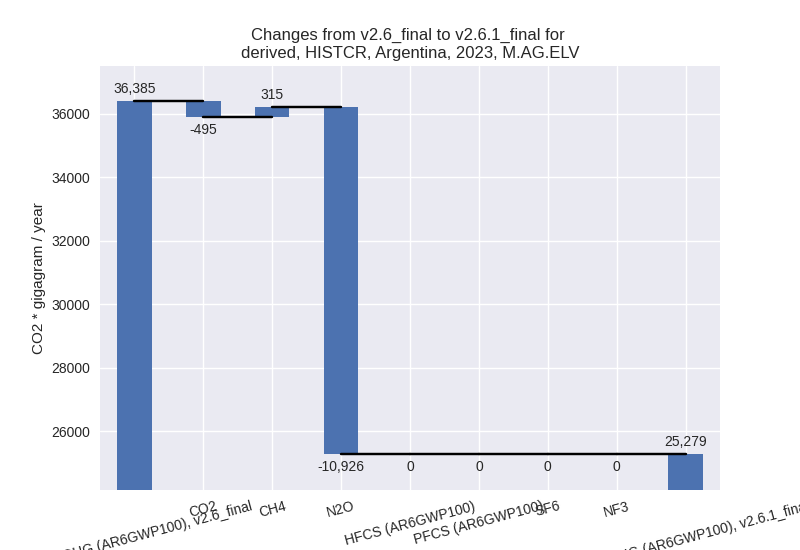
- 1: M.AG.ELV, N2O with -10925.73 Gg CO2 / year (-32.4%)
- 2: 1.A, CO2 with -9913.50 Gg CO2 / year (-5.6%)
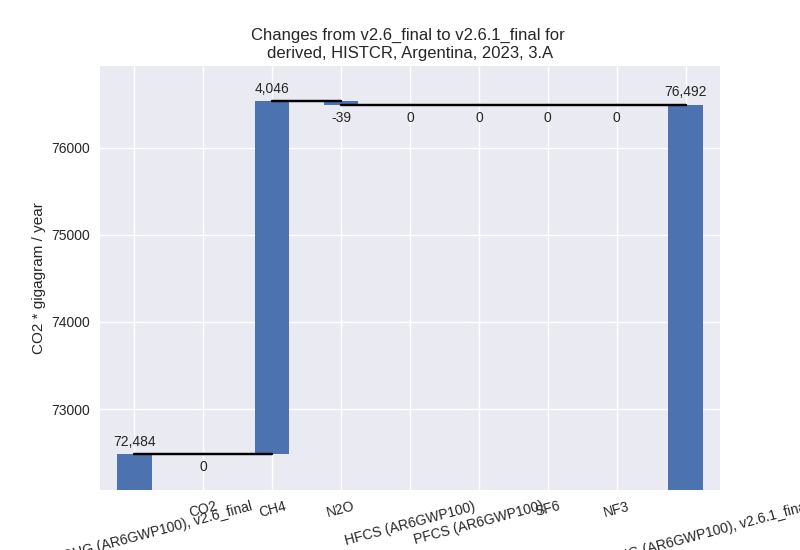
- 3: 3.A, CH4 with 4046.13 Gg CO2 / year (5.6%)
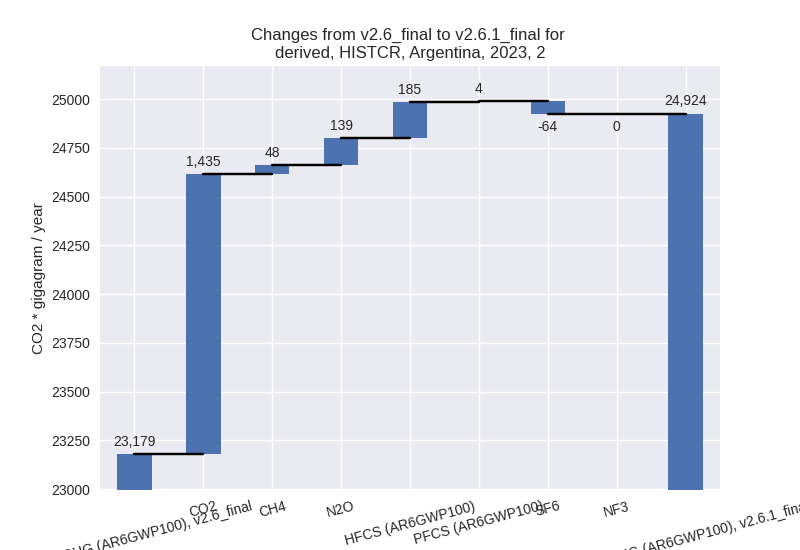
- 4: 2, CO2 with 1434.66 Gg CO2 / year (9.7%)
- 5: 1.B.2, CH4 with 1262.57 Gg CO2 / year (5.3%)
In the country reported priority scenario the following sector-gas combinations have the highest absolute impact on national total KyotoGHG (AR6GWP100) emissions in 1990-2023 (top 5):
- 1: M.AG.ELV, N2O with -12644.34 Gg CO2 / year (-42.2%)
- 2: 3.A, CH4 with 3897.76 Gg CO2 / year (5.1%)
- 3: 1.A, CO2 with -1564.32 Gg CO2 / year (-1.1%)
- 4: 1.B.1, CO2 with -797.73 Gg CO2 / year (-99.7%)
- 5: M.AG.ELV, CH4 with -499.14 Gg CO2 / year (-42.5%)
In the third party priority scenario the following sector-gas combinations have the highest absolute impact on national total KyotoGHG (AR6GWP100) emissions in 2023 (top 5):
- 1: 1.B.2, CH4 with -9098.15 Gg CO2 / year (-46.4%)
- 2: 4, CH4 with -5679.44 Gg CO2 / year (-36.0%)
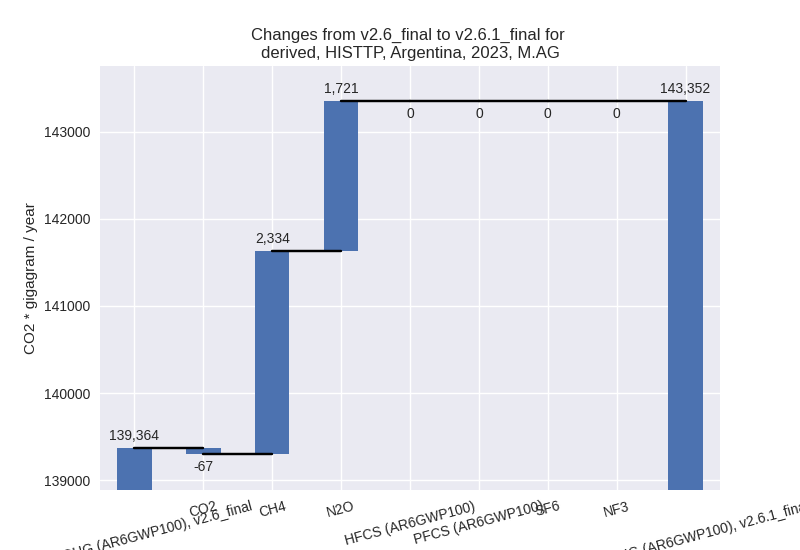
- 3: M.AG.ELV, N2O with 1726.97 Gg CO2 / year (3.8%)
- 4: M.AG.ELV, CH4 with 1519.97 Gg CO2 / year (50.5%)
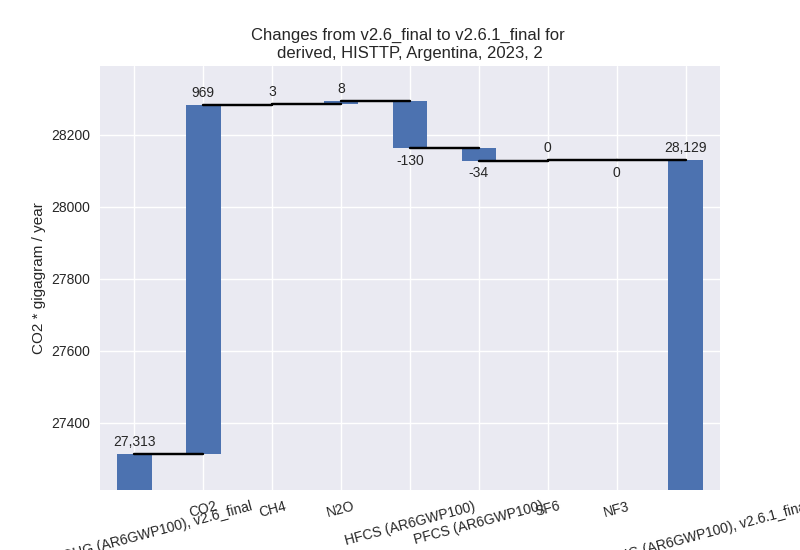
- 5: 2, CO2 with 969.34 Gg CO2 / year (11.9%)
In the third party priority scenario the following sector-gas combinations have the highest absolute impact on national total KyotoGHG (AR6GWP100) emissions in 1990-2023 (top 5):
- 1: 1.B.2, CH4 with -8541.37 Gg CO2 / year (-45.9%)
- 2: 4, CH4 with -5183.94 Gg CO2 / year (-32.1%)
- 3: 2, HFCS (AR6GWP100) with -153.85 Gg CO2 / year (-2.4%)
- 4: 2, CO2 with 143.68 Gg CO2 / year (2.1%)
- 5: M.AG.ELV, N2O with 91.35 Gg CO2 / year (0.3%)
Notes on data changes
Here we list notes explaining important emissions changes for the country.
- CRT data from the first BTR replaces and extends inventory data. The
data covers 1990-2022. The highest changes in 2023 and cumulative
emissions are for N2O in M.AG.ELV, CO2 in 1.A, and CH4 in 3.A.
- For energy CO2 CRT data replaces data based on older inventories and EI growth rates for 2021 and 2022 leading to lower emissions in 2022 and 2023.
- N2O emissions in M.AG.ELV are over 30% lower in 2023 and over 40% lower cumulatively because the CRT emissions are much lower than emission in earlier inventories.
- CH4 emissions from livestock (3.A) are around 5% higher than in the previous version of PRIMAP-hist. The reason is again a change in the country reported emissions.
- In the third party priority scenario we have high changes in Waste
CH4 (-32/-36%) and fugitive CH4 from oil and gas (-46%) which come
directly from the updated EDGAR data.
- For 2023 CH4 from M.AG.ELV is over 40% higher than in the previous release because the new FAO data shows increasing emissions while the projection used in v2.6 showed lower emissions.
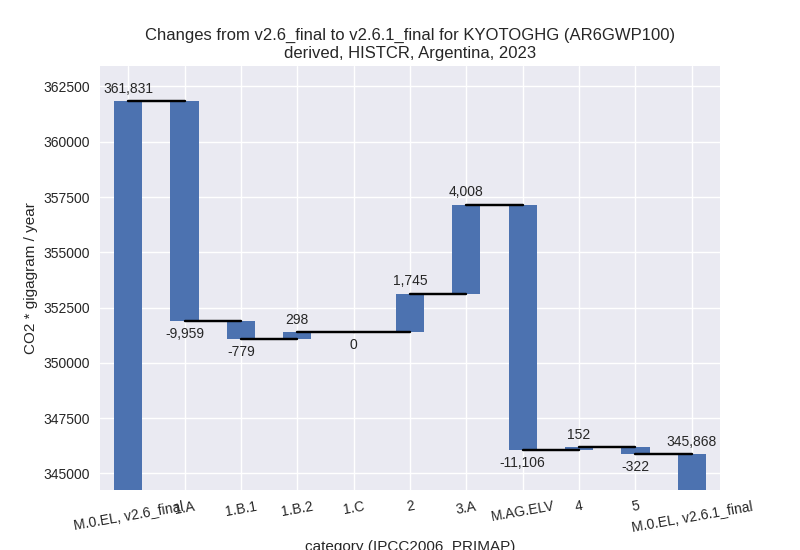
Changes by sector and gas
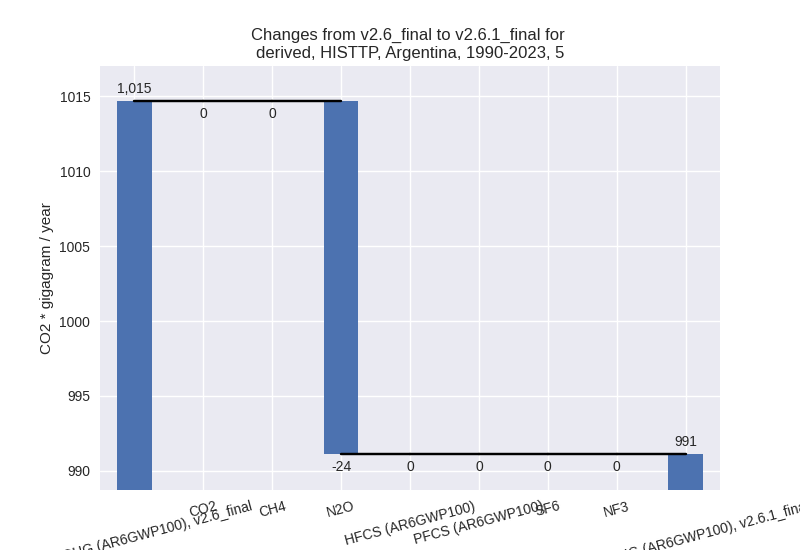
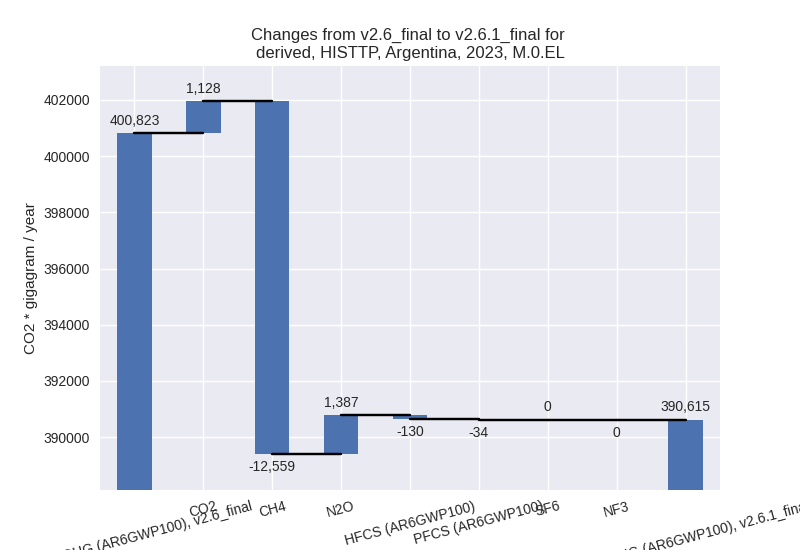
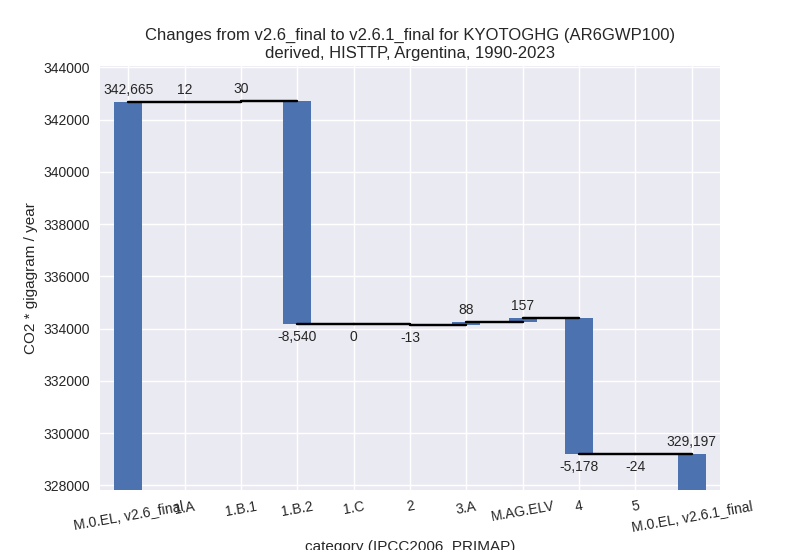
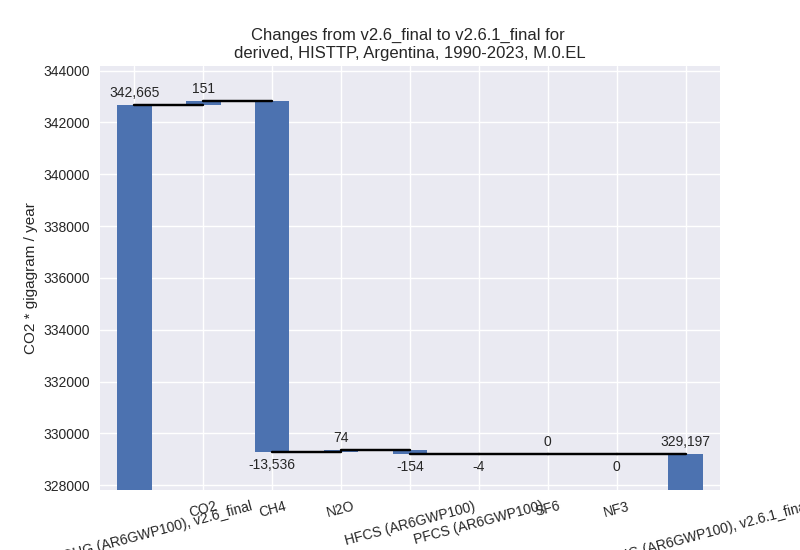
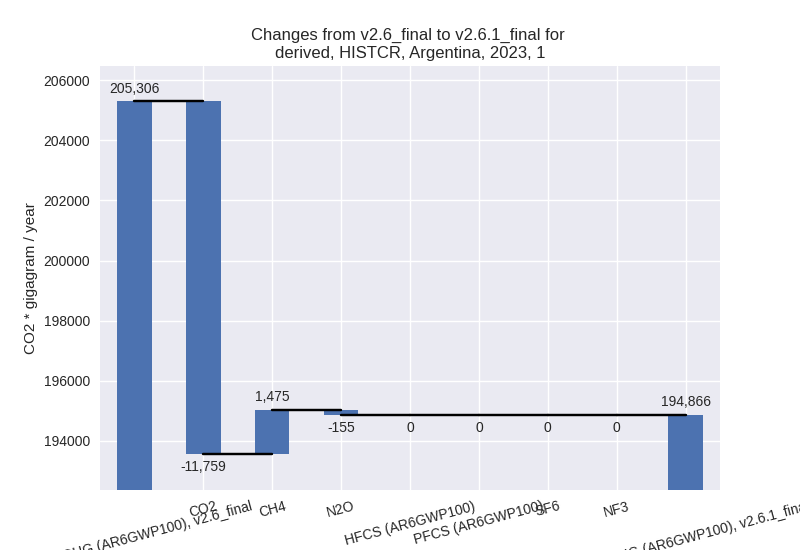
For each scenario and time frame the changes are displayed for all individual sectors and all individual gases. In the sector plot we use aggregate Kyoto GHGs in AR6GWP100. In the gas plot we usenational total emissions without LULUCF.
country reported scenario
2023
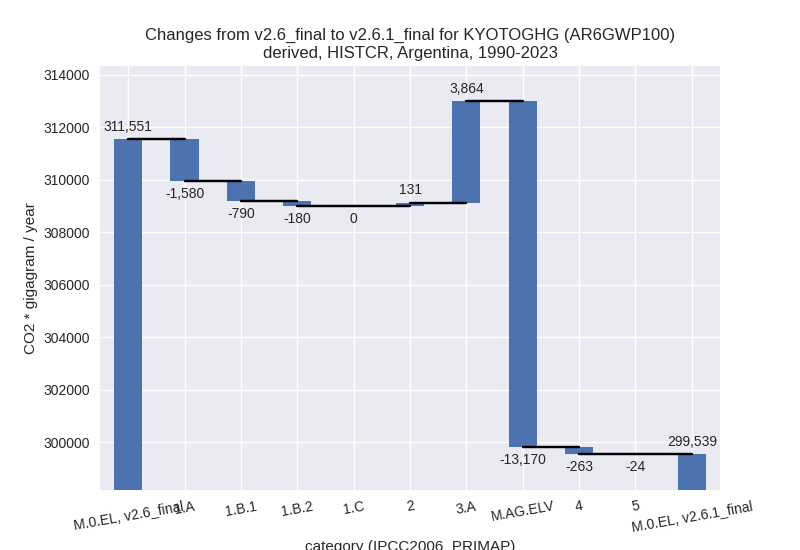
1990-2023
third party scenario
2023
1990-2023
Detailed changes for the scenarios:
country reported scenario (HISTCR):
Most important changes per time frame
For 2023 the following sector-gas combinations have the highest absolute impact on national total KyotoGHG (AR6GWP100) emissions in 2023 (top 5):
- 1: M.AG.ELV, N2O with -10925.73 Gg CO2 / year (-32.4%)
- 2: 1.A, CO2 with -9913.50 Gg CO2 / year (-5.6%)
- 3: 3.A, CH4 with 4046.13 Gg CO2 / year (5.6%)
- 4: 2, CO2 with 1434.66 Gg CO2 / year (9.7%)
- 5: 1.B.2, CH4 with 1262.57 Gg CO2 / year (5.3%)
For 1990-2023 the following sector-gas combinations have the highest absolute impact on national total KyotoGHG (AR6GWP100) emissions in 1990-2023 (top 5):
- 1: M.AG.ELV, N2O with -12644.34 Gg CO2 / year (-42.2%)
- 2: 3.A, CH4 with 3897.76 Gg CO2 / year (5.1%)
- 3: 1.A, CO2 with -1564.32 Gg CO2 / year (-1.1%)
- 4: 1.B.1, CO2 with -797.73 Gg CO2 / year (-99.7%)
- 5: M.AG.ELV, CH4 with -499.14 Gg CO2 / year (-42.5%)
Changes in the main sectors for aggregate KyotoGHG (AR6GWP100) are
- 1: Total sectoral emissions in 2022 are 200313.49
Gg CO2 / year which is 56.9% of M.0.EL emissions. 2023 Emissions have
changed by -5.1% (-10439.46 Gg CO2 /
year). 1990-2023 Emissions have changed by -1.5% (-2549.89 Gg CO2 / year). For 2023
the changes per gas
are:
The changes come from the following subsectors:- 1.A: Total sectoral emissions in 2022 are 175297.52
Gg CO2 / year which is 87.5% of category 1 emissions. 2023 Emissions
have changed by -5.6% (-9958.51 Gg
CO2 / year). 1990-2023 Emissions have changed by -1.1% (-1580.28 Gg CO2 / year). For 2023
the changes per gas
are:

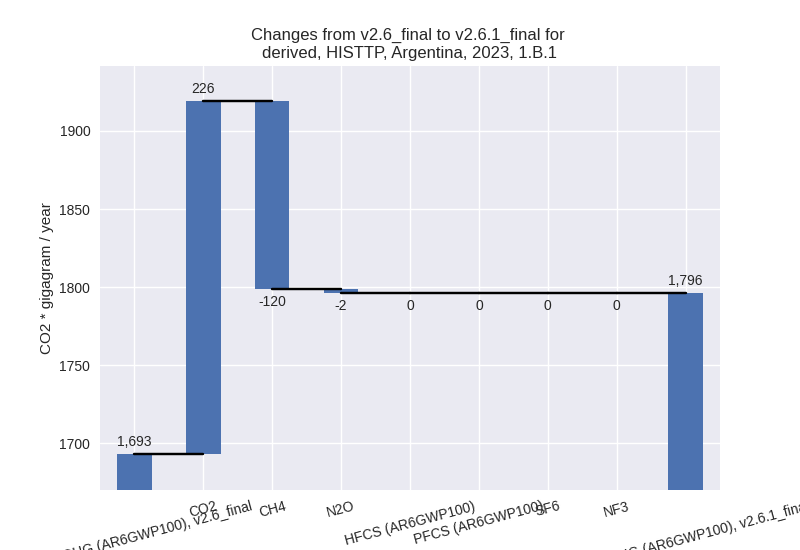
There is no subsector information available in PRIMAP-hist. - 1.B.1: Total sectoral emissions in 2022 are 407.77
Gg CO2 / year which is 0.2% of category 1 emissions. 2023 Emissions have
changed by -65.6% (-779.34 Gg CO2 /
year). 1990-2023 Emissions have changed by -61.3% (-789.97 Gg CO2 / year). For 2023
the changes per gas
are:

For 1990-2023 the changes per gas are: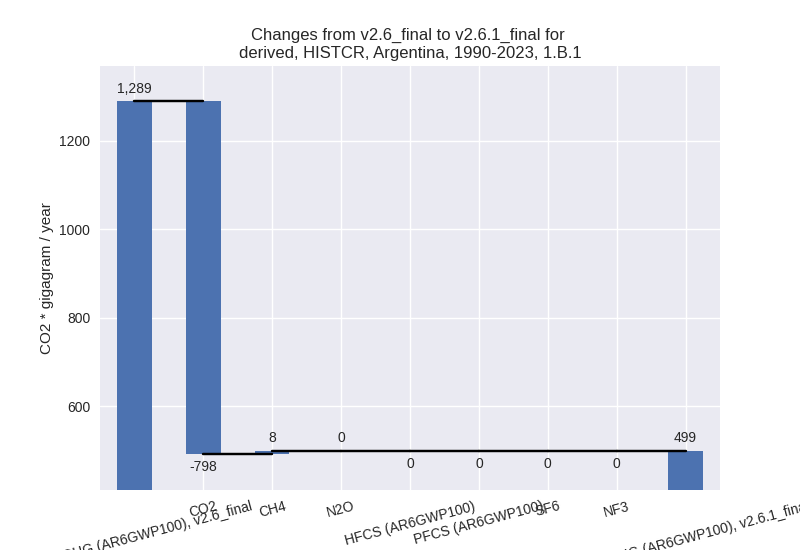
There is no subsector information available in PRIMAP-hist. - 1.B.2: Total sectoral emissions in 2022 are 24608.20 Gg CO2 / year which is 12.3% of category 1 emissions. 2023 Emissions have changed by 1.2% (298.39 Gg CO2 / year). 1990-2023 Emissions have changed by -0.8% (-179.64 Gg CO2 / year).
- 1.A: Total sectoral emissions in 2022 are 175297.52
Gg CO2 / year which is 87.5% of category 1 emissions. 2023 Emissions
have changed by -5.6% (-9958.51 Gg
CO2 / year). 1990-2023 Emissions have changed by -1.1% (-1580.28 Gg CO2 / year). For 2023
the changes per gas
are:
- 2: Total sectoral emissions in 2022 are 24863.04 Gg
CO2 / year which is 7.1% of M.0.EL emissions. 2023 Emissions have
changed by 7.5% (1745.38 Gg CO2 /
year). 1990-2023 Emissions have changed by 0.8% (130.75 Gg CO2 / year). For 2023 the
changes per gas
are:
- M.AG: Total sectoral emissions in 2022 are
102573.67 Gg CO2 / year which is 29.1% of M.0.EL emissions. 2023
Emissions have changed by -6.5%
(-7098.24 Gg CO2 / year). 1990-2023 Emissions have changed by -8.5% (-9306.42 Gg CO2 / year). For 2023
the changes per gas
are:
For 1990-2023 the changes per gas are: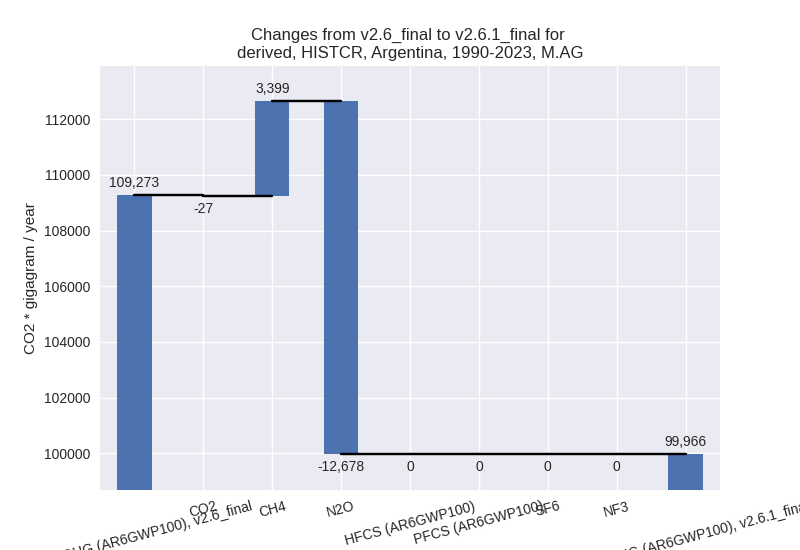
The changes come from the following subsectors:- 3.A: Total sectoral emissions in 2022 are 78211.42
Gg CO2 / year which is 76.2% of category M.AG emissions. 2023 Emissions
have changed by 5.5% (4007.58 Gg CO2
/ year). 1990-2023 Emissions have changed by 5.0% (3863.87 Gg CO2 / year). For 2023 the
changes per gas
are:
For 1990-2023 the changes per gas are: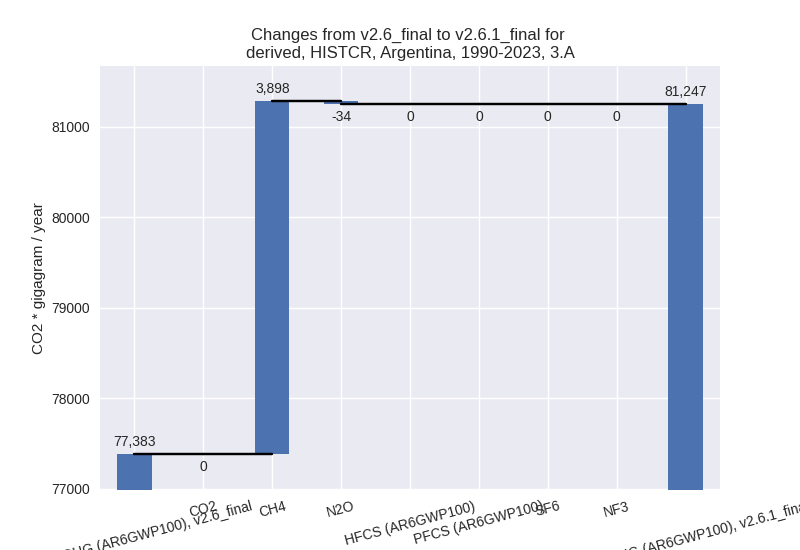
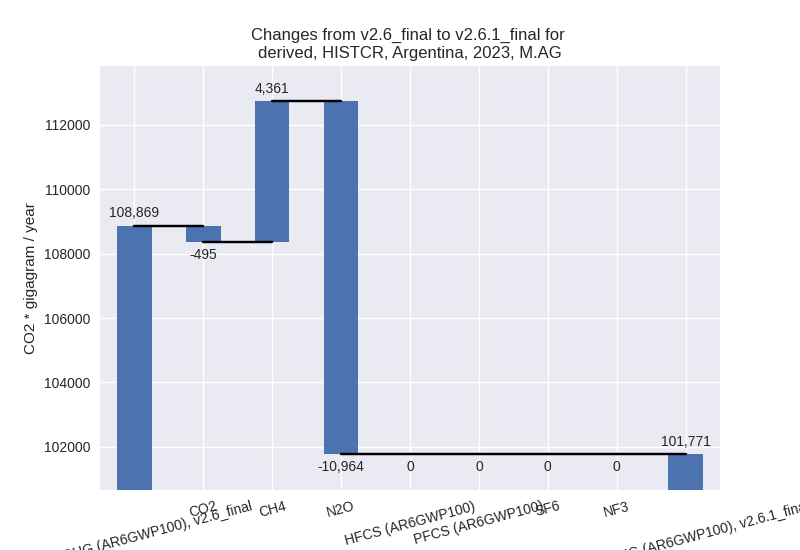
There is no subsector information available in PRIMAP-hist. - M.AG.ELV: Total sectoral emissions in 2022 are
24362.25 Gg CO2 / year which is 23.8% of category M.AG emissions. 2023
Emissions have changed by -30.5%
(-11105.82 Gg CO2 / year). 1990-2023 Emissions have changed by -41.3% (-13170.30 Gg CO2 / year). For 2023
the changes per gas
are:
For 1990-2023 the changes per gas are: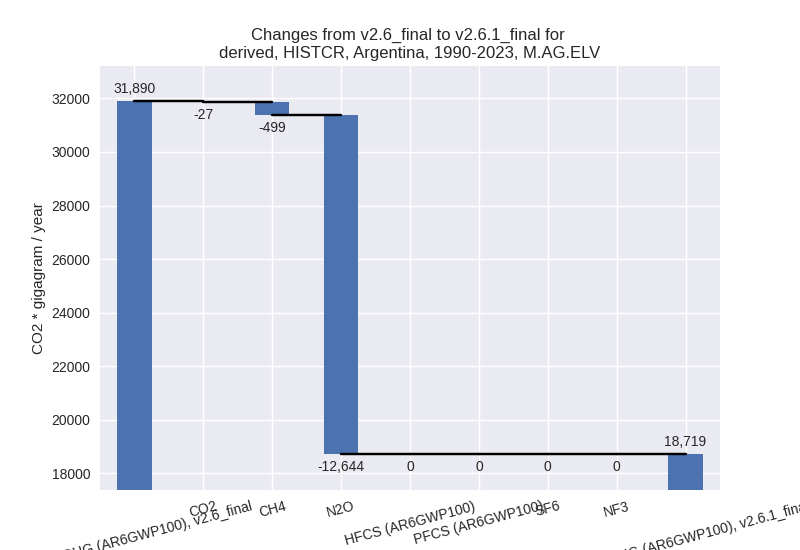
There is no subsector information available in PRIMAP-hist.
- 3.A: Total sectoral emissions in 2022 are 78211.42
Gg CO2 / year which is 76.2% of category M.AG emissions. 2023 Emissions
have changed by 5.5% (4007.58 Gg CO2
/ year). 1990-2023 Emissions have changed by 5.0% (3863.87 Gg CO2 / year). For 2023 the
changes per gas
are:
- 4: Total sectoral emissions in 2022 are 23263.09 Gg CO2 / year which is 6.6% of M.0.EL emissions. 2023 Emissions have changed by 0.7% (152.14 Gg CO2 / year). 1990-2023 Emissions have changed by -1.5% (-262.75 Gg CO2 / year).
- 5: Total sectoral emissions in 2022 are 1230.68 Gg
CO2 / year which is 0.3% of M.0.EL emissions. 2023 Emissions have
changed by -25.7% (-322.46 Gg CO2 /
year). 1990-2023 Emissions have changed by -2.3% (-23.56 Gg CO2 / year). For 2023 the
changes per gas
are:

For 1990-2023 the changes per gas are:
third party scenario (HISTTP):
Most important changes per time frame
For 2023 the following sector-gas combinations have the highest absolute impact on national total KyotoGHG (AR6GWP100) emissions in 2023 (top 5):
- 1: 1.B.2, CH4 with -9098.15 Gg CO2 / year (-46.4%)
- 2: 4, CH4 with -5679.44 Gg CO2 / year (-36.0%)
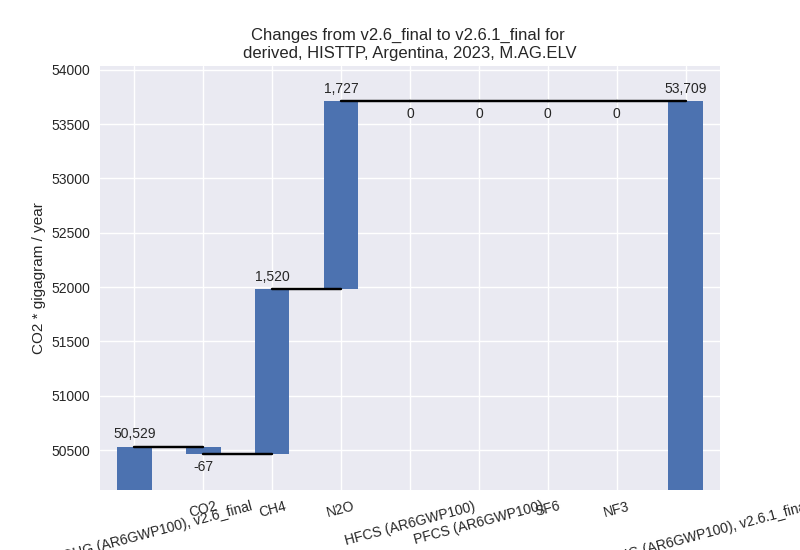
- 3: M.AG.ELV, N2O with 1726.97 Gg CO2 / year (3.8%)
- 4: M.AG.ELV, CH4 with 1519.97 Gg CO2 / year (50.5%)
- 5: 2, CO2 with 969.34 Gg CO2 / year (11.9%)
For 1990-2023 the following sector-gas combinations have the highest absolute impact on national total KyotoGHG (AR6GWP100) emissions in 1990-2023 (top 5):
- 1: 1.B.2, CH4 with -8541.37 Gg CO2 / year (-45.9%)
- 2: 4, CH4 with -5183.94 Gg CO2 / year (-32.1%)
- 3: 2, HFCS (AR6GWP100) with -153.85 Gg CO2 / year (-2.4%)
- 4: 2, CO2 with 143.68 Gg CO2 / year (2.1%)
- 5: M.AG.ELV, N2O with 91.35 Gg CO2 / year (0.3%)
Changes in the main sectors for aggregate KyotoGHG (AR6GWP100) are
- 1: Total sectoral emissions in 2022 are 214308.76
Gg CO2 / year which is 54.0% of M.0.EL emissions. 2023 Emissions have
changed by -4.2% (-9058.26 Gg CO2 /
year). 1990-2023 Emissions have changed by -4.7% (-8498.21 Gg CO2 / year). For 2023
the changes per gas
are:

For 1990-2023 the changes per gas are:
The changes come from the following subsectors:- 1.A: Total sectoral emissions in 2022 are 200033.91 Gg CO2 / year which is 93.3% of category 1 emissions. 2023 Emissions have changed by -0.0% (-62.77 Gg CO2 / year). 1990-2023 Emissions have changed by 0.0% (11.83 Gg CO2 / year).
- 1.B.1: Total sectoral emissions in 2022 are 1760.32
Gg CO2 / year which is 0.8% of category 1 emissions. 2023 Emissions have
changed by 6.1% (103.23 Gg CO2 /
year). 1990-2023 Emissions have changed by 1.9% (30.04 Gg CO2 / year). For 2023 the
changes per gas
are:
There is no subsector information available in PRIMAP-hist. - 1.B.2: Total sectoral emissions in 2022 are
12514.53 Gg CO2 / year which is 5.8% of category 1 emissions. 2023
Emissions have changed by -41.4%
(-9098.71 Gg CO2 / year). 1990-2023 Emissions have changed by -40.6% (-8540.08 Gg CO2 / year). For 2023
the changes per gas
are:

For 1990-2023 the changes per gas are: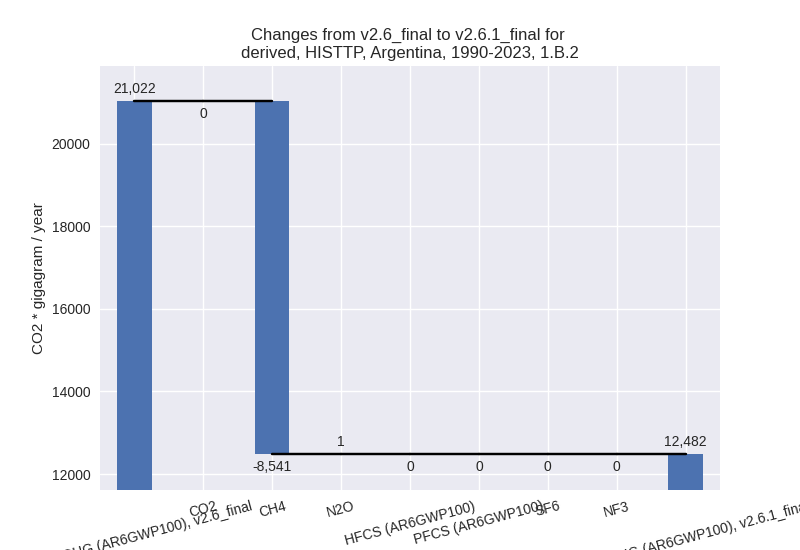
There is no subsector information available in PRIMAP-hist.
- 2: Total sectoral emissions in 2022 are 27124.28 Gg
CO2 / year which is 6.8% of M.0.EL emissions. 2023 Emissions have
changed by 3.0% (815.94 Gg CO2 /
year). 1990-2023 Emissions have changed by -0.1% (-13.37 Gg CO2 / year). For 2023 the
changes per gas
are:
- M.AG: Total sectoral emissions in 2022 are
143091.46 Gg CO2 / year which is 36.1% of M.0.EL emissions. 2023
Emissions have changed by 2.9%
(3987.68 Gg CO2 / year). 1990-2023 Emissions have changed by 0.2% (245.37 Gg CO2 / year). For 2023 the
changes per gas
are:
The changes come from the following subsectors:- 3.A: Total sectoral emissions in 2022 are 91658.97 Gg CO2 / year which is 64.1% of category M.AG emissions. 2023 Emissions have changed by 0.9% (807.94 Gg CO2 / year). 1990-2023 Emissions have changed by 0.1% (88.29 Gg CO2 / year).
- M.AG.ELV: Total sectoral emissions in 2022 are
51432.50 Gg CO2 / year which is 35.9% of category M.AG emissions. 2023
Emissions have changed by 6.3%
(3179.74 Gg CO2 / year). 1990-2023 Emissions have changed by 0.4% (157.08 Gg CO2 / year). For 2023 the
changes per gas
are:
There is no subsector information available in PRIMAP-hist.
- 4: Total sectoral emissions in 2022 are 10953.46 Gg
CO2 / year which is 2.8% of M.0.EL emissions. 2023 Emissions have
changed by -33.8% (-5630.52 Gg CO2 /
year). 1990-2023 Emissions have changed by -30.7% (-5178.15 Gg CO2 / year). For 2023
the changes per gas
are:

For 1990-2023 the changes per gas are:
- 5: Total sectoral emissions in 2022 are 1230.68 Gg
CO2 / year which is 0.3% of M.0.EL emissions. 2023 Emissions have
changed by -25.7% (-322.46 Gg CO2 /
year). 1990-2023 Emissions have changed by -2.3% (-23.56 Gg CO2 / year). For 2023 the
changes per gas
are:

For 1990-2023 the changes per gas are: