Changes in PRIMAP-hist v2.6.1_final compared to v2.6_final for Australia
2025-03-19
Johannes Gütschow
Change analysis for Australia for PRIMAP-hist v2.6.1_final compared to v2.6_final
Overview over emissions by sector and gas
The following figures show the aggregate national total emissions excluding LULUCF AR6GWP100 for the country reported priority scenario. The dotted linesshow the v2.6_final data.
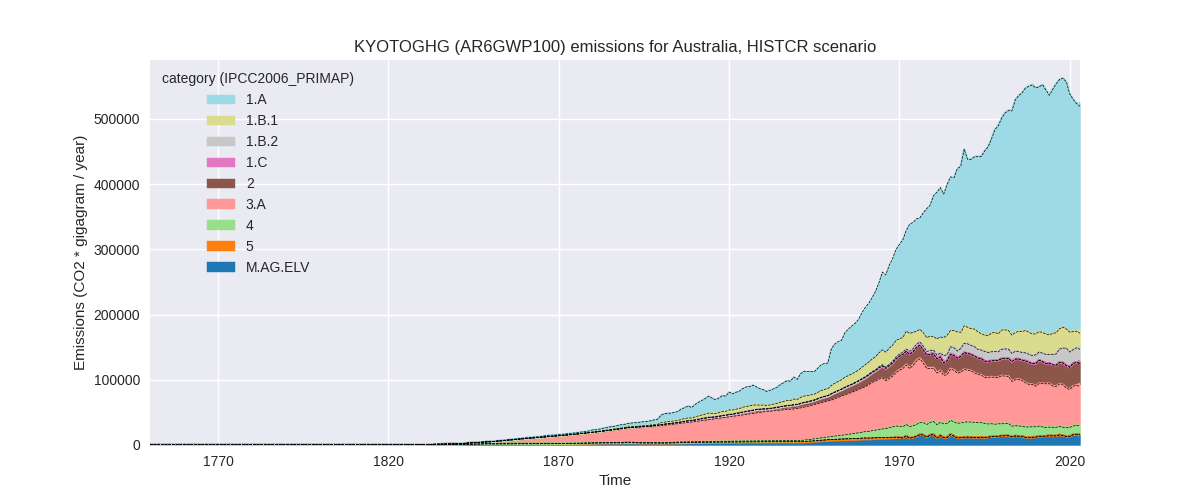
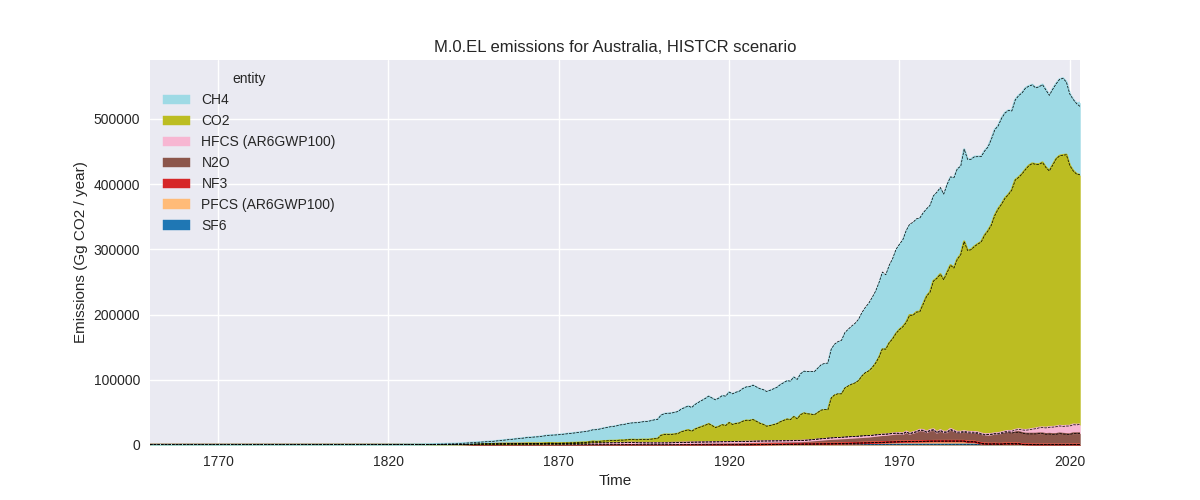
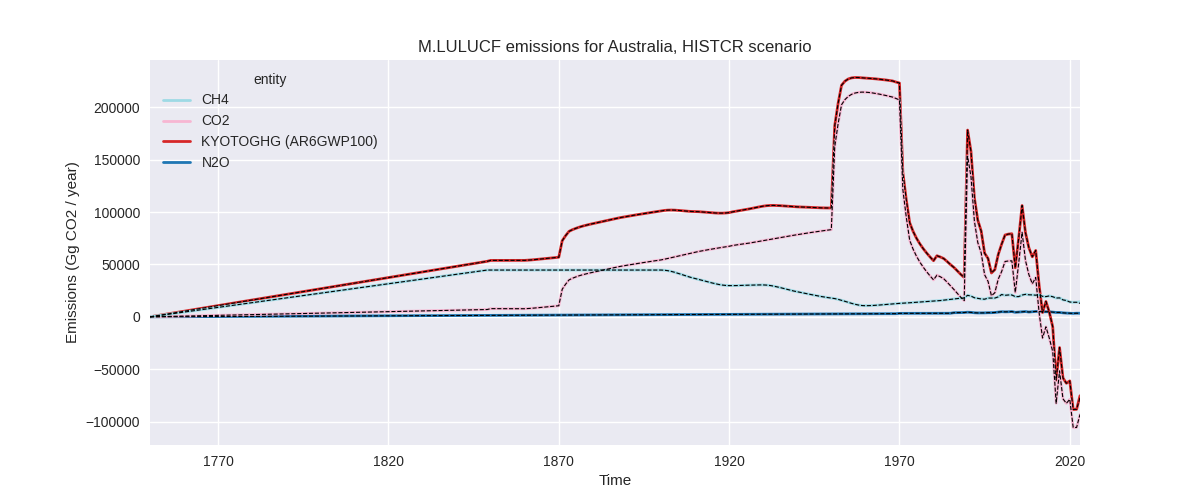
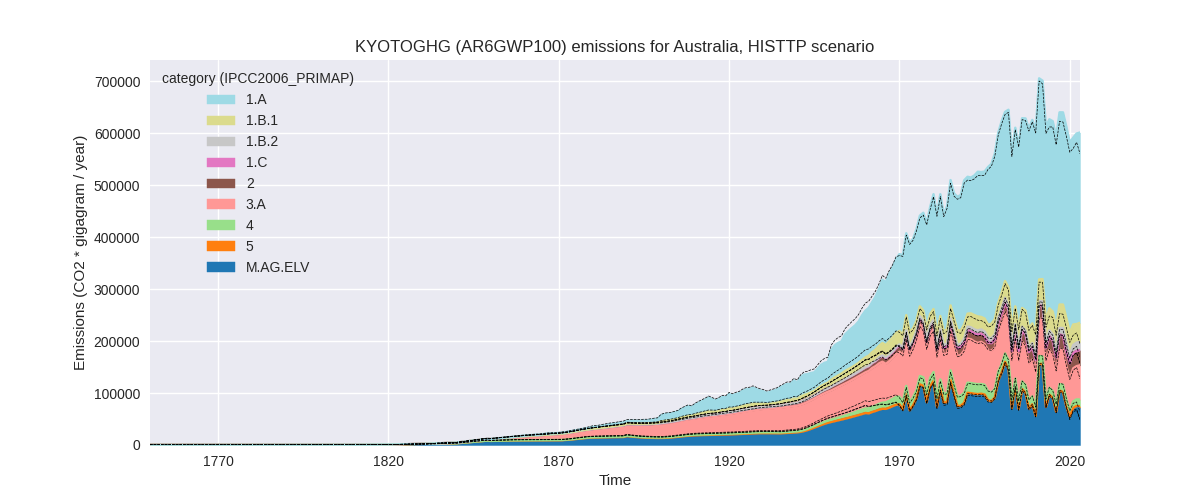
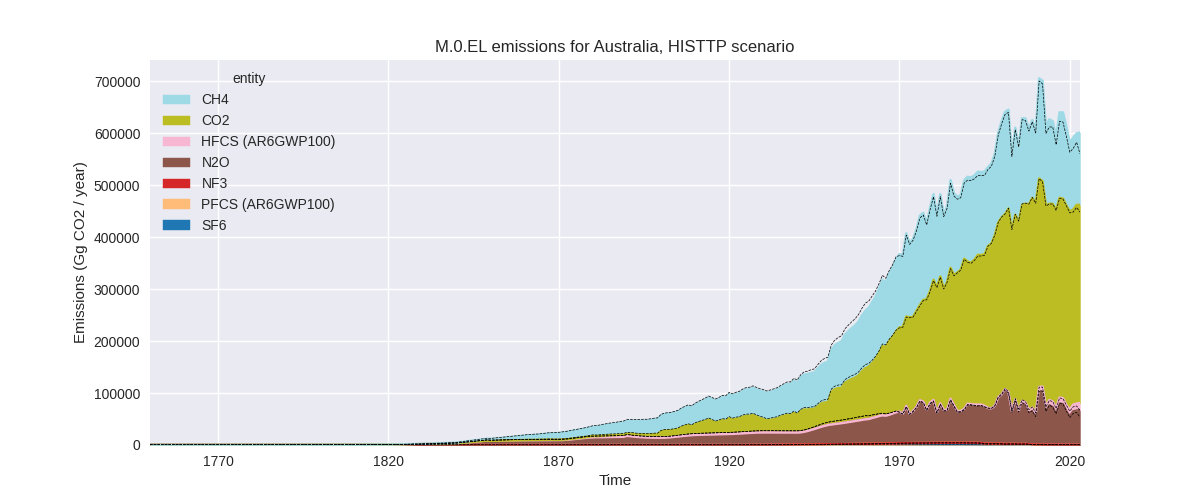
The following figures show the aggregate national total emissions excluding LULUCF AR6GWP100 for the third party priority scenario. The dotted linesshow the v2.6_final data.
Overview over changes
In the country reported priority scenario we have the following changes for aggregate Kyoto GHG and national total emissions excluding LULUCF (M.0.EL):
- Emissions in 2023 have changed by 1.0%% (5390.78 Gg CO2 / year)
- Emissions in 1990-2023 have changed by 0.0%% (158.55 Gg CO2 / year)
In the third party priority scenario we have the following changes for aggregate Kyoto GHG and national total emissions excluding LULUCF (M.0.EL):
- Emissions in 2023 have changed by 7.3%% (40956.57 Gg CO2 / year)
- Emissions in 1990-2023 have changed by 1.6%% (9374.59 Gg CO2 / year)
Most important changes per scenario and time frame
In the country reported priority scenario the following sector-gas combinations have the highest absolute impact on national total KyotoGHG (AR6GWP100) emissions in 2023 (top 5):
- 1: 3.A, CH4 with 4141.04 Gg CO2 / year (7.0%)
- 2: 1.B.1, CH4 with 1812.62 Gg CO2 / year (8.0%)
- 3: 2, HFCS (AR6GWP100) with -378.25 Gg CO2 / year (-2.7%)
- 4: 4, CH4 with -237.25 Gg CO2 / year (-1.7%)
- 5: 1.A, CH4 with 201.40 Gg CO2 / year (10.3%)
In the country reported priority scenario the following sector-gas combinations have the highest absolute impact on national total KyotoGHG (AR6GWP100) emissions in 1990-2023 (top 5):
- 1: 3.A, CH4 with 121.80 Gg CO2 / year (0.2%)
- 2: 1.B.1, CH4 with 53.31 Gg CO2 / year (0.2%)
- 3: 2, HFCS (AR6GWP100) with -11.12 Gg CO2 / year (-0.2%)
- 4: 4, CH4 with -6.98 Gg CO2 / year (-0.0%)
- 5: 1.A, CH4 with 5.92 Gg CO2 / year (0.2%)
In the third party priority scenario the following sector-gas combinations have the highest absolute impact on national total KyotoGHG (AR6GWP100) emissions in 2023 (top 5):
- 1: M.AG.ELV, N2O with 13298.29 Gg CO2 / year (33.2%)
- 2: 1.B.1, CH4 with 12115.45 Gg CO2 / year (59.7%)
- 3: M.AG.ELV, CH4 with 9818.45 Gg CO2 / year (178.2%)
- 4: 1.B.2, CH4 with 3194.17 Gg CO2 / year (28.6%)
- 5: 3.A, CH4 with 2222.43 Gg CO2 / year (3.6%)
In the third party priority scenario the following sector-gas combinations have the highest absolute impact on national total KyotoGHG (AR6GWP100) emissions in 1990-2023 (top 5):
- 1: 1.B.1, CH4 with 6704.26 Gg CO2 / year (26.1%)
- 2: 1.B.2, CH4 with 1869.97 Gg CO2 / year (24.7%)
- 3: M.AG.ELV, N2O with 833.54 Gg CO2 / year (1.3%)
- 4: 4, CH4 with -575.12 Gg CO2 / year (-3.8%)
- 5: M.AG.ELV, CH4 with 479.91 Gg CO2 / year (1.7%)
Notes on data changes
Here we list notes explaining important emissions changes for the country.
- Country reported data has not been updated as Australia had already submitted CRT files in time for PRIMAP-hist v2.6. Changes for 2023 come from the inclusion of EDGAR 2024 which provides values for 2023.
- In the TP scenario agricultural data and fugitive emissions data
have changed.
- M.AG.ELV is much higher for 2023 as the new FAO and EDGAR data deviates from the trend of the previous FAO data.
- Fugitive CH4 (1.B.1 and 1.B.2) is much higher in the new EDGAR data leading to higher 2023 and cumulative emissions in PRIMAP-hist v2.6.1
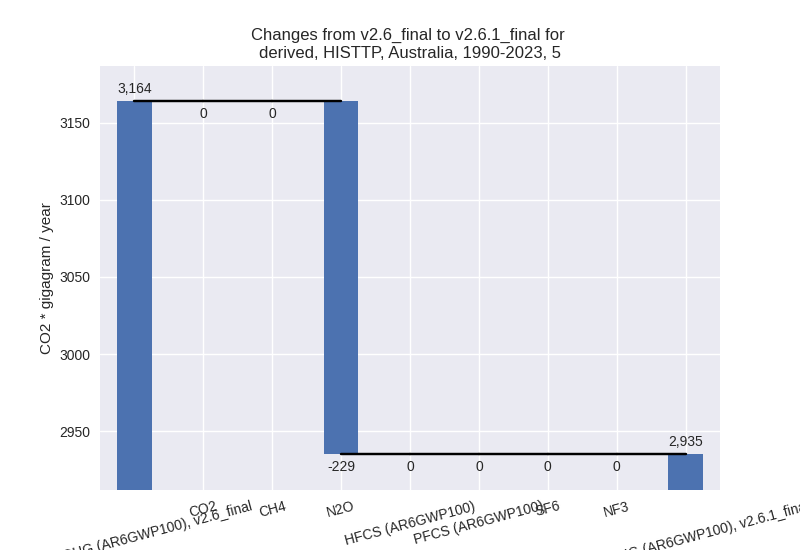
Changes by sector and gas
For each scenario and time frame the changes are displayed for all individual sectors and all individual gases. In the sector plot we use aggregate Kyoto GHGs in AR6GWP100. In the gas plot we usenational total emissions without LULUCF.
country reported scenario
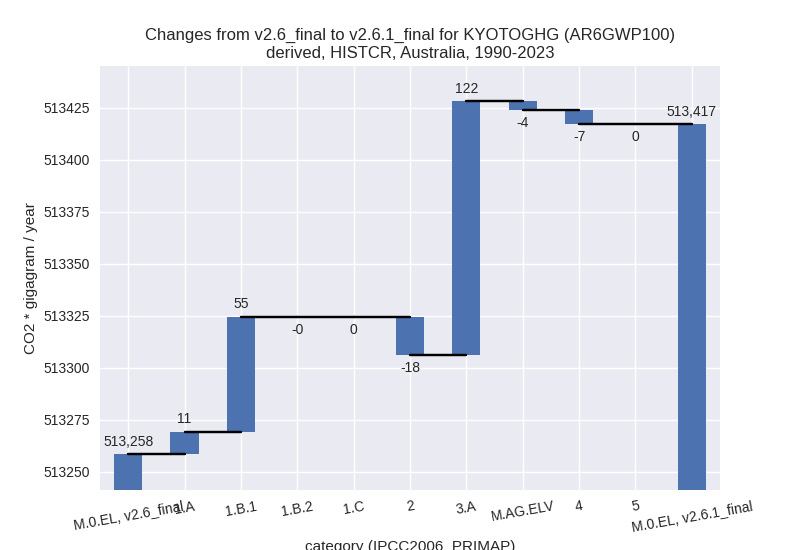
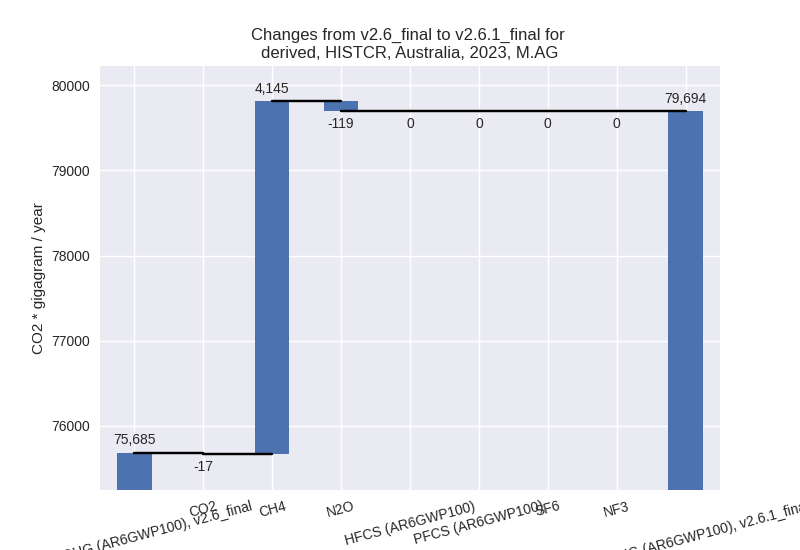
2023
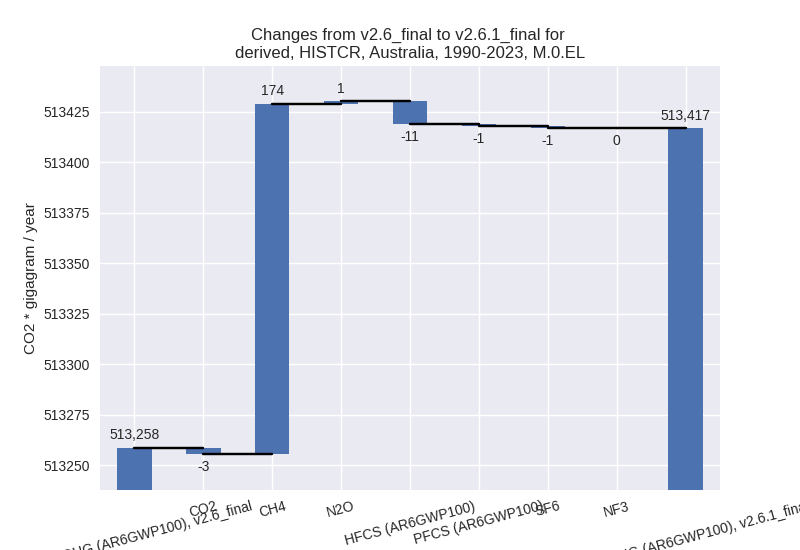
1990-2023
third party scenario
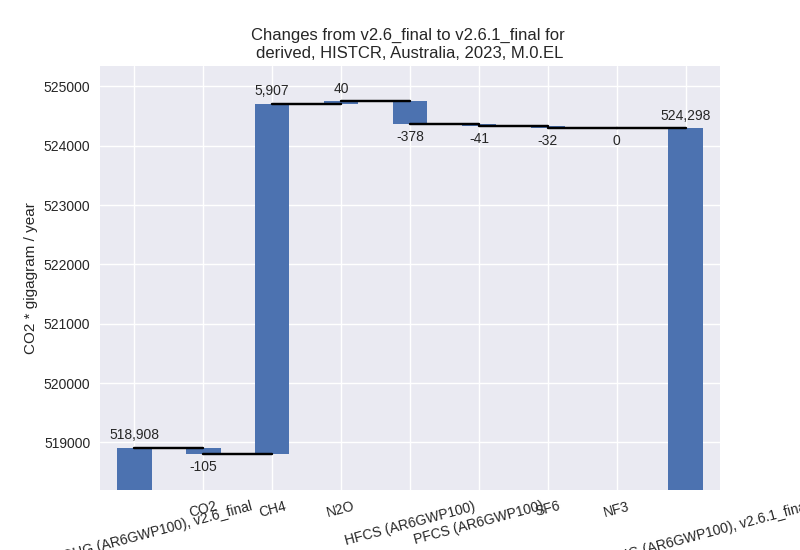
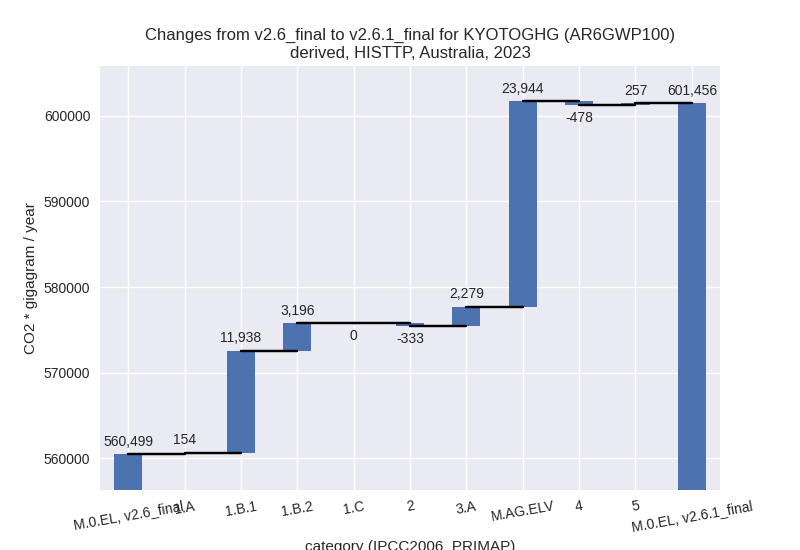
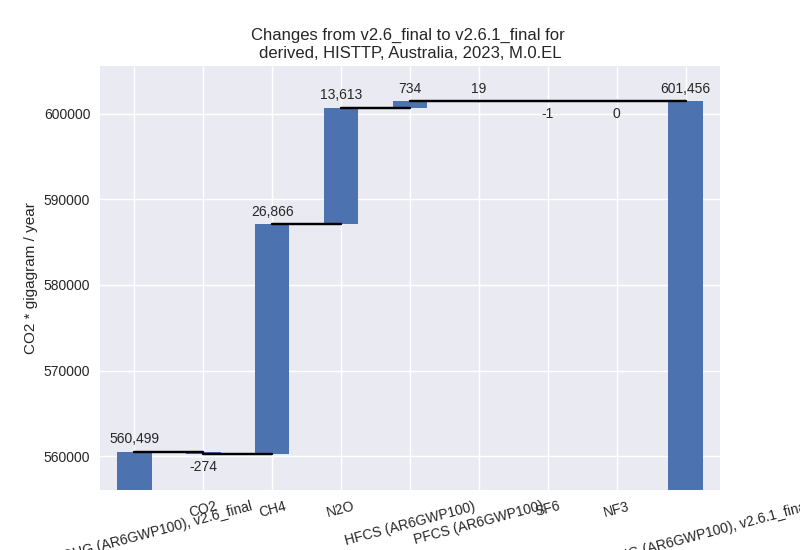
2023
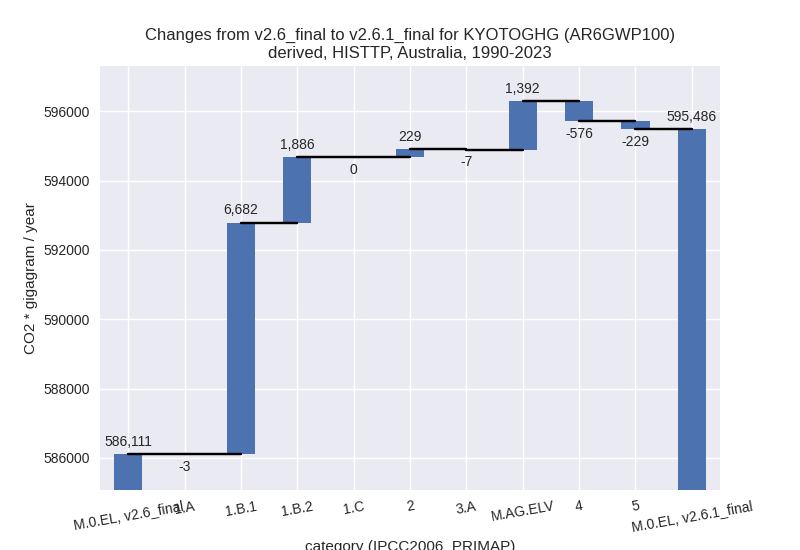
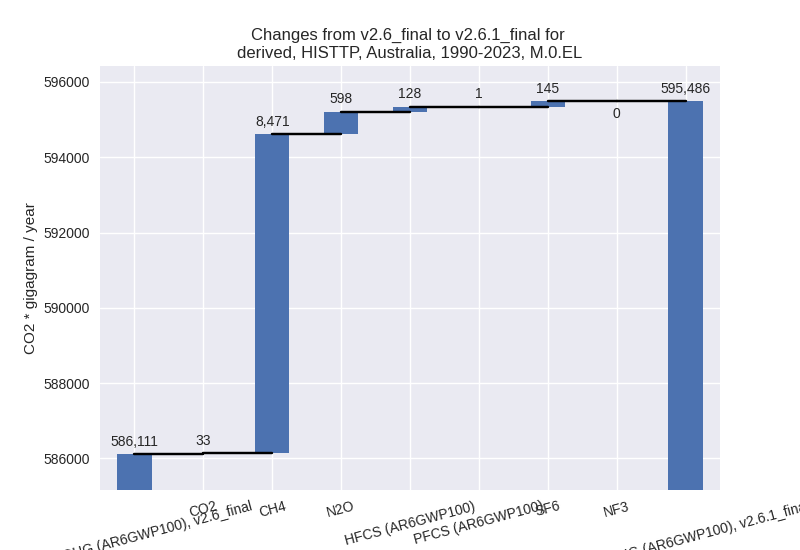
1990-2023
Detailed changes for the scenarios:
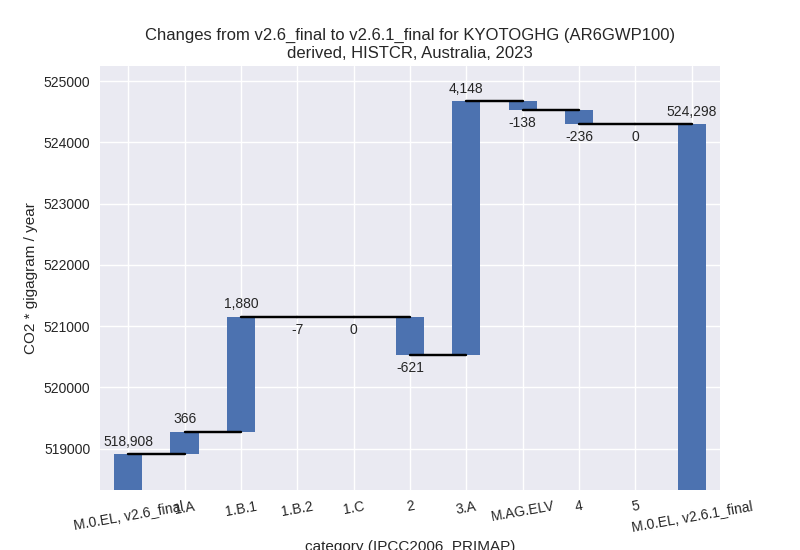
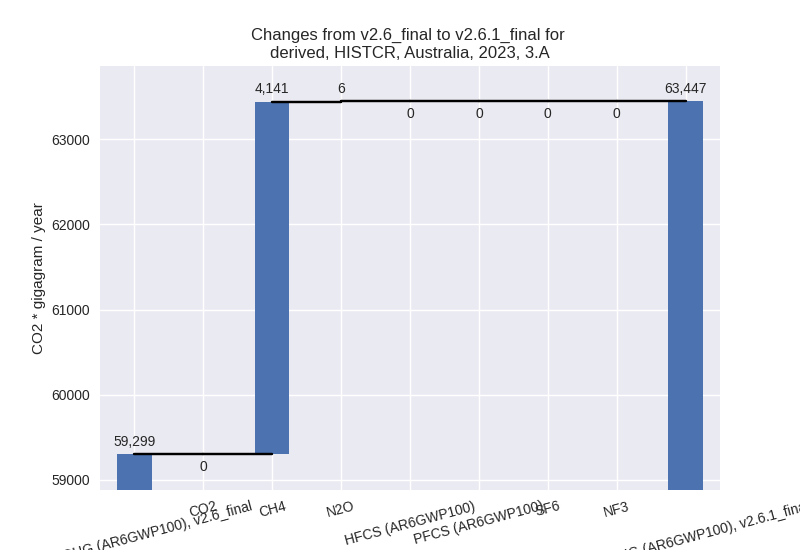
country reported scenario (HISTCR):
Most important changes per time frame
For 2023 the following sector-gas combinations have the highest absolute impact on national total KyotoGHG (AR6GWP100) emissions in 2023 (top 5):
- 1: 3.A, CH4 with 4141.04 Gg CO2 / year (7.0%)
- 2: 1.B.1, CH4 with 1812.62 Gg CO2 / year (8.0%)
- 3: 2, HFCS (AR6GWP100) with -378.25 Gg CO2 / year (-2.7%)
- 4: 4, CH4 with -237.25 Gg CO2 / year (-1.7%)
- 5: 1.A, CH4 with 201.40 Gg CO2 / year (10.3%)
For 1990-2023 the following sector-gas combinations have the highest absolute impact on national total KyotoGHG (AR6GWP100) emissions in 1990-2023 (top 5):
- 1: 3.A, CH4 with 121.80 Gg CO2 / year (0.2%)
- 2: 1.B.1, CH4 with 53.31 Gg CO2 / year (0.2%)
- 3: 2, HFCS (AR6GWP100) with -11.12 Gg CO2 / year (-0.2%)
- 4: 4, CH4 with -6.98 Gg CO2 / year (-0.0%)
- 5: 1.A, CH4 with 5.92 Gg CO2 / year (0.2%)
Changes in the main sectors for aggregate KyotoGHG (AR6GWP100) are
- 1: Total sectoral emissions in 2022 are 396668.11 Gg CO2 / year which is 75.8% of M.0.EL emissions. 2023 Emissions have changed by 0.6% (2238.64 Gg CO2 / year). 1990-2023 Emissions have changed by 0.0% (65.84 Gg CO2 / year).
- 2: Total sectoral emissions in 2022 are 35083.64 Gg CO2 / year which is 6.7% of M.0.EL emissions. 2023 Emissions have changed by -1.8% (-621.14 Gg CO2 / year). 1990-2023 Emissions have changed by -0.1% (-18.27 Gg CO2 / year).
- M.AG: Total sectoral emissions in 2022 are 77604.37
Gg CO2 / year which is 14.8% of M.0.EL emissions. 2023 Emissions have
changed by 5.3% (4009.02 Gg CO2 /
year). 1990-2023 Emissions have changed by 0.1% (117.91 Gg CO2 / year). For 2023 the
changes per gas
are:
The changes come from the following subsectors:- 3.A: Total sectoral emissions in 2022 are 61477.08
Gg CO2 / year which is 79.2% of category M.AG emissions. 2023 Emissions
have changed by 7.0% (4147.51 Gg CO2
/ year). 1990-2023 Emissions have changed by 0.2% (121.99 Gg CO2 / year). For 2023 the
changes per gas
are:
There is no subsector information available in PRIMAP-hist. - M.AG.ELV: Total sectoral emissions in 2022 are 16127.29 Gg CO2 / year which is 20.8% of category M.AG emissions. 2023 Emissions have changed by -0.8% (-138.49 Gg CO2 / year). 1990-2023 Emissions have changed by -0.0% (-4.07 Gg CO2 / year).
- 3.A: Total sectoral emissions in 2022 are 61477.08
Gg CO2 / year which is 79.2% of category M.AG emissions. 2023 Emissions
have changed by 7.0% (4147.51 Gg CO2
/ year). 1990-2023 Emissions have changed by 0.2% (121.99 Gg CO2 / year). For 2023 the
changes per gas
are:
- 4: Total sectoral emissions in 2022 are 13827.54 Gg CO2 / year which is 2.6% of M.0.EL emissions. 2023 Emissions have changed by -1.7% (-235.73 Gg CO2 / year). 1990-2023 Emissions have changed by -0.0% (-6.93 Gg CO2 / year).
- 5: No data
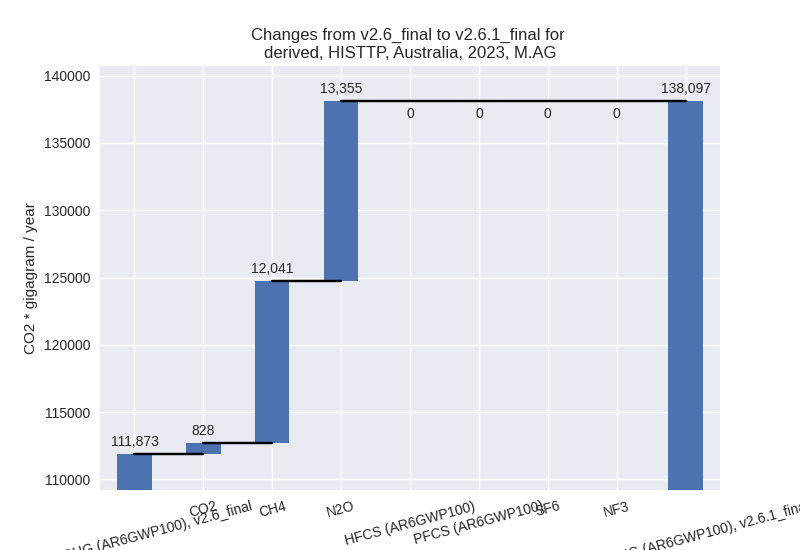
third party scenario (HISTTP):
Most important changes per time frame
For 2023 the following sector-gas combinations have the highest absolute impact on national total KyotoGHG (AR6GWP100) emissions in 2023 (top 5):
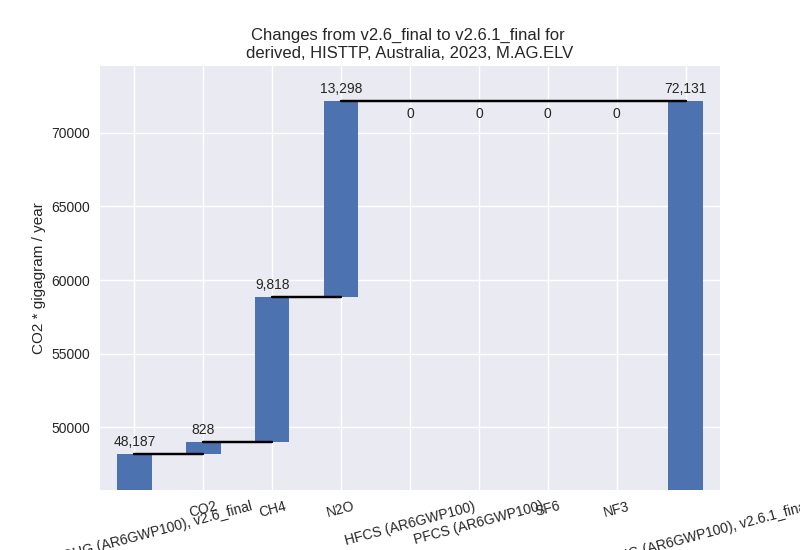
- 1: M.AG.ELV, N2O with 13298.29 Gg CO2 / year (33.2%)
- 2: 1.B.1, CH4 with 12115.45 Gg CO2 / year (59.7%)
- 3: M.AG.ELV, CH4 with 9818.45 Gg CO2 / year (178.2%)
- 4: 1.B.2, CH4 with 3194.17 Gg CO2 / year (28.6%)
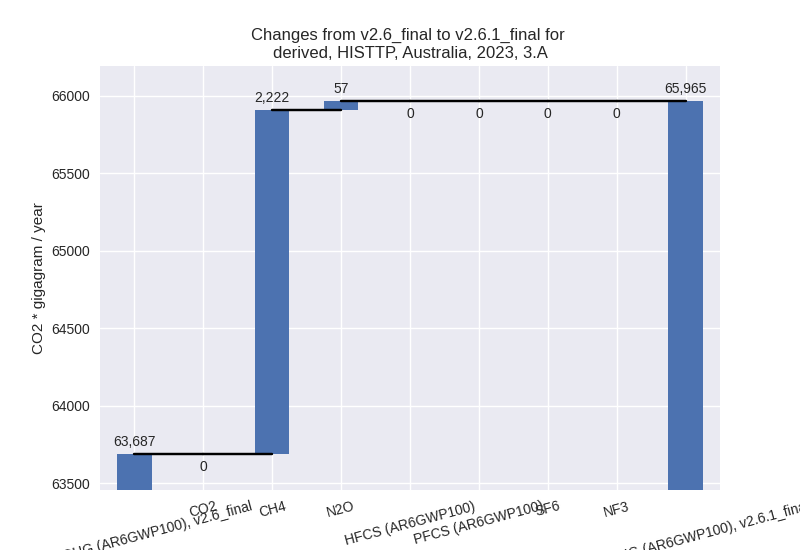
- 5: 3.A, CH4 with 2222.43 Gg CO2 / year (3.6%)
For 1990-2023 the following sector-gas combinations have the highest absolute impact on national total KyotoGHG (AR6GWP100) emissions in 1990-2023 (top 5):
- 1: 1.B.1, CH4 with 6704.26 Gg CO2 / year (26.1%)
- 2: 1.B.2, CH4 with 1869.97 Gg CO2 / year (24.7%)
- 3: M.AG.ELV, N2O with 833.54 Gg CO2 / year (1.3%)
- 4: 4, CH4 with -575.12 Gg CO2 / year (-3.8%)
- 5: M.AG.ELV, CH4 with 479.91 Gg CO2 / year (1.7%)
Changes in the main sectors for aggregate KyotoGHG (AR6GWP100) are
- 1: Total sectoral emissions in 2022 are 418434.17
Gg CO2 / year which is 69.8% of M.0.EL emissions. 2023 Emissions have
changed by 3.8% (15288.27 Gg CO2 /
year). 1990-2023 Emissions have changed by 2.3% (8565.05 Gg CO2 / year). For 2023 the
changes per gas
are:

For 1990-2023 the changes per gas are:
The changes come from the following subsectors:- 1.A: Total sectoral emissions in 2022 are 366842.16 Gg CO2 / year which is 87.7% of category 1 emissions. 2023 Emissions have changed by 0.0% (154.38 Gg CO2 / year). 1990-2023 Emissions have changed by -0.0% (-3.43 Gg CO2 / year).
- 1.B.1: Total sectoral emissions in 2022 are
35601.12 Gg CO2 / year which is 8.5% of category 1 emissions. 2023
Emissions have changed by 47.9%
(11938.35 Gg CO2 / year). 1990-2023 Emissions have changed by 23.2% (6682.28 Gg CO2 / year). For 2023
the changes per gas
are:

For 1990-2023 the changes per gas are:
There is no subsector information available in PRIMAP-hist. - 1.B.2: Total sectoral emissions in 2022 are
15990.55 Gg CO2 / year which is 3.8% of category 1 emissions. 2023
Emissions have changed by 25.6%
(3195.55 Gg CO2 / year). 1990-2023 Emissions have changed by 22.2% (1886.20 Gg CO2 / year). For 2023
the changes per gas
are:

For 1990-2023 the changes per gas are:
There is no subsector information available in PRIMAP-hist. - 1.C: Total sectoral emissions in 2022 are 0.34 Gg CO2 / year which is 0.0% of category 1 emissions. 2023 Emissions have changed by 0.0% (0.00 Gg CO2 / year). 1990-2023 Emissions have changed by 0.0% (0.00 Gg CO2 / year).
- 2: Total sectoral emissions in 2022 are 29319.20 Gg CO2 / year which is 4.9% of M.0.EL emissions. 2023 Emissions have changed by -1.1% (-333.35 Gg CO2 / year). 1990-2023 Emissions have changed by 1.1% (229.28 Gg CO2 / year).
- M.AG: Total sectoral emissions in 2022 are
136839.89 Gg CO2 / year which is 22.8% of M.0.EL emissions. 2023
Emissions have changed by 23.4%
(26223.22 Gg CO2 / year). 1990-2023 Emissions have changed by 0.8% (1384.94 Gg CO2 / year). For 2023 the
changes per gas
are:
The changes come from the following subsectors:- 3.A: Total sectoral emissions in 2022 are 63927.78
Gg CO2 / year which is 46.7% of category M.AG emissions. 2023 Emissions
have changed by 3.6% (2278.93 Gg CO2
/ year). 1990-2023 Emissions have changed by -0.0% (-6.93 Gg CO2 / year). For 2023 the
changes per gas
are:
There is no subsector information available in PRIMAP-hist. - M.AG.ELV: Total sectoral emissions in 2022 are
72912.11 Gg CO2 / year which is 53.3% of category M.AG emissions. 2023
Emissions have changed by 49.7%
(23944.28 Gg CO2 / year). 1990-2023 Emissions have changed by 1.5% (1391.87 Gg CO2 / year). For 2023 the
changes per gas
are:
There is no subsector information available in PRIMAP-hist.
- 3.A: Total sectoral emissions in 2022 are 63927.78
Gg CO2 / year which is 46.7% of category M.AG emissions. 2023 Emissions
have changed by 3.6% (2278.93 Gg CO2
/ year). 1990-2023 Emissions have changed by -0.0% (-6.93 Gg CO2 / year). For 2023 the
changes per gas
are:
- 4: Total sectoral emissions in 2022 are 12702.63 Gg
CO2 / year which is 2.1% of M.0.EL emissions. 2023 Emissions have
changed by -3.6% (-478.29 Gg CO2 /
year). 1990-2023 Emissions have changed by -3.6% (-575.99 Gg CO2 / year). For 2023
the changes per gas
are:
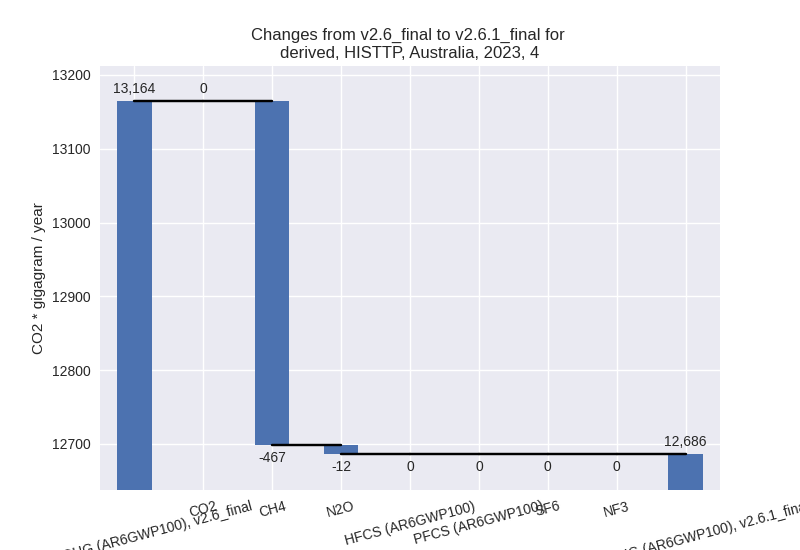
For 1990-2023 the changes per gas are: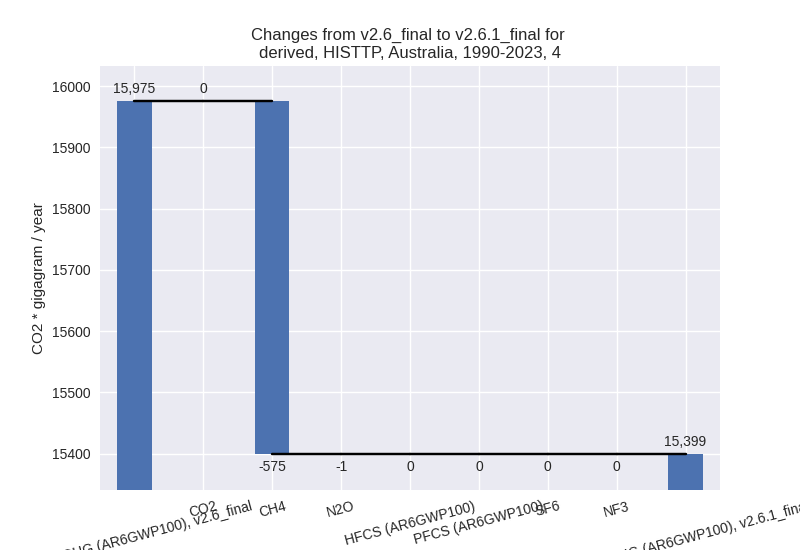
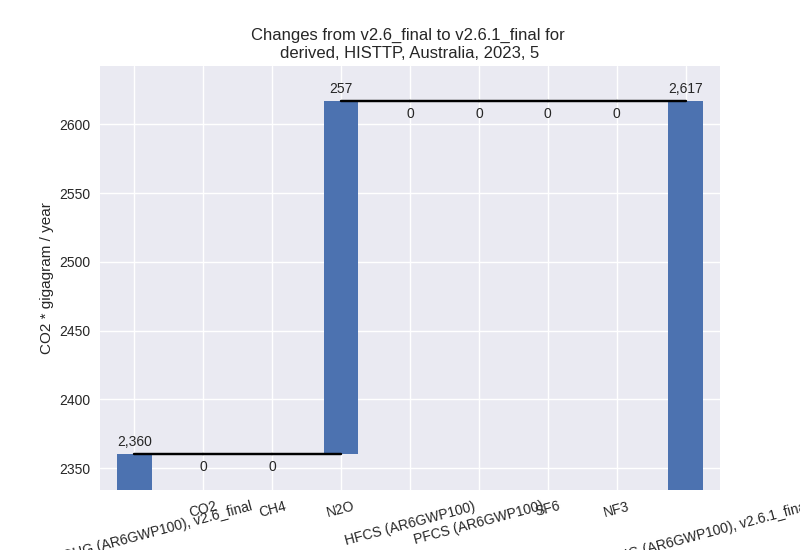
- 5: Total sectoral emissions in 2022 are 2231.24 Gg
CO2 / year which is 0.4% of M.0.EL emissions. 2023 Emissions have
changed by 10.9% (256.73 Gg CO2 /
year). 1990-2023 Emissions have changed by -7.2% (-228.69 Gg CO2 / year). For 2023
the changes per gas
are:
For 1990-2023 the changes per gas are: