Changes in PRIMAP-hist v2.6.1_final compared to v2.6_final for Austria
2025-03-19
Johannes Gütschow
Change analysis for Austria for PRIMAP-hist v2.6.1_final compared to v2.6_final
Overview over emissions by sector and gas
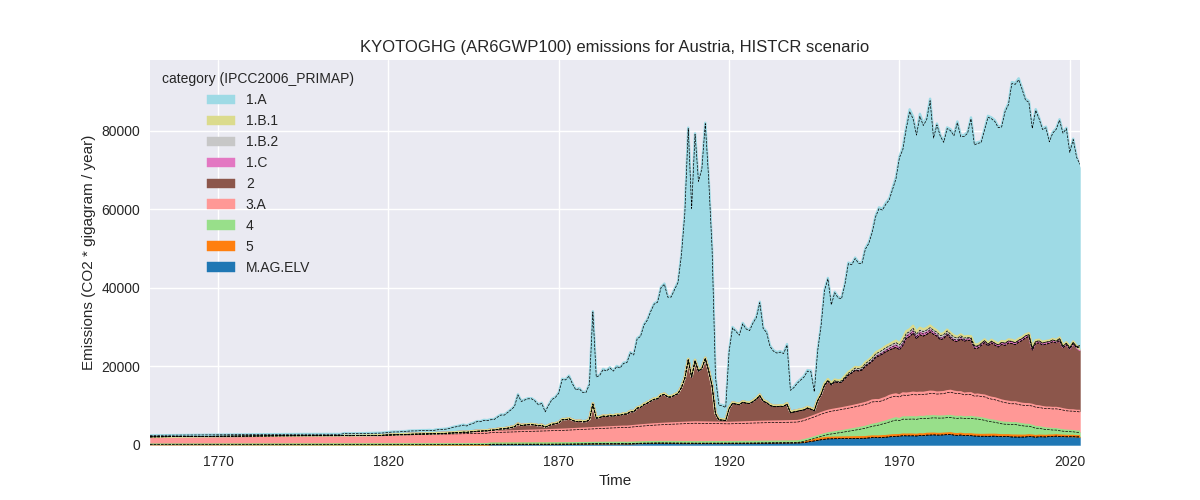
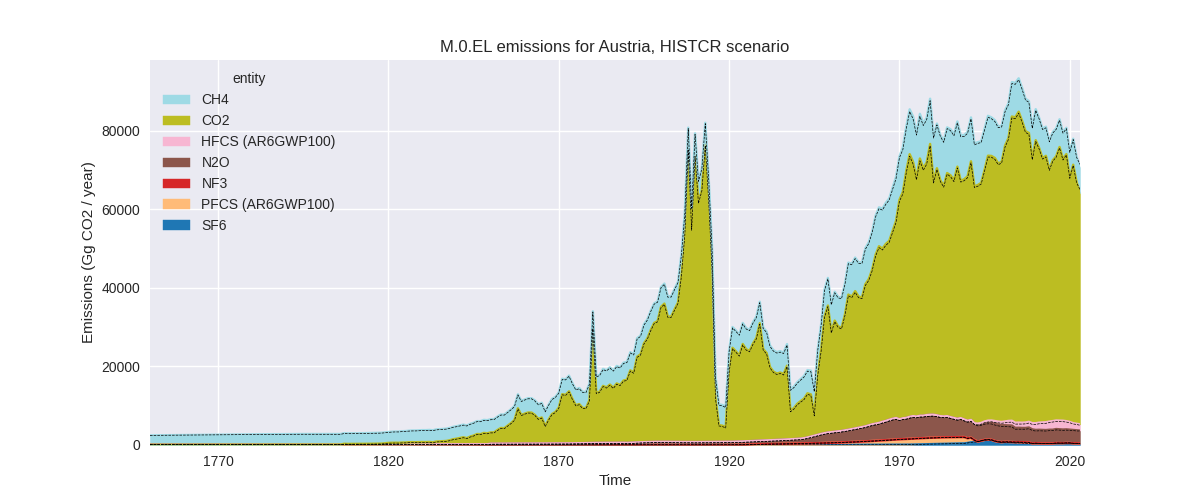
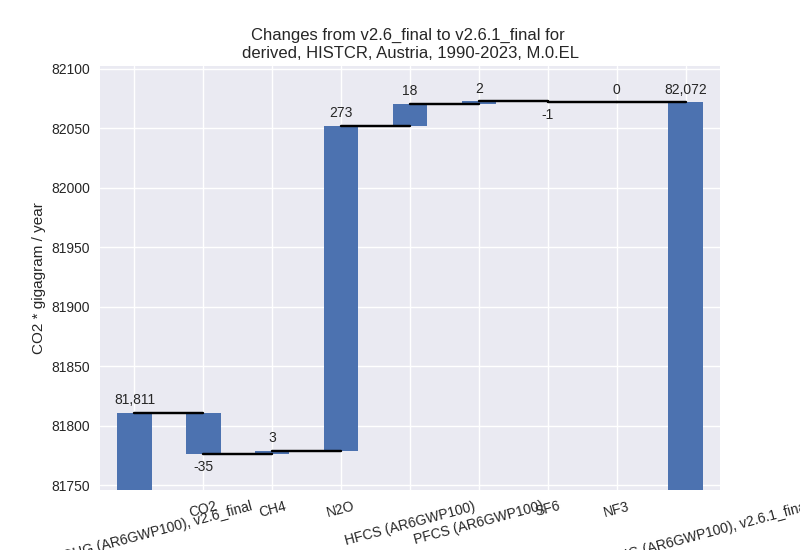
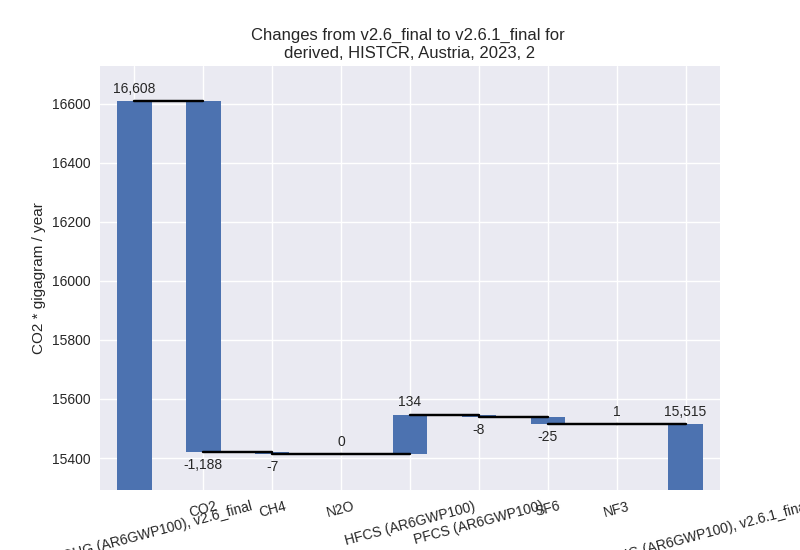
The following figures show the aggregate national total emissions excluding LULUCF AR6GWP100 for the country reported priority scenario. The dotted linesshow the v2.6_final data.
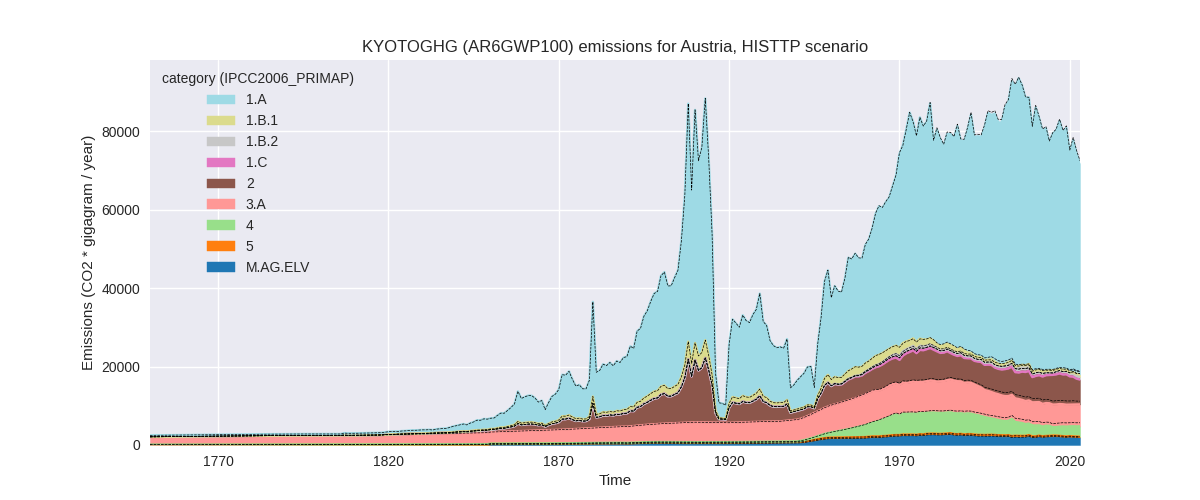
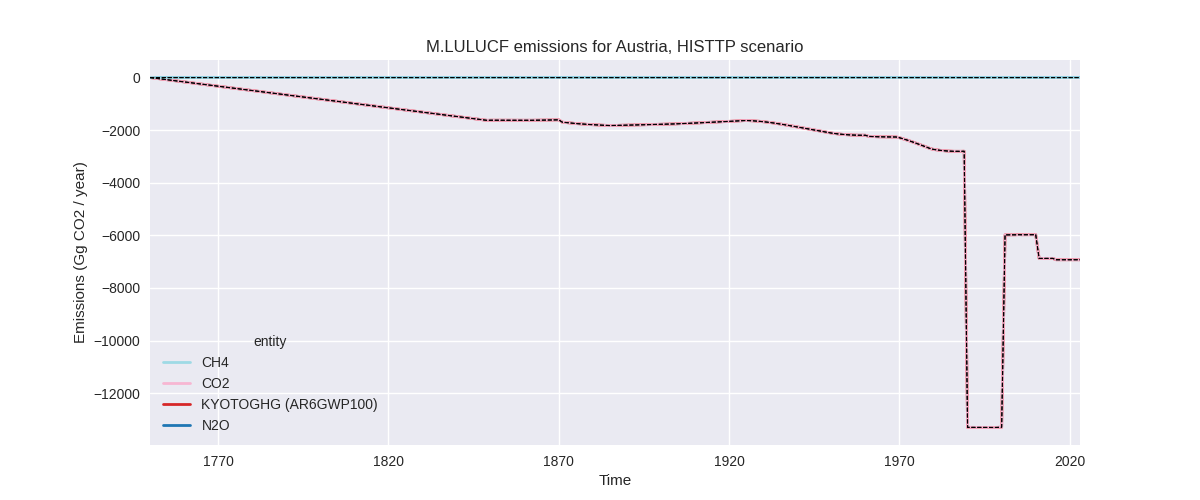
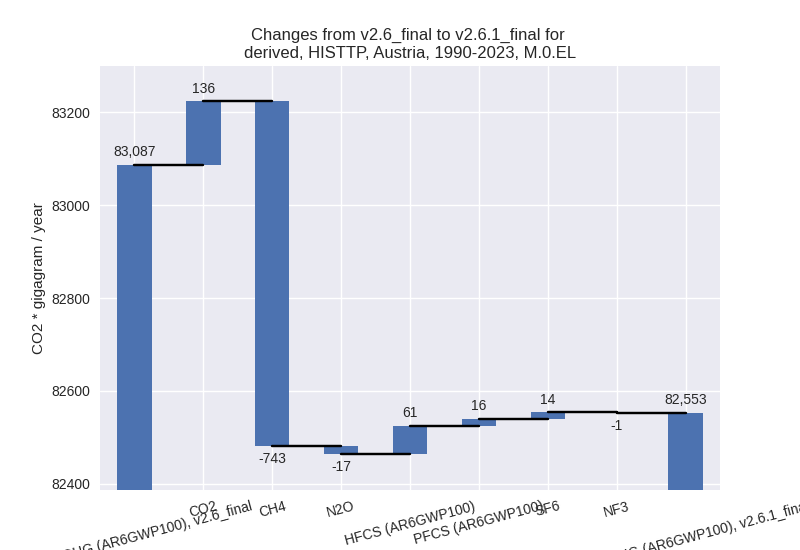
The following figures show the aggregate national total emissions excluding LULUCF AR6GWP100 for the third party priority scenario. The dotted linesshow the v2.6_final data.

Overview over changes
In the country reported priority scenario we have the following changes for aggregate Kyoto GHG and national total emissions excluding LULUCF (M.0.EL):
- Emissions in 2023 have changed by -1.2%% (-865.05 Gg CO2 / year)
- Emissions in 1990-2023 have changed by 0.3%% (260.82 Gg CO2 / year)
In the third party priority scenario we have the following changes for aggregate Kyoto GHG and national total emissions excluding LULUCF (M.0.EL):
- Emissions in 2023 have changed by -1.2%% (-833.59 Gg CO2 / year)
- Emissions in 1990-2023 have changed by -0.6%% (-534.11 Gg CO2 / year)
Most important changes per scenario and time frame
In the country reported priority scenario the following sector-gas combinations have the highest absolute impact on national total KyotoGHG (AR6GWP100) emissions in 2023 (top 5):
- 1: 2, CO2 with -1187.87 Gg CO2 / year (-8.1%)
- 2: 5, N2O with 149.46 Gg CO2 / year (inf%)
- 3: 2, HFCS (AR6GWP100) with 134.17 Gg CO2 / year (9.2%)
- 4: 4, CH4 with 68.90 Gg CO2 / year (7.7%)
- 5: 3.A, CH4 with 46.26 Gg CO2 / year (1.0%)
In the country reported priority scenario the following sector-gas combinations have the highest absolute impact on national total KyotoGHG (AR6GWP100) emissions in 1990-2023 (top 5):
- 1: 5, N2O with 273.82 Gg CO2 / year (inf%)
- 2: 2, CO2 with -34.94 Gg CO2 / year (-0.3%)
- 3: 2, HFCS (AR6GWP100) with 18.34 Gg CO2 / year (1.5%)
- 4: 2, PFCS (AR6GWP100) with 2.20 Gg CO2 / year (1.4%)
- 5: 4, CH4 with 2.03 Gg CO2 / year (0.1%)
In the third party priority scenario the following sector-gas combinations have the highest absolute impact on national total KyotoGHG (AR6GWP100) emissions in 2023 (top 5):
- 1: 4, CH4 with -849.93 Gg CO2 / year (-26.3%)
- 2: 2, HFCS (AR6GWP100) with -429.24 Gg CO2 / year (-22.3%)
- 3: 1.B.1, CO2 with 400.26 Gg CO2 / year (510.5%)
- 4: 1.B.2, CH4 with 146.20 Gg CO2 / year (33.6%)
- 5: 2, SF6 with -136.47 Gg CO2 / year (-25.1%)
In the third party priority scenario the following sector-gas combinations have the highest absolute impact on national total KyotoGHG (AR6GWP100) emissions in 1990-2023 (top 5):
- 1: 4, CH4 with -862.17 Gg CO2 / year (-21.4%)
- 2: 1.B.2, CO2 with 114.93 Gg CO2 / year (127.2%)
- 3: 1.B.1, CH4 with 84.37 Gg CO2 / year (54.2%)
- 4: 2, HFCS (AR6GWP100) with 60.88 Gg CO2 / year (5.1%)
- 5: 1.B.2, CH4 with 28.87 Gg CO2 / year (5.4%)
Notes on data changes
Here we list notes explaining important emissions changes for the country.
- CRT data has been included but replaces official data reported to the EU which does not show noteworthy differences.
- Changes in the CR time-series are small and come from updated third party data (EDGAR, FAO) which is used to extrapolate the country reported data.
- Changes in the TP scenario are small in terms of total emissions as well and due to input data updates (EDGAR, FAO)
- Emissions in sector 5 are now non-zero because the CRT submissions leave the sector empty while in CRF data used before it was zero. As the sector is missing in country reported data it is filled from EDGAR data.
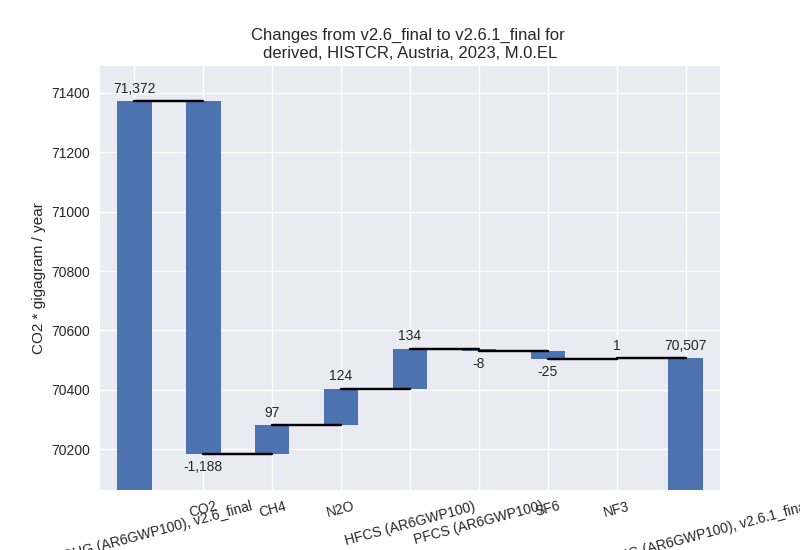
Changes by sector and gas
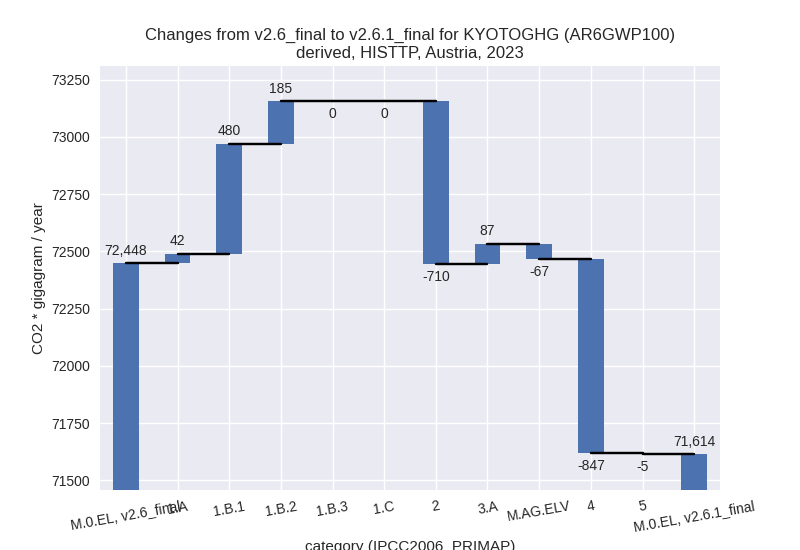
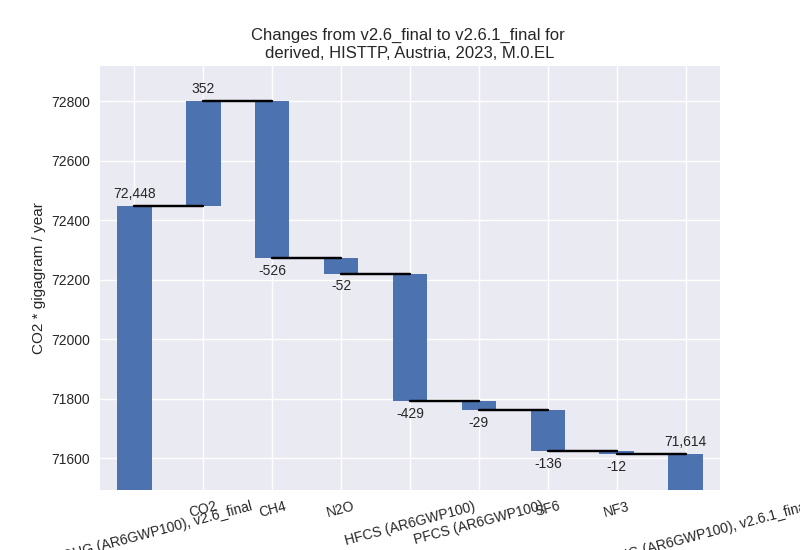
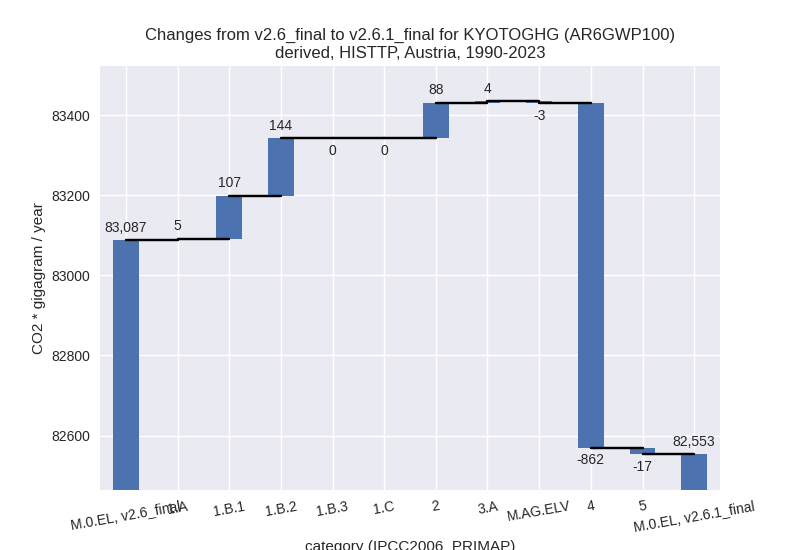
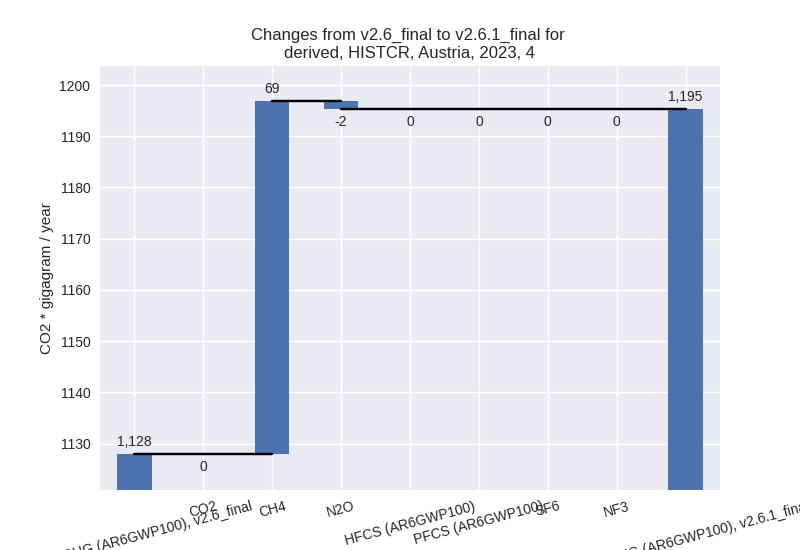
For each scenario and time frame the changes are displayed for all individual sectors and all individual gases. In the sector plot we use aggregate Kyoto GHGs in AR6GWP100. In the gas plot we usenational total emissions without LULUCF.
country reported scenario
2023
1990-2023
third party scenario
2023
1990-2023
Detailed changes for the scenarios:
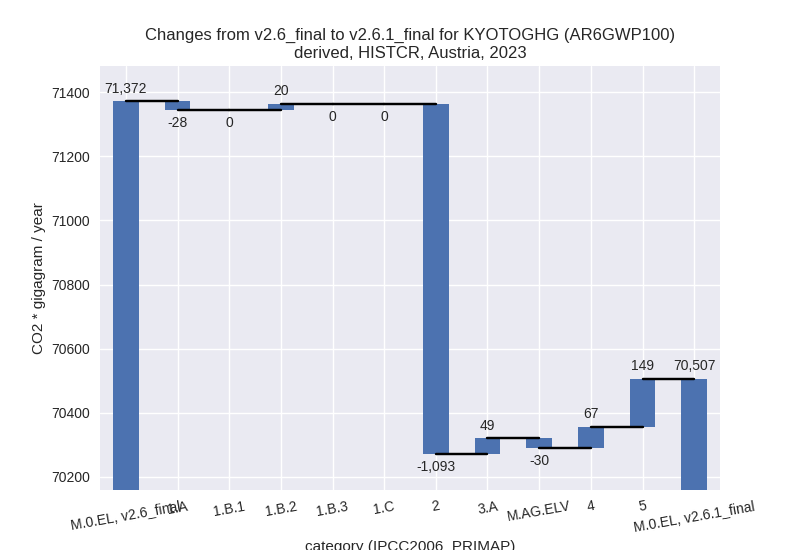
country reported scenario (HISTCR):
Most important changes per time frame
For 2023 the following sector-gas combinations have the highest absolute impact on national total KyotoGHG (AR6GWP100) emissions in 2023 (top 5):
- 1: 2, CO2 with -1187.87 Gg CO2 / year (-8.1%)
- 2: 5, N2O with 149.46 Gg CO2 / year (inf%)
- 3: 2, HFCS (AR6GWP100) with 134.17 Gg CO2 / year (9.2%)
- 4: 4, CH4 with 68.90 Gg CO2 / year (7.7%)
- 5: 3.A, CH4 with 46.26 Gg CO2 / year (1.0%)
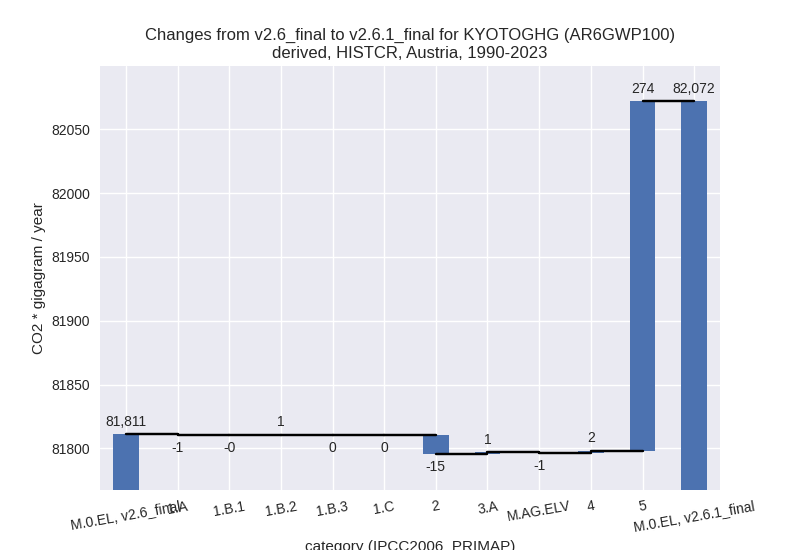
For 1990-2023 the following sector-gas combinations have the highest absolute impact on national total KyotoGHG (AR6GWP100) emissions in 1990-2023 (top 5):
- 1: 5, N2O with 273.82 Gg CO2 / year (inf%)
- 2: 2, CO2 with -34.94 Gg CO2 / year (-0.3%)
- 3: 2, HFCS (AR6GWP100) with 18.34 Gg CO2 / year (1.5%)
- 4: 2, PFCS (AR6GWP100) with 2.20 Gg CO2 / year (1.4%)
- 5: 4, CH4 with 2.03 Gg CO2 / year (0.1%)
Changes in the main sectors for aggregate KyotoGHG (AR6GWP100) are
- 1: Total sectoral emissions in 2022 are 48478.44 Gg CO2 / year which is 66.1% of M.0.EL emissions. 2023 Emissions have changed by -0.0% (-8.08 Gg CO2 / year). 1990-2023 Emissions have changed by -0.0% (-0.24 Gg CO2 / year).
- 2: Total sectoral emissions in 2022 are 16213.45 Gg
CO2 / year which is 22.1% of M.0.EL emissions. 2023 Emissions have
changed by -6.6% (-1092.65 Gg CO2 /
year). 1990-2023 Emissions have changed by -0.1% (-15.30 Gg CO2 / year). For 2023 the
changes per gas
are:
- M.AG: Total sectoral emissions in 2022 are 7326.12 Gg CO2 / year which is 10.0% of M.0.EL emissions. 2023 Emissions have changed by 0.3% (18.91 Gg CO2 / year). 1990-2023 Emissions have changed by 0.0% (0.56 Gg CO2 / year).
- 4: Total sectoral emissions in 2022 are 1177.11 Gg
CO2 / year which is 1.6% of M.0.EL emissions. 2023 Emissions have
changed by 6.0% (67.31 Gg CO2 /
year). 1990-2023 Emissions have changed by 0.1% (1.98 Gg CO2 / year). For 2023 the
changes per gas
are:
- 5: Total sectoral emissions in 2022 are 159.89 Gg
CO2 / year which is 0.2% of M.0.EL emissions. 2023 Emissions have
changed by inf% (149.46 Gg CO2 /
year). 1990-2023 Emissions have changed by inf% (273.82 Gg CO2 / year). For 2023 the
changes per gas
are:
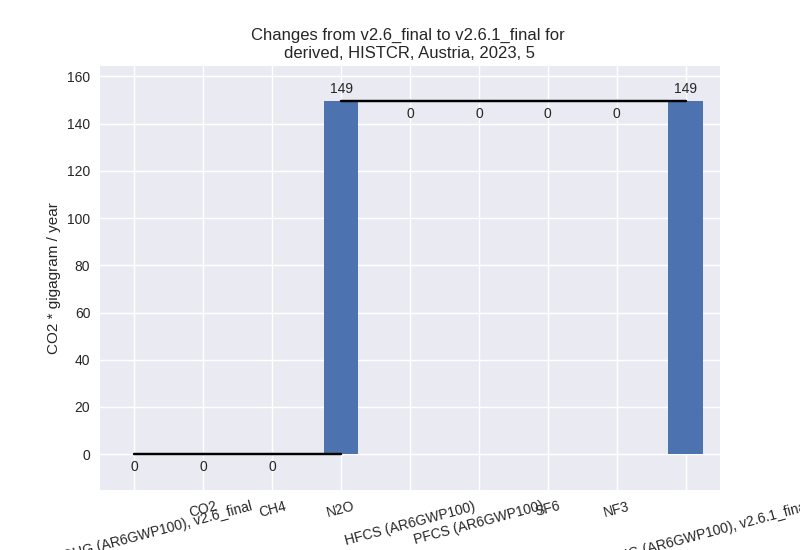
For 1990-2023 the changes per gas are: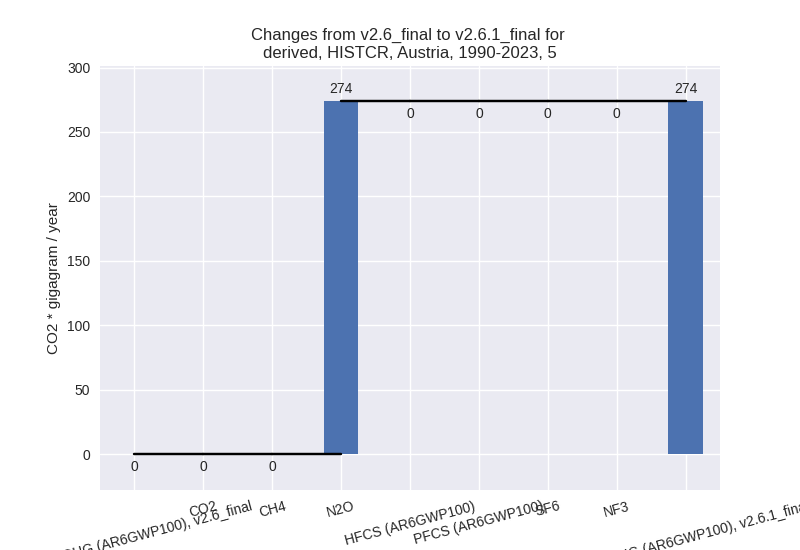
third party scenario (HISTTP):
Most important changes per time frame
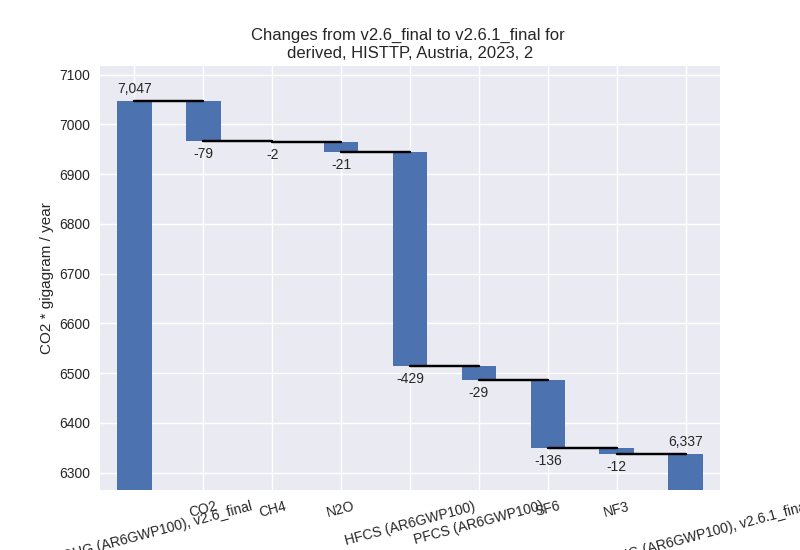
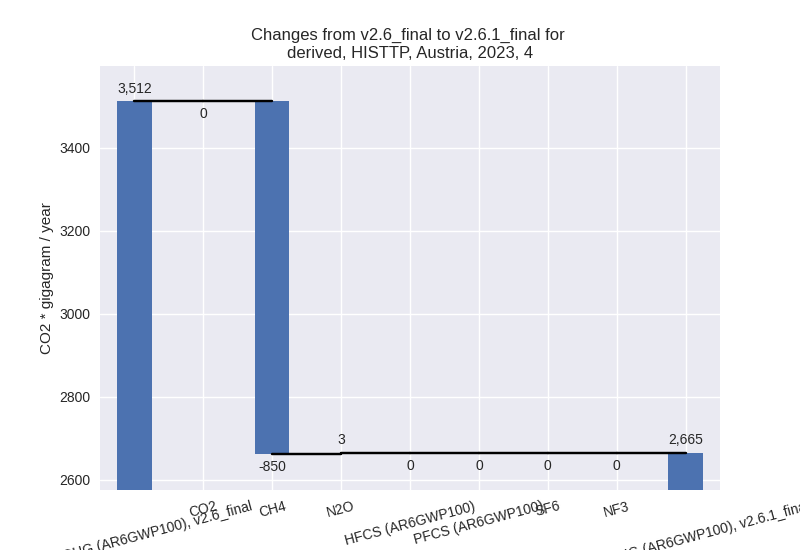
For 2023 the following sector-gas combinations have the highest absolute impact on national total KyotoGHG (AR6GWP100) emissions in 2023 (top 5):
- 1: 4, CH4 with -849.93 Gg CO2 / year (-26.3%)
- 2: 2, HFCS (AR6GWP100) with -429.24 Gg CO2 / year (-22.3%)
- 3: 1.B.1, CO2 with 400.26 Gg CO2 / year (510.5%)
- 4: 1.B.2, CH4 with 146.20 Gg CO2 / year (33.6%)
- 5: 2, SF6 with -136.47 Gg CO2 / year (-25.1%)
For 1990-2023 the following sector-gas combinations have the highest absolute impact on national total KyotoGHG (AR6GWP100) emissions in 1990-2023 (top 5):
- 1: 4, CH4 with -862.17 Gg CO2 / year (-21.4%)
- 2: 1.B.2, CO2 with 114.93 Gg CO2 / year (127.2%)
- 3: 1.B.1, CH4 with 84.37 Gg CO2 / year (54.2%)
- 4: 2, HFCS (AR6GWP100) with 60.88 Gg CO2 / year (5.1%)
- 5: 1.B.2, CH4 with 28.87 Gg CO2 / year (5.4%)
Changes in the main sectors for aggregate KyotoGHG (AR6GWP100) are
- 1: Total sectoral emissions in 2022 are 57360.64 Gg CO2 / year which is 77.2% of M.0.EL emissions. 2023 Emissions have changed by 1.3% (707.24 Gg CO2 / year). 1990-2023 Emissions have changed by 0.4% (255.70 Gg CO2 / year).
- 2: Total sectoral emissions in 2022 are 6580.33 Gg
CO2 / year which is 8.9% of M.0.EL emissions. 2023 Emissions have
changed by -10.1% (-709.55 Gg CO2 /
year). 1990-2023 Emissions have changed by 1.3% (87.90 Gg CO2 / year). For 2023 the
changes per gas
are:
- M.AG: Total sectoral emissions in 2022 are 7543.22 Gg CO2 / year which is 10.2% of M.0.EL emissions. 2023 Emissions have changed by 0.3% (19.90 Gg CO2 / year). 1990-2023 Emissions have changed by 0.0% (0.75 Gg CO2 / year).
- 4: Total sectoral emissions in 2022 are 2622.79 Gg
CO2 / year which is 3.5% of M.0.EL emissions. 2023 Emissions have
changed by -24.1% (-846.64 Gg CO2 /
year). 1990-2023 Emissions have changed by -20.2% (-861.81 Gg CO2 / year). For 2023
the changes per gas
are:
For 1990-2023 the changes per gas are:
- 5: Total sectoral emissions in 2022 are 159.89 Gg
CO2 / year which is 0.2% of M.0.EL emissions. 2023 Emissions have
changed by -2.9% (-4.53 Gg CO2 /
year). 1990-2023 Emissions have changed by -5.7% (-16.66 Gg CO2 / year). For 2023 the
changes per gas
are:
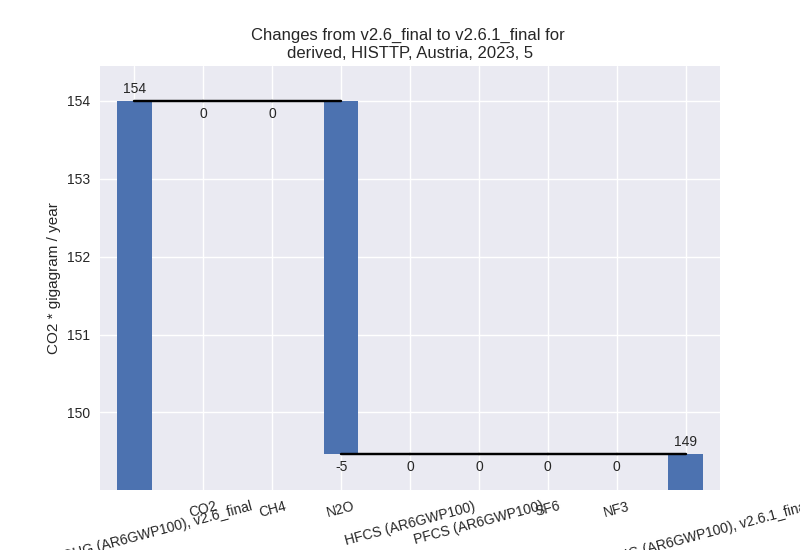
For 1990-2023 the changes per gas are: