Changes in PRIMAP-hist v2.6.1_final compared to v2.6_final for Azerbaijan
2025-03-19
Johannes Gütschow
Change analysis for Azerbaijan for PRIMAP-hist v2.6.1_final compared to v2.6_final
Overview over emissions by sector and gas
The following figures show the aggregate national total emissions excluding LULUCF AR6GWP100 for the country reported priority scenario. The dotted linesshow the v2.6_final data.
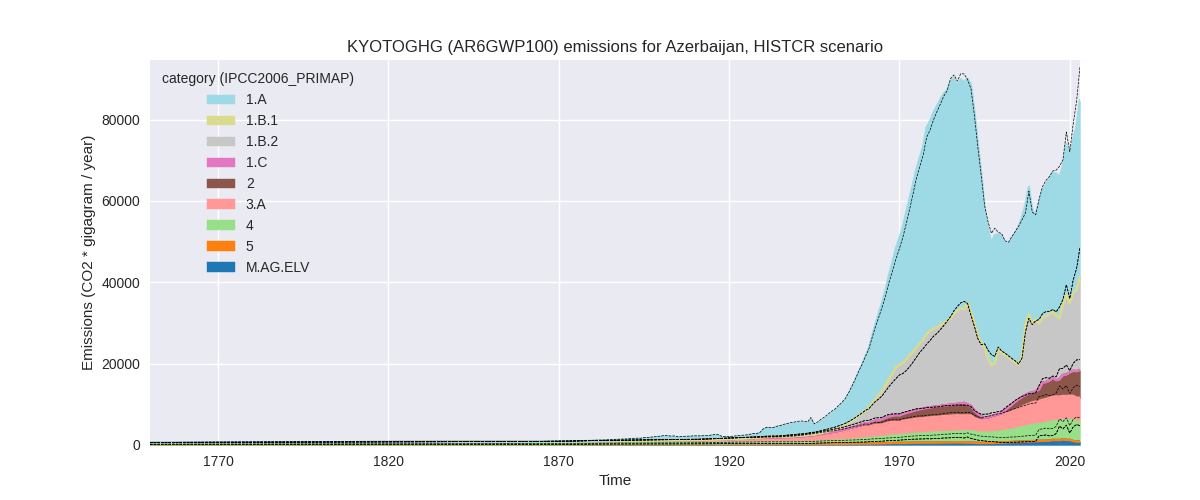
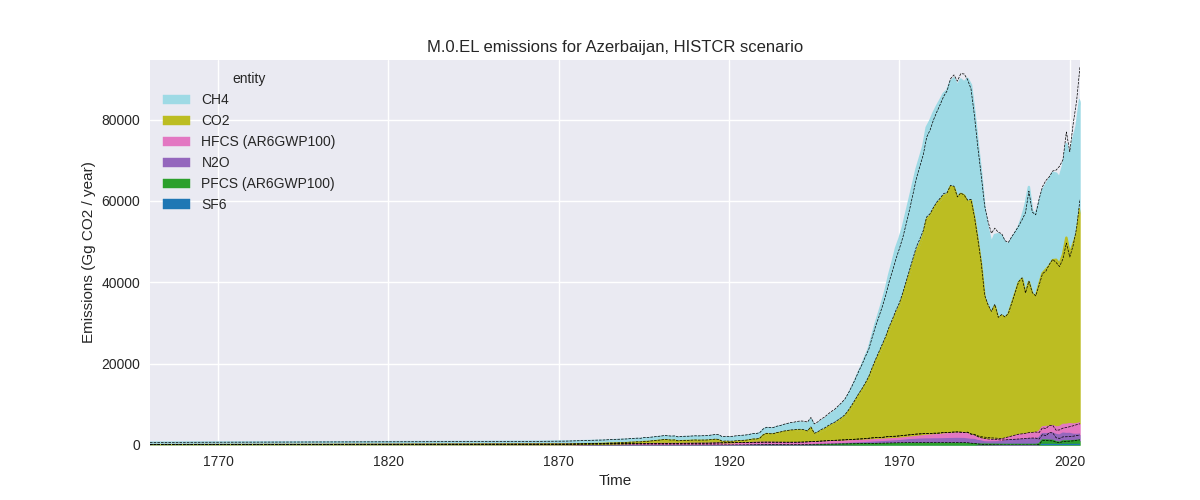
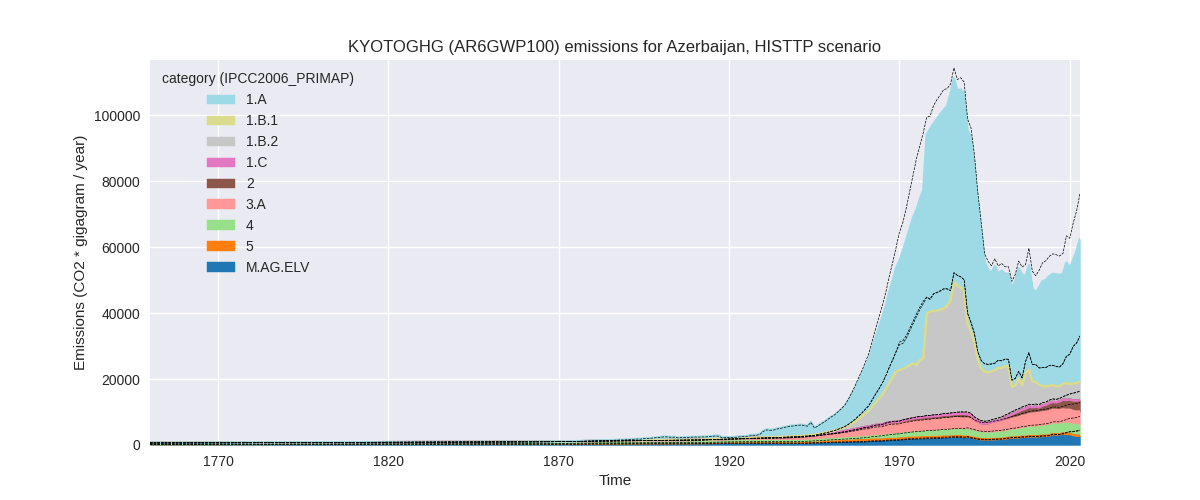
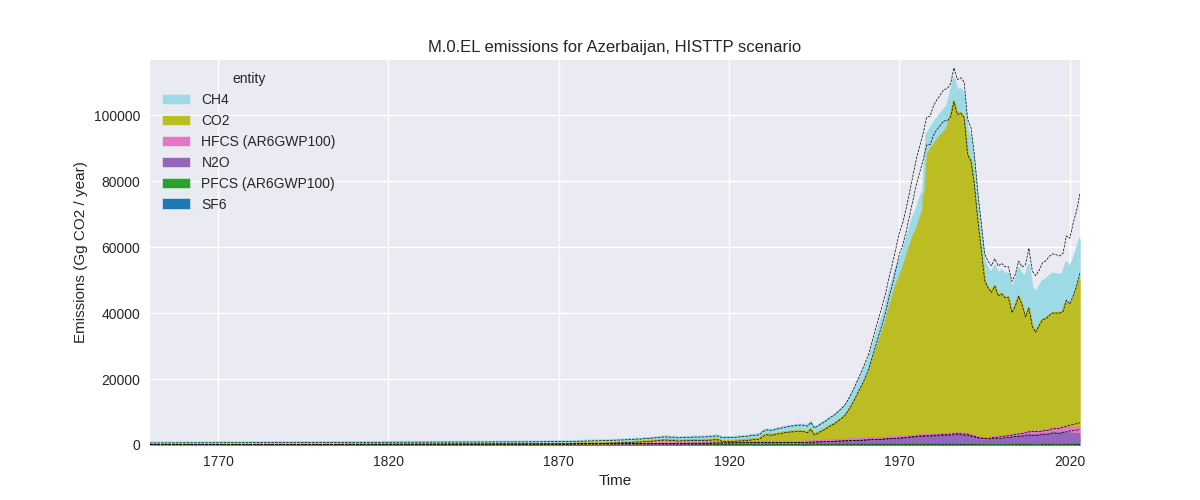
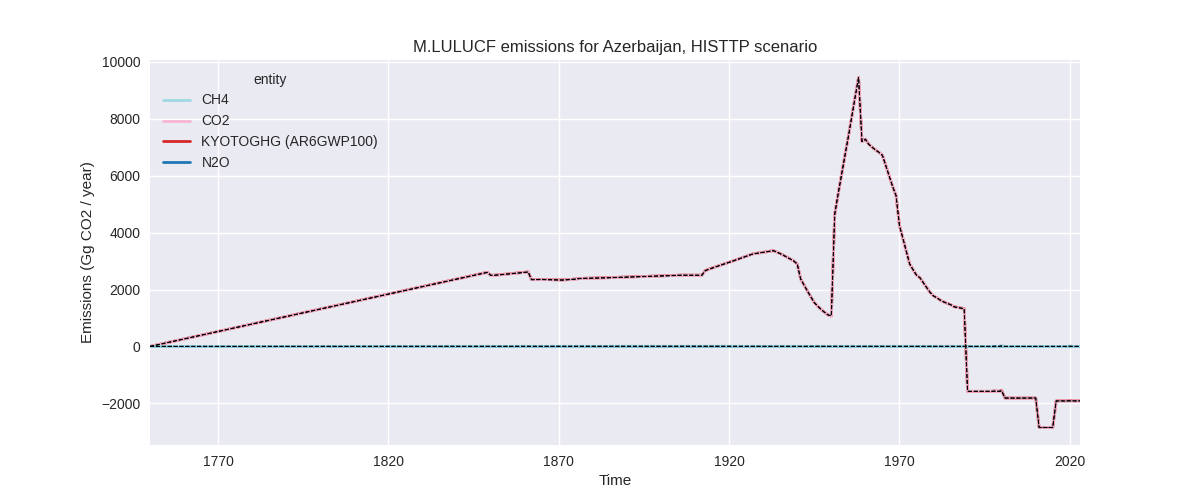
The following figures show the aggregate national total emissions excluding LULUCF AR6GWP100 for the third party priority scenario. The dotted linesshow the v2.6_final data.
Overview over changes
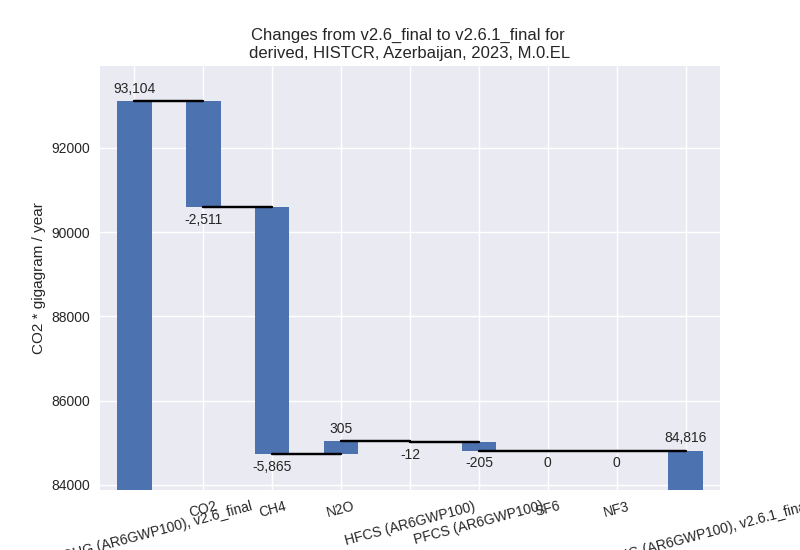
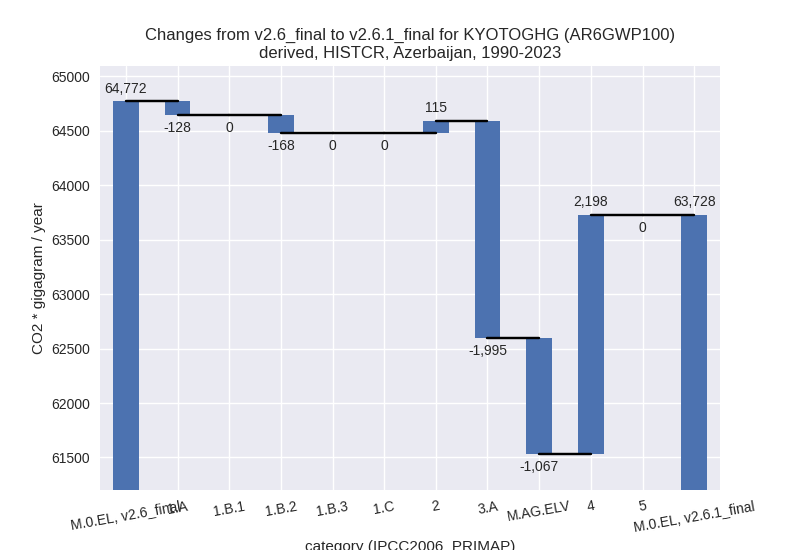
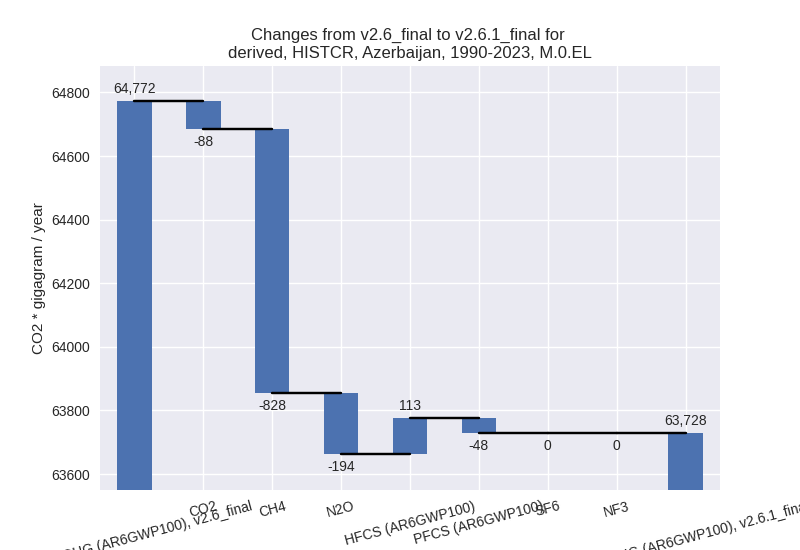
In the country reported priority scenario we have the following changes for aggregate Kyoto GHG and national total emissions excluding LULUCF (M.0.EL):
- Emissions in 2023 have changed by -8.9%% (-8288.22 Gg CO2 / year)
- Emissions in 1990-2023 have changed by -1.6%% (-1044.15 Gg CO2 / year)
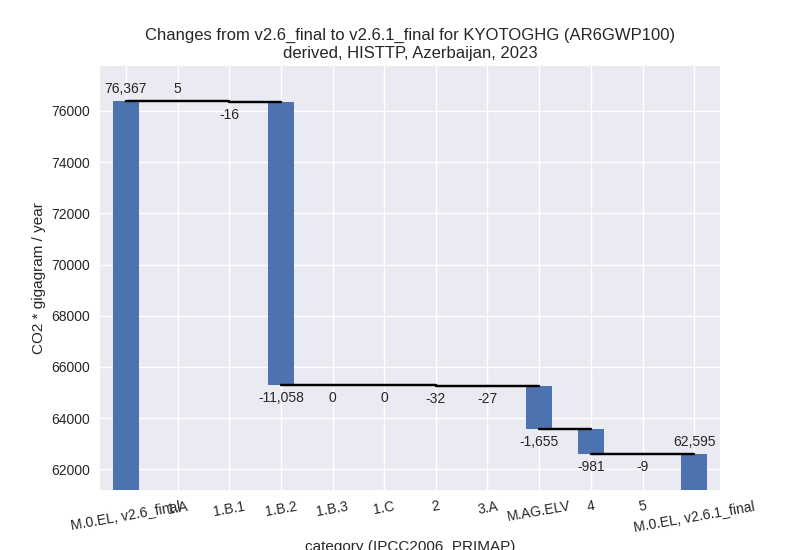
In the third party priority scenario we have the following changes for aggregate Kyoto GHG and national total emissions excluding LULUCF (M.0.EL):
- Emissions in 2023 have changed by -18.0%% (-13772.59 Gg CO2 / year)
- Emissions in 1990-2023 have changed by -7.7%% (-4736.82 Gg CO2 / year)
Most important changes per scenario and time frame
In the country reported priority scenario the following sector-gas combinations have the highest absolute impact on national total KyotoGHG (AR6GWP100) emissions in 2023 (top 5):
- 1: M.AG.ELV, CH4 with -4466.86 Gg CO2 / year (-99.7%)
- 2: 1.B.2, CH4 with -2858.88 Gg CO2 / year (-14.9%)
- 3: 4, CH4 with 2837.23 Gg CO2 / year (148.9%)
- 4: 1.B.2, CO2 with -1852.26 Gg CO2 / year (-21.8%)
- 5: 3.A, CH4 with -1386.56 Gg CO2 / year (-19.9%)
In the country reported priority scenario the following sector-gas combinations have the highest absolute impact on national total KyotoGHG (AR6GWP100) emissions in 1990-2023 (top 5):
- 1: 4, CH4 with 2043.61 Gg CO2 / year (141.5%)
- 2: 3.A, CH4 with -1555.67 Gg CO2 / year (-25.1%)
- 3: M.AG.ELV, CH4 with -1156.62 Gg CO2 / year (-99.0%)
- 4: 3.A, N2O with -439.06 Gg CO2 / year (-66.9%)
- 5: 1.B.2, CH4 with -158.59 Gg CO2 / year (-1.2%)
In the third party priority scenario the following sector-gas combinations have the highest absolute impact on national total KyotoGHG (AR6GWP100) emissions in 2023 (top 5):
- 1: 1.B.2, CH4 with -11059.93 Gg CO2 / year (-69.3%)
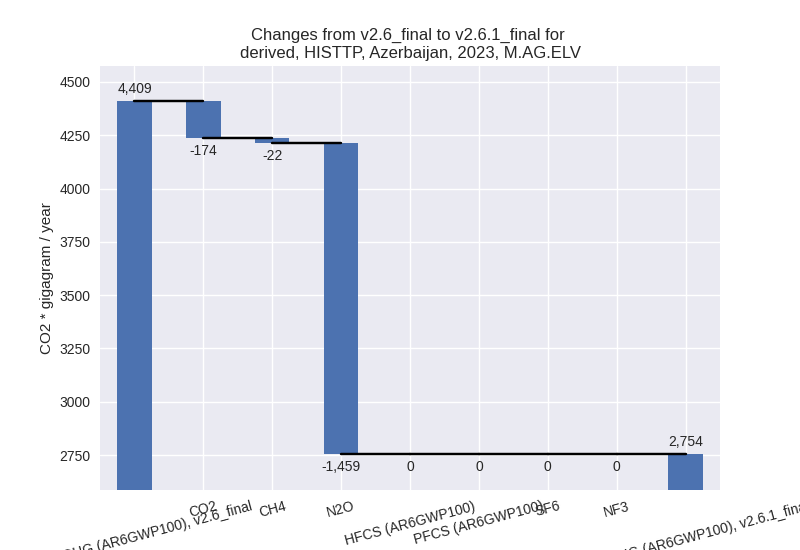
- 2: M.AG.ELV, N2O with -1458.98 Gg CO2 / year (-36.3%)
- 3: 4, CH4 with -995.05 Gg CO2 / year (-25.2%)
- 4: M.AG.ELV, CO2 with -174.26 Gg CO2 / year (-55.3%)
- 5: 3.A, CH4 with -26.42 Gg CO2 / year (-0.6%)
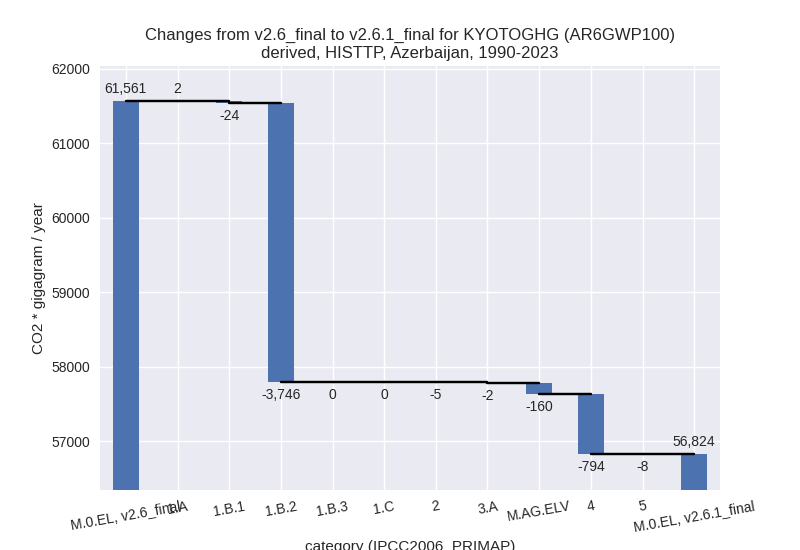
In the third party priority scenario the following sector-gas combinations have the highest absolute impact on national total KyotoGHG (AR6GWP100) emissions in 1990-2023 (top 5):
- 1: 1.B.2, CH4 with -3746.42 Gg CO2 / year (-53.3%)
- 2: 4, CH4 with -795.16 Gg CO2 / year (-26.3%)
- 3: M.AG.ELV, N2O with -145.45 Gg CO2 / year (-6.1%)
- 4: 1.B.1, CO2 with -17.33 Gg CO2 / year (-100.0%)
- 5: M.AG.ELV, CO2 with -13.08 Gg CO2 / year (-14.1%)
Notes on data changes
Here we list notes explaining important emissions changes for the country.
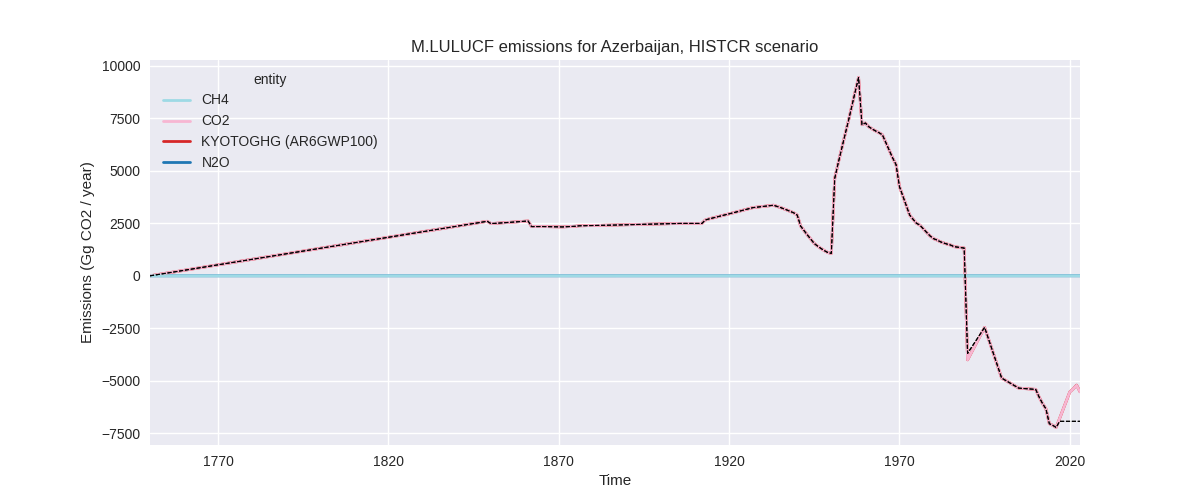
- New CRT data for 1990, 2020-2022 have been added and replace and extend NC4 data which covers 1990, 1995, 2000, 2005, 2010-2016. DI data is not internally consistent regarding sector and gas coverage and omitted. NC and CRT data are not consistent for all sectors. We use NC4 data for sectors 1, 2, 5 and LULUCF. For sector 1 data is very consistent, for sector 2 there are some differences in 1990, but consistency is still OK. For 5 data is zero. For M.LULUCF CO2 data is identical except for a small difference in 1990 while there is no LULUCF data for CH4 and N2O in NC4.
- The country reported data points for 2020-2022 replace data calculated using growth rates from third party sources and lead to high changes in 2023 for several sectors and gases.
Changes by sector and gas
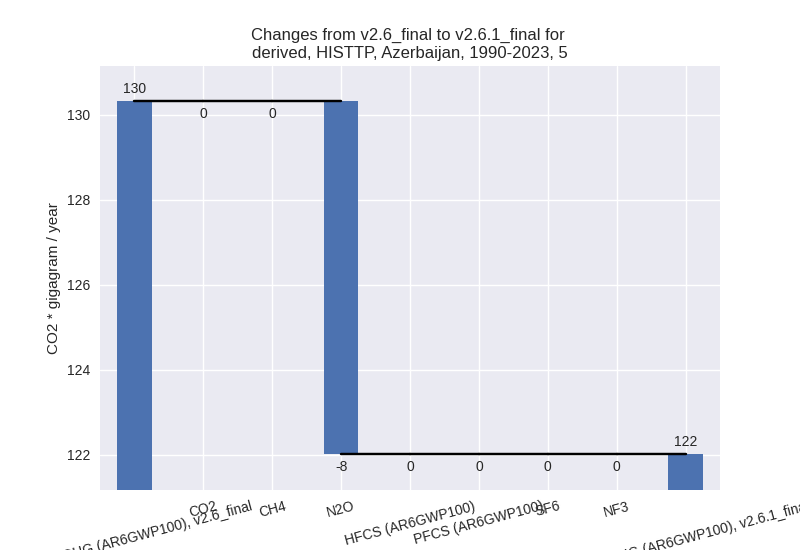
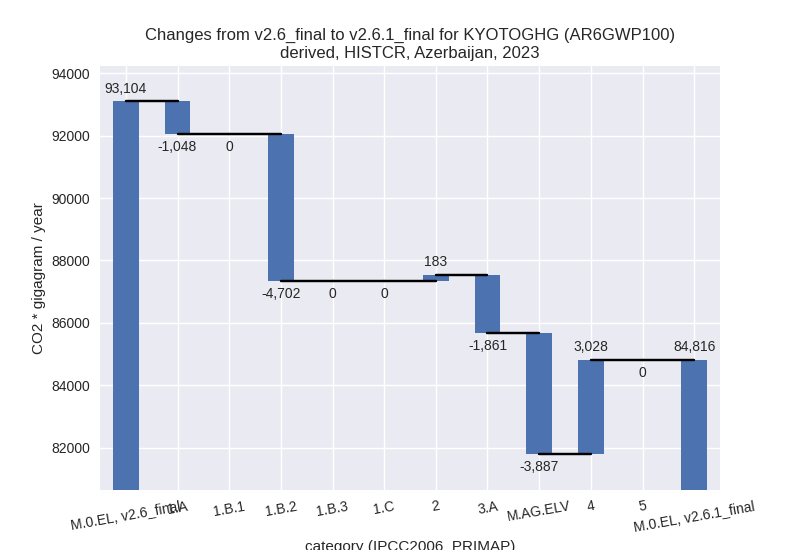
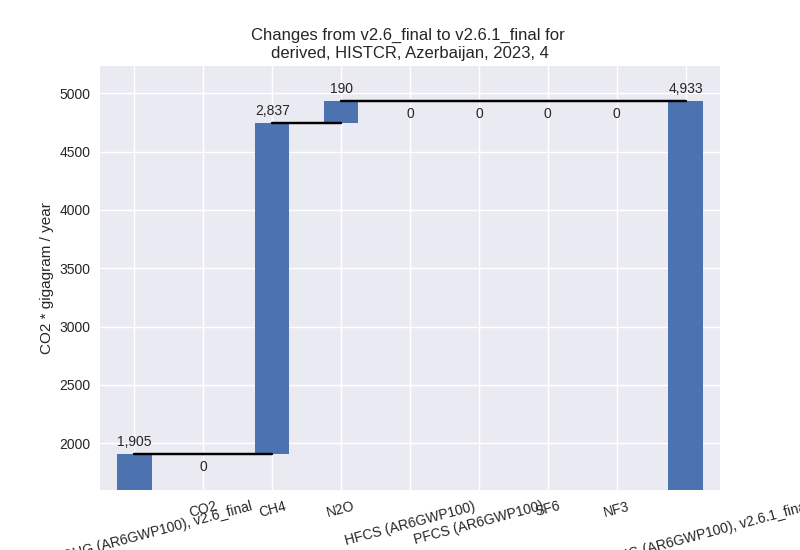
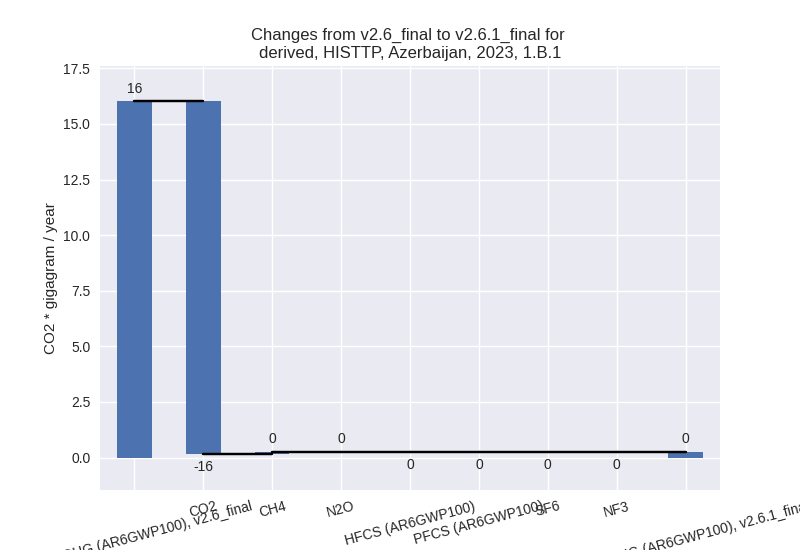
For each scenario and time frame the changes are displayed for all individual sectors and all individual gases. In the sector plot we use aggregate Kyoto GHGs in AR6GWP100. In the gas plot we usenational total emissions without LULUCF.
country reported scenario
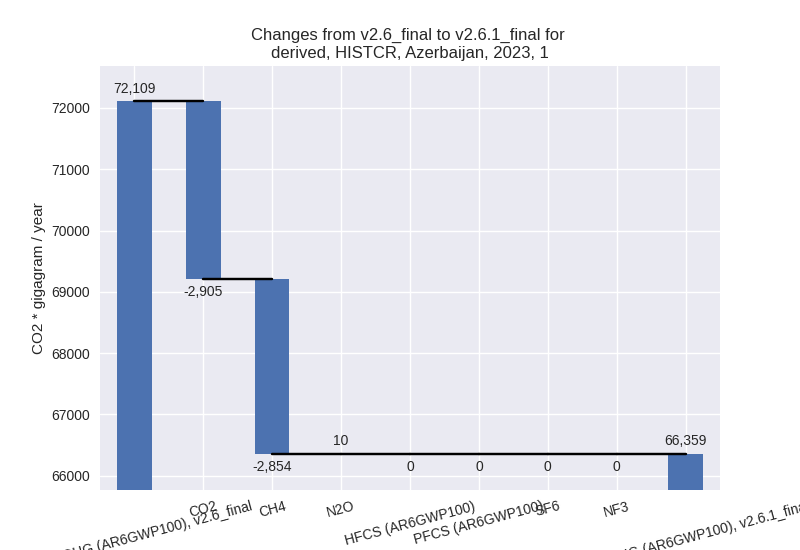
2023
1990-2023
third party scenario
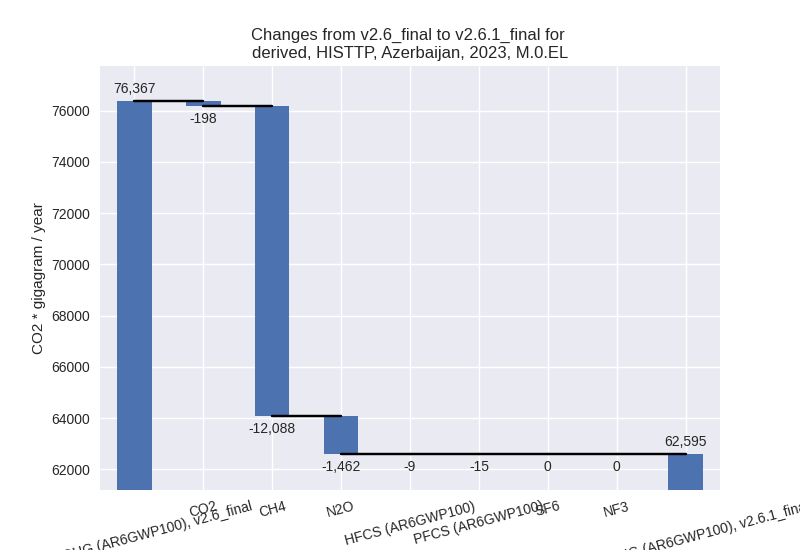
2023
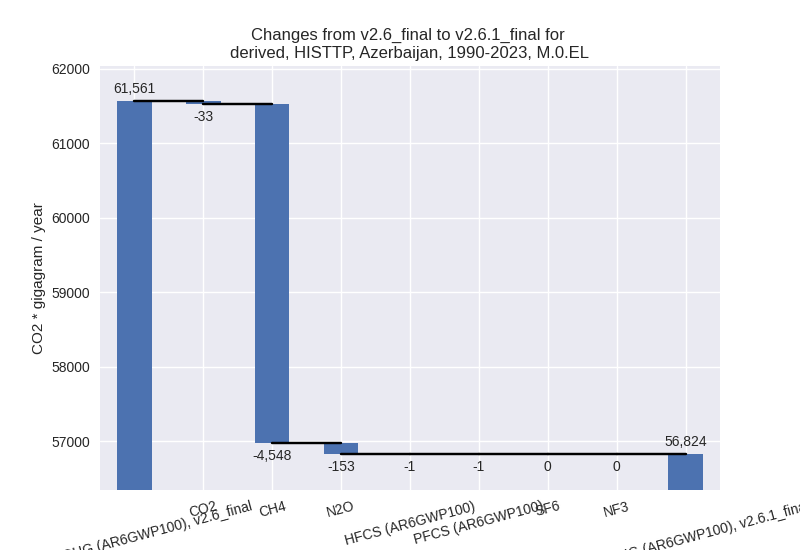
1990-2023
Detailed changes for the scenarios:
country reported scenario (HISTCR):
Most important changes per time frame
For 2023 the following sector-gas combinations have the highest absolute impact on national total KyotoGHG (AR6GWP100) emissions in 2023 (top 5):
- 1: M.AG.ELV, CH4 with -4466.86 Gg CO2 / year (-99.7%)
- 2: 1.B.2, CH4 with -2858.88 Gg CO2 / year (-14.9%)
- 3: 4, CH4 with 2837.23 Gg CO2 / year (148.9%)
- 4: 1.B.2, CO2 with -1852.26 Gg CO2 / year (-21.8%)
- 5: 3.A, CH4 with -1386.56 Gg CO2 / year (-19.9%)
For 1990-2023 the following sector-gas combinations have the highest absolute impact on national total KyotoGHG (AR6GWP100) emissions in 1990-2023 (top 5):
- 1: 4, CH4 with 2043.61 Gg CO2 / year (141.5%)
- 2: 3.A, CH4 with -1555.67 Gg CO2 / year (-25.1%)
- 3: M.AG.ELV, CH4 with -1156.62 Gg CO2 / year (-99.0%)
- 4: 3.A, N2O with -439.06 Gg CO2 / year (-66.9%)
- 5: 1.B.2, CH4 with -158.59 Gg CO2 / year (-1.2%)
Changes in the main sectors for aggregate KyotoGHG (AR6GWP100) are
- 1: Total sectoral emissions in 2022 are 60173.25 Gg
CO2 / year which is 76.8% of M.0.EL emissions. 2023 Emissions have
changed by -8.0% (-5750.19 Gg CO2 /
year). 1990-2023 Emissions have changed by -0.6% (-295.31 Gg CO2 / year). For 2023
the changes per gas
are:
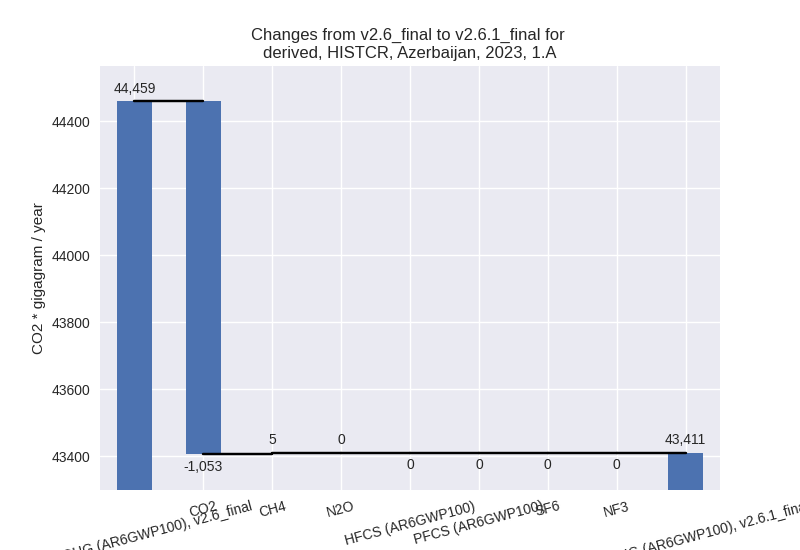
The changes come from the following subsectors:- 1.A: Total sectoral emissions in 2022 are 40184.90
Gg CO2 / year which is 66.8% of category 1 emissions. 2023 Emissions
have changed by -2.4% (-1048.07 Gg
CO2 / year). 1990-2023 Emissions have changed by -0.4% (-127.53 Gg CO2 / year). For 2023
the changes per gas
are:
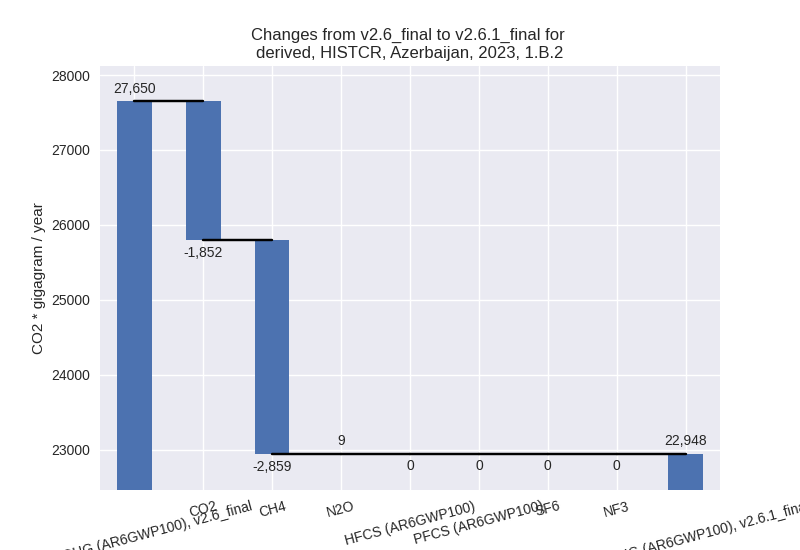
There is no subsector information available in PRIMAP-hist. - 1.B.2: Total sectoral emissions in 2022 are
19988.35 Gg CO2 / year which is 33.2% of category 1 emissions. 2023
Emissions have changed by -17.0%
(-4702.12 Gg CO2 / year). 1990-2023 Emissions have changed by -1.0% (-167.78 Gg CO2 / year). For 2023
the changes per gas
are:
There is no subsector information available in PRIMAP-hist.
- 1.A: Total sectoral emissions in 2022 are 40184.90
Gg CO2 / year which is 66.8% of category 1 emissions. 2023 Emissions
have changed by -2.4% (-1048.07 Gg
CO2 / year). 1990-2023 Emissions have changed by -0.4% (-127.53 Gg CO2 / year). For 2023
the changes per gas
are:
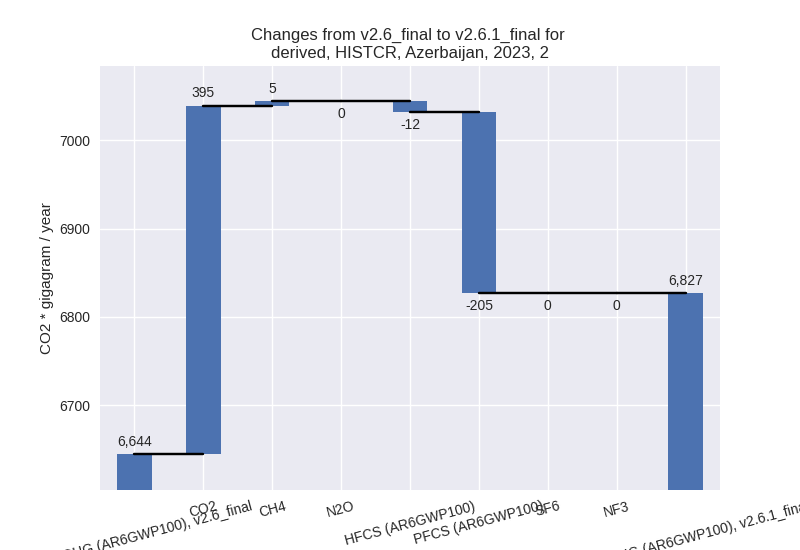
- 2: Total sectoral emissions in 2022 are 6532.92 Gg
CO2 / year which is 8.3% of M.0.EL emissions. 2023 Emissions have
changed by 2.7% (182.53 Gg CO2 /
year). 1990-2023 Emissions have changed by 4.2% (114.79 Gg CO2 / year). For 2023 the
changes per gas
are:
For 1990-2023 the changes per gas are: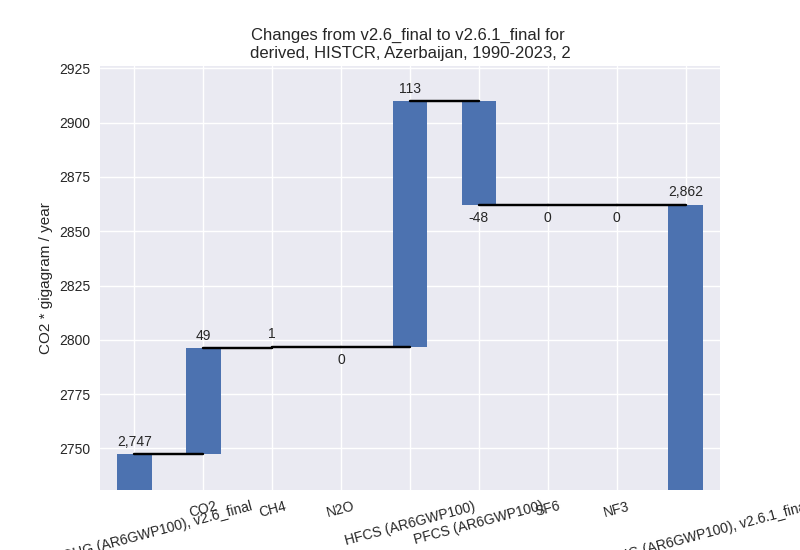
- M.AG: Total sectoral emissions in 2022 are 6729.38
Gg CO2 / year which is 8.6% of M.0.EL emissions. 2023 Emissions have
changed by -46.2% (-5748.21 Gg CO2 /
year). 1990-2023 Emissions have changed by -35.0% (-3061.98 Gg CO2 / year). For 2023
the changes per gas
are:
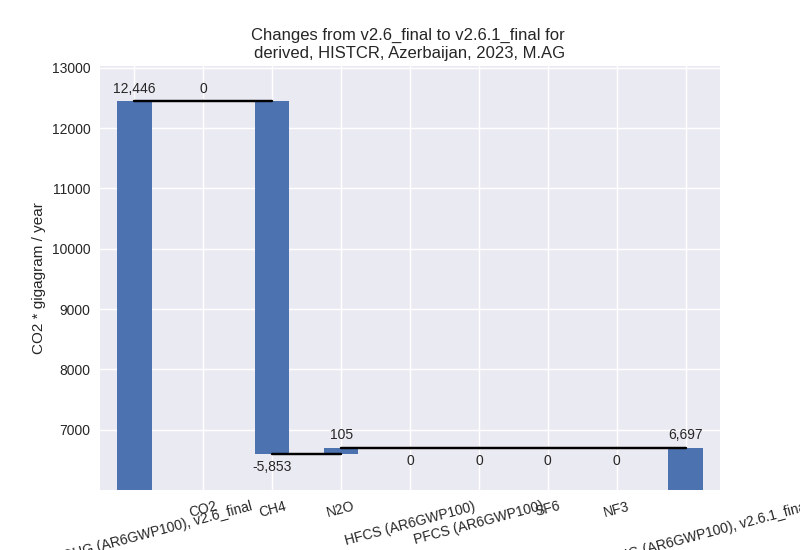
For 1990-2023 the changes per gas are:
The changes come from the following subsectors:- 3.A: Total sectoral emissions in 2022 are 5876.62
Gg CO2 / year which is 87.3% of category M.AG emissions. 2023 Emissions
have changed by -24.2% (-1861.39 Gg
CO2 / year). 1990-2023 Emissions have changed by -29.1% (-1994.73 Gg CO2 / year). For 2023
the changes per gas
are:
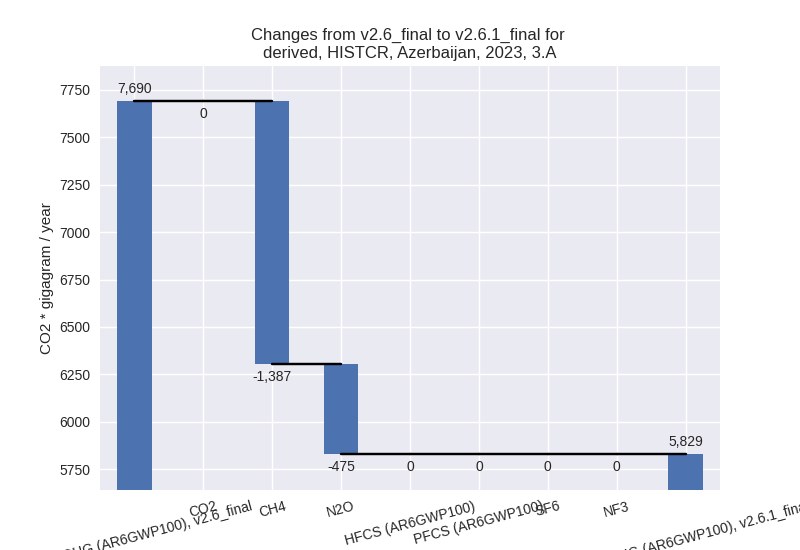
For 1990-2023 the changes per gas are: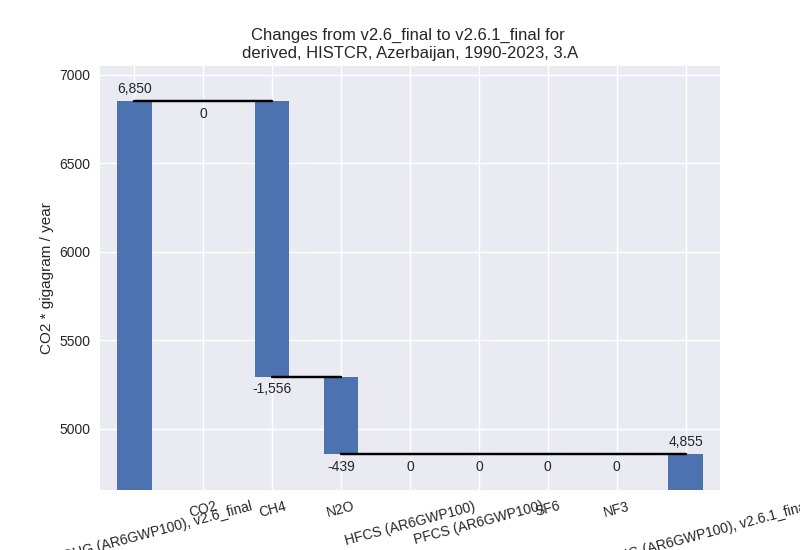
There is no subsector information available in PRIMAP-hist. - M.AG.ELV: Total sectoral emissions in 2022 are
852.75 Gg CO2 / year which is 12.7% of category M.AG emissions. 2023
Emissions have changed by -81.7%
(-3886.82 Gg CO2 / year). 1990-2023 Emissions have changed by -56.1% (-1067.24 Gg CO2 / year). For 2023
the changes per gas
are:
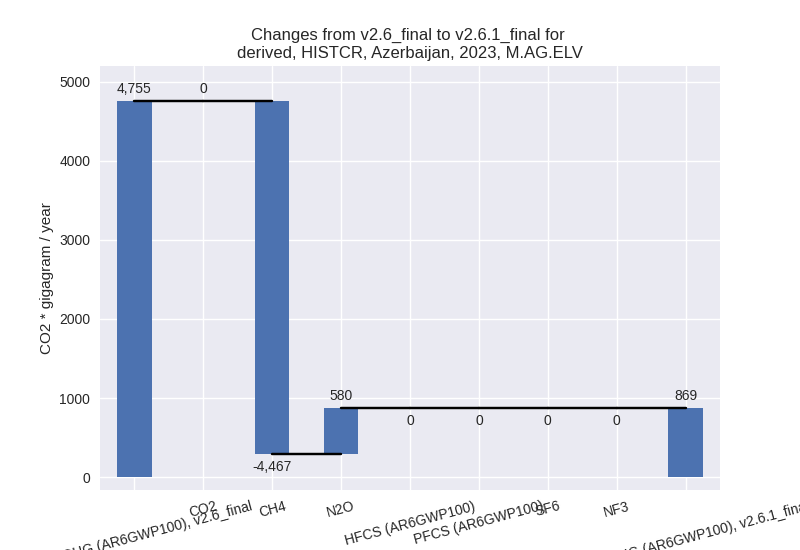
For 1990-2023 the changes per gas are: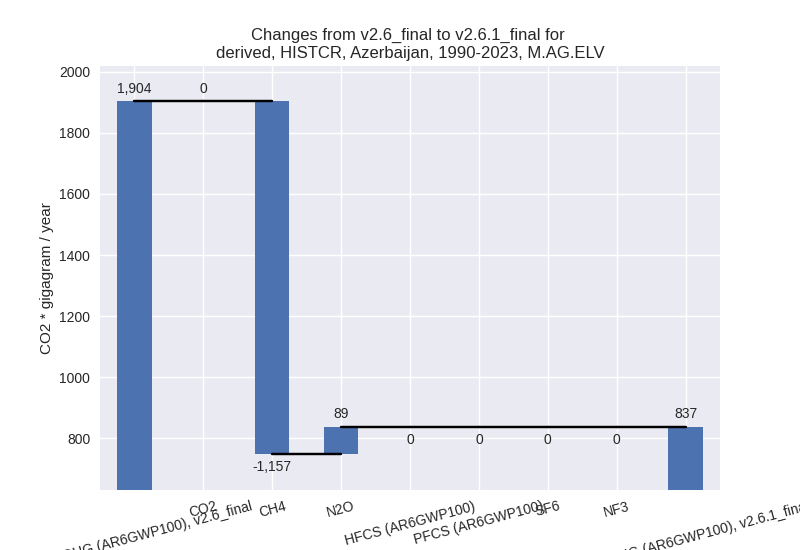
There is no subsector information available in PRIMAP-hist.
- 3.A: Total sectoral emissions in 2022 are 5876.62
Gg CO2 / year which is 87.3% of category M.AG emissions. 2023 Emissions
have changed by -24.2% (-1861.39 Gg
CO2 / year). 1990-2023 Emissions have changed by -29.1% (-1994.73 Gg CO2 / year). For 2023
the changes per gas
are:
- 4: Total sectoral emissions in 2022 are 4884.27 Gg
CO2 / year which is 6.2% of M.0.EL emissions. 2023 Emissions have
changed by 158.9% (3027.64 Gg CO2 /
year). 1990-2023 Emissions have changed by 152.2% (2198.34 Gg CO2 / year). For 2023
the changes per gas
are:
For 1990-2023 the changes per gas are:
- 5: No data
third party scenario (HISTTP):
Most important changes per time frame
For 2023 the following sector-gas combinations have the highest absolute impact on national total KyotoGHG (AR6GWP100) emissions in 2023 (top 5):
- 1: 1.B.2, CH4 with -11059.93 Gg CO2 / year (-69.3%)
- 2: M.AG.ELV, N2O with -1458.98 Gg CO2 / year (-36.3%)
- 3: 4, CH4 with -995.05 Gg CO2 / year (-25.2%)
- 4: M.AG.ELV, CO2 with -174.26 Gg CO2 / year (-55.3%)
- 5: 3.A, CH4 with -26.42 Gg CO2 / year (-0.6%)
For 1990-2023 the following sector-gas combinations have the highest absolute impact on national total KyotoGHG (AR6GWP100) emissions in 1990-2023 (top 5):
- 1: 1.B.2, CH4 with -3746.42 Gg CO2 / year (-53.3%)
- 2: 4, CH4 with -795.16 Gg CO2 / year (-26.3%)
- 3: M.AG.ELV, N2O with -145.45 Gg CO2 / year (-6.1%)
- 4: 1.B.1, CO2 with -17.33 Gg CO2 / year (-100.0%)
- 5: M.AG.ELV, CO2 with -13.08 Gg CO2 / year (-14.1%)
Changes in the main sectors for aggregate KyotoGHG (AR6GWP100) are
- 1: Total sectoral emissions in 2022 are 45339.18 Gg
CO2 / year which is 77.1% of M.0.EL emissions. 2023 Emissions have
changed by -18.4% (-11068.31 Gg CO2
/ year). 1990-2023 Emissions have changed by -7.5% (-3767.97 Gg CO2 / year). For 2023
the changes per gas
are:

For 1990-2023 the changes per gas are: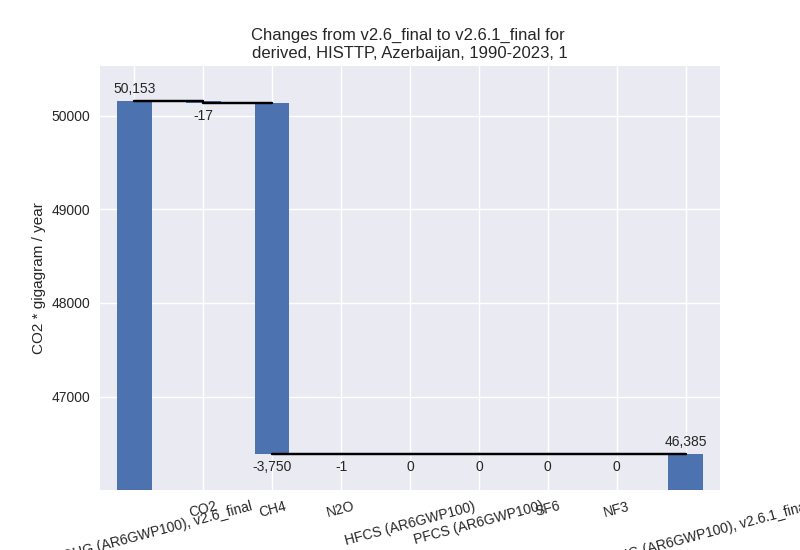
The changes come from the following subsectors:- 1.A: Total sectoral emissions in 2022 are 40076.85 Gg CO2 / year which is 88.4% of category 1 emissions. 2023 Emissions have changed by 0.0% (5.24 Gg CO2 / year). 1990-2023 Emissions have changed by 0.0% (2.25 Gg CO2 / year).
- 1.B.1: Total sectoral emissions in 2022 are 0.27 Gg
CO2 / year which is 0.0% of category 1 emissions. 2023 Emissions have
changed by -98.3% (-15.75 Gg CO2 /
year). 1990-2023 Emissions have changed by -94.2% (-24.35 Gg CO2 / year). For 2023
the changes per gas
are:
For 1990-2023 the changes per gas are: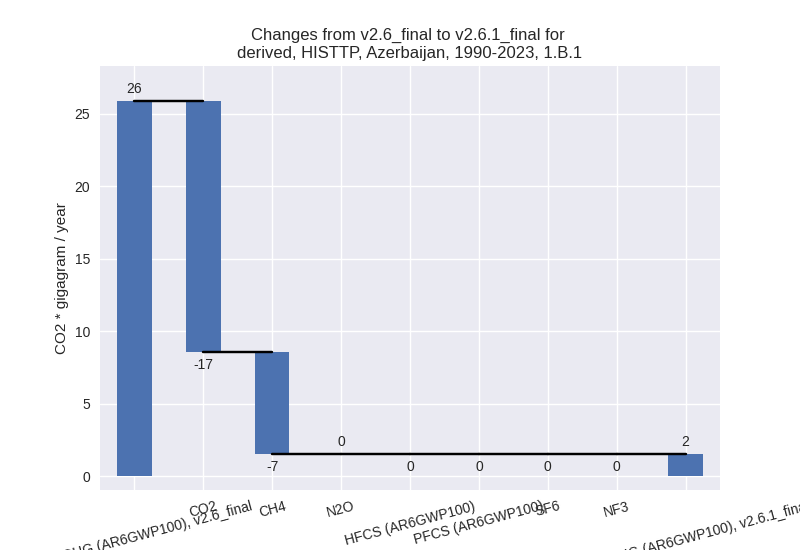
There is no subsector information available in PRIMAP-hist. - 1.B.2: Total sectoral emissions in 2022 are 5262.06
Gg CO2 / year which is 11.6% of category 1 emissions. 2023 Emissions
have changed by -66.2% (-11057.80 Gg
CO2 / year). 1990-2023 Emissions have changed by -25.3% (-3745.87 Gg CO2 / year). For 2023
the changes per gas
are:

For 1990-2023 the changes per gas are:
There is no subsector information available in PRIMAP-hist.
- 2: Total sectoral emissions in 2022 are 3377.22 Gg CO2 / year which is 5.7% of M.0.EL emissions. 2023 Emissions have changed by -0.9% (-32.40 Gg CO2 / year). 1990-2023 Emissions have changed by -0.3% (-5.11 Gg CO2 / year).
- M.AG: Total sectoral emissions in 2022 are 6884.15
Gg CO2 / year which is 11.7% of M.0.EL emissions. 2023 Emissions have
changed by -19.6% (-1681.72 Gg CO2 /
year). 1990-2023 Emissions have changed by -2.6% (-161.80 Gg CO2 / year). For 2023
the changes per gas
are:

For 1990-2023 the changes per gas are:
The changes come from the following subsectors:- 3.A: Total sectoral emissions in 2022 are 4182.43 Gg CO2 / year which is 60.8% of category M.AG emissions. 2023 Emissions have changed by -0.6% (-26.71 Gg CO2 / year). 1990-2023 Emissions have changed by -0.0% (-1.70 Gg CO2 / year).
- M.AG.ELV: Total sectoral emissions in 2022 are
2701.72 Gg CO2 / year which is 39.2% of category M.AG emissions. 2023
Emissions have changed by -37.5%
(-1655.01 Gg CO2 / year). 1990-2023 Emissions have changed by -6.3% (-160.10 Gg CO2 / year). For 2023
the changes per gas
are:
For 1990-2023 the changes per gas are: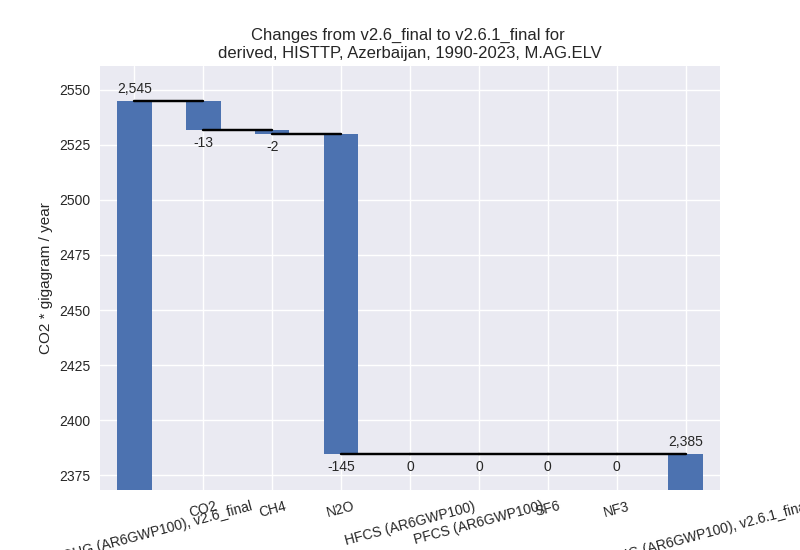
There is no subsector information available in PRIMAP-hist.
- 4: Total sectoral emissions in 2022 are 3104.22 Gg
CO2 / year which is 5.3% of M.0.EL emissions. 2023 Emissions have
changed by -23.8% (-980.99 Gg CO2 /
year). 1990-2023 Emissions have changed by -25.2% (-793.63 Gg CO2 / year). For 2023
the changes per gas
are:

For 1990-2023 the changes per gas are:
- 5: Total sectoral emissions in 2022 are 121.46 Gg
CO2 / year which is 0.2% of M.0.EL emissions. 2023 Emissions have
changed by -6.8% (-9.18 Gg CO2 /
year). 1990-2023 Emissions have changed by -6.4% (-8.30 Gg CO2 / year). For 2023 the
changes per gas
are:

For 1990-2023 the changes per gas are: