Changes in PRIMAP-hist v2.6.1_final compared to v2.6_final for Benin
2025-03-19
Johannes Gütschow
Change analysis for Benin for PRIMAP-hist v2.6.1_final compared to v2.6_final
Overview over emissions by sector and gas
The following figures show the aggregate national total emissions excluding LULUCF AR6GWP100 for the country reported priority scenario. The dotted linesshow the v2.6_final data.
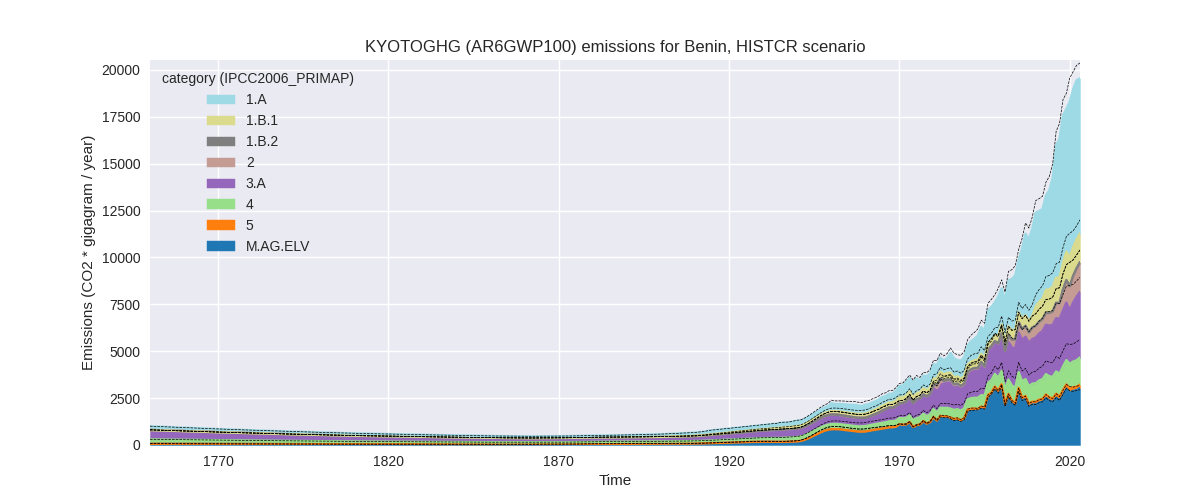
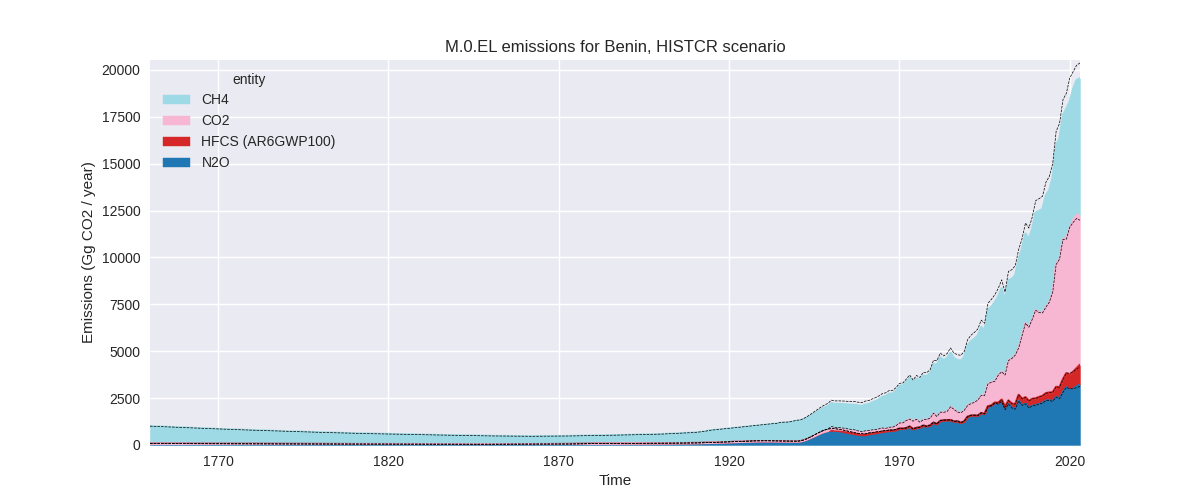
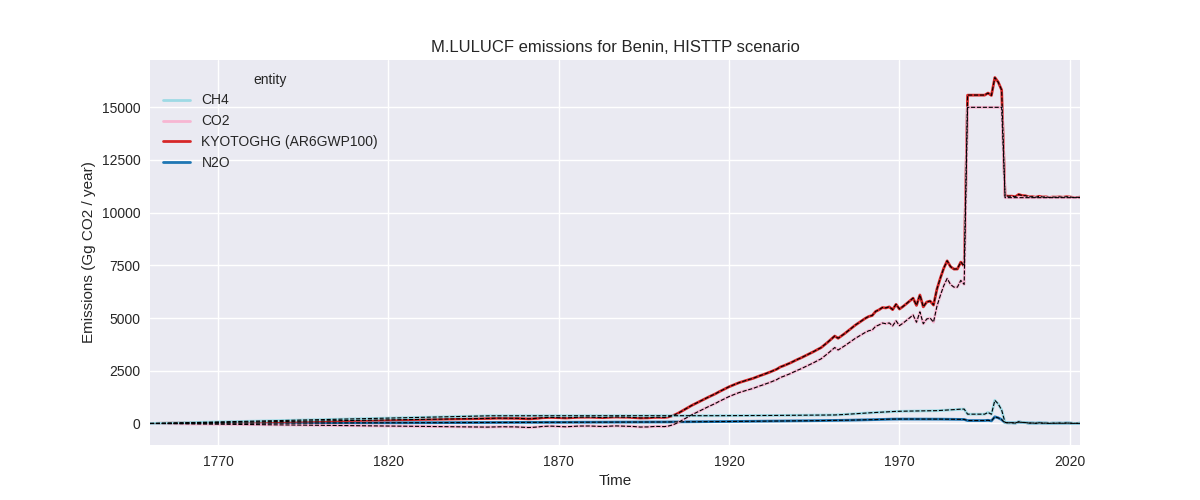
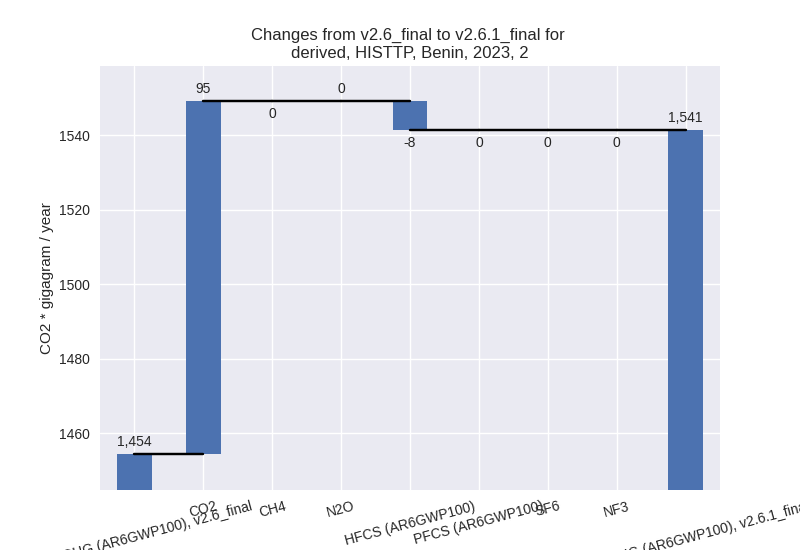
The following figures show the aggregate national total emissions excluding LULUCF AR6GWP100 for the third party priority scenario. The dotted linesshow the v2.6_final data.


Overview over changes
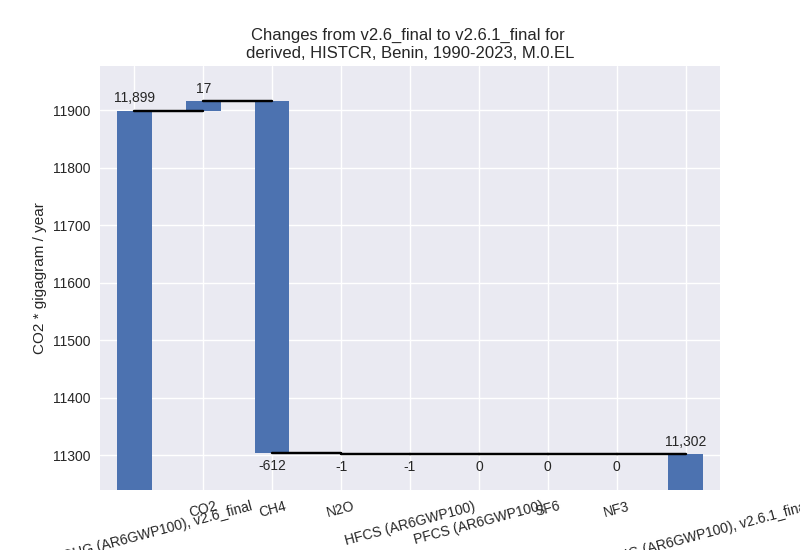
In the country reported priority scenario we have the following changes for aggregate Kyoto GHG and national total emissions excluding LULUCF (M.0.EL):
- Emissions in 2023 have changed by -4.0%% (-821.69 Gg CO2 / year)
- Emissions in 1990-2023 have changed by -5.0%% (-596.97 Gg CO2 / year)
In the third party priority scenario we have the following changes for aggregate Kyoto GHG and national total emissions excluding LULUCF (M.0.EL):
- Emissions in 2023 have changed by -4.0%% (-821.69 Gg CO2 / year)
- Emissions in 1990-2023 have changed by -5.0%% (-596.97 Gg CO2 / year)
Most important changes per scenario and time frame
In the country reported priority scenario the following sector-gas combinations have the highest absolute impact on national total KyotoGHG (AR6GWP100) emissions in 2023 (top 5):
- 1: 4, CH4 with -998.58 Gg CO2 / year (-43.6%)
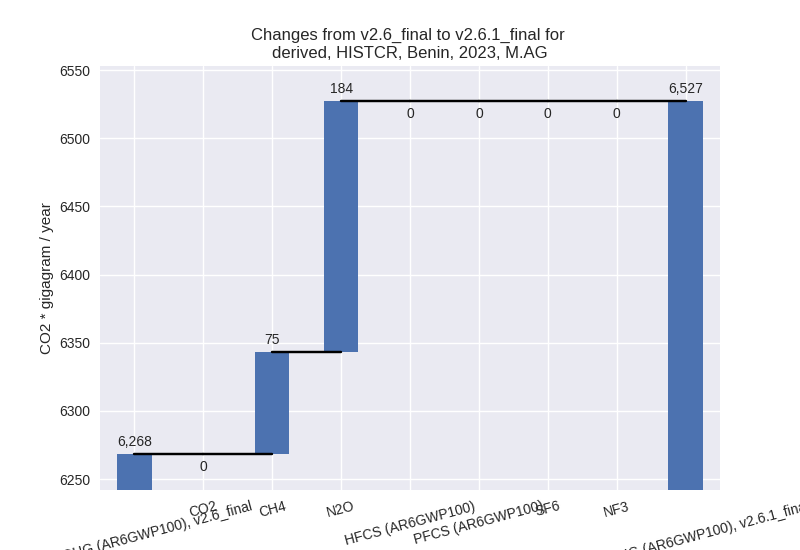
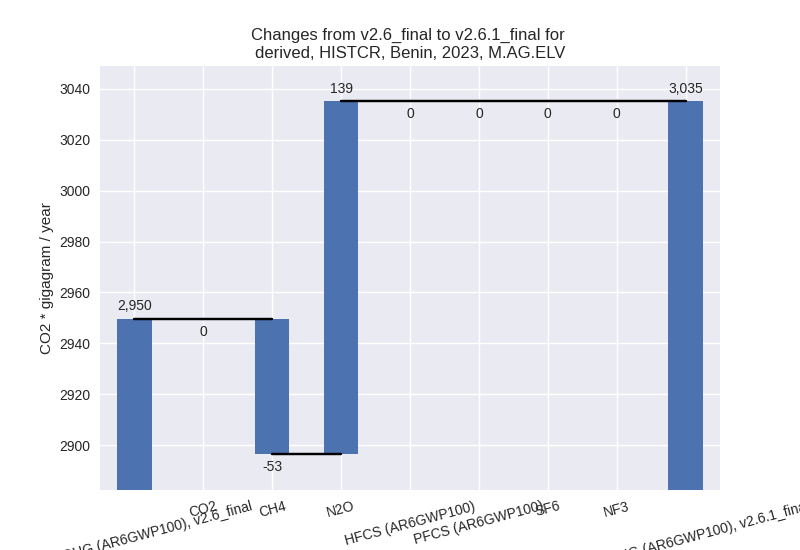
- 2: M.AG.ELV, N2O with 138.68 Gg CO2 / year (5.6%)
- 3: 3.A, CH4 with 127.92 Gg CO2 / year (4.0%)
- 4: 2, CO2 with 94.72 Gg CO2 / year (23.9%)
- 5: 1.B.1, CH4 with -88.72 Gg CO2 / year (-5.6%)
In the country reported priority scenario the following sector-gas combinations have the highest absolute impact on national total KyotoGHG (AR6GWP100) emissions in 1990-2023 (top 5):
- 1: 4, CH4 with -592.75 Gg CO2 / year (-41.6%)
- 2: 2, CO2 with 10.70 Gg CO2 / year (5.3%)
- 3: M.AG.ELV, CH4 with -6.07 Gg CO2 / year (-1.0%)
- 4: 1.B.2, CO2 with 6.07 Gg CO2 / year (7001.2%)
- 5: 3.A, CH4 with -4.24 Gg CO2 / year (-0.2%)
In the third party priority scenario the following sector-gas combinations have the highest absolute impact on national total KyotoGHG (AR6GWP100) emissions in 2023 (top 5):
- 1: 4, CH4 with -998.58 Gg CO2 / year (-43.6%)
- 2: M.AG.ELV, N2O with 138.68 Gg CO2 / year (5.6%)
- 3: 3.A, CH4 with 127.92 Gg CO2 / year (4.0%)
- 4: 2, CO2 with 94.72 Gg CO2 / year (23.9%)
- 5: 1.B.1, CH4 with -88.72 Gg CO2 / year (-5.6%)
In the third party priority scenario the following sector-gas combinations have the highest absolute impact on national total KyotoGHG (AR6GWP100) emissions in 1990-2023 (top 5):
- 1: 4, CH4 with -592.75 Gg CO2 / year (-41.6%)
- 2: 2, CO2 with 10.70 Gg CO2 / year (5.3%)
- 3: M.AG.ELV, CH4 with -6.07 Gg CO2 / year (-1.0%)
- 4: 1.B.2, CO2 with 6.07 Gg CO2 / year (7001.2%)
- 5: 3.A, CH4 with -4.24 Gg CO2 / year (-0.2%)
Notes on data changes
Here we list notes explaining important emissions changes for the country.
- We have no usable country reported data for Benin, thus CR and TP scenarios are identical.
- The main change is that Waste CH4 emissions are over 40% lower for 2023 and cumulative emissions because EDGAR emissions estimates are much lower. Other relevant but much smaller changes are in the agricultural sector (from FAO) and fugitive emissions (from EDGAR)
Changes by sector and gas
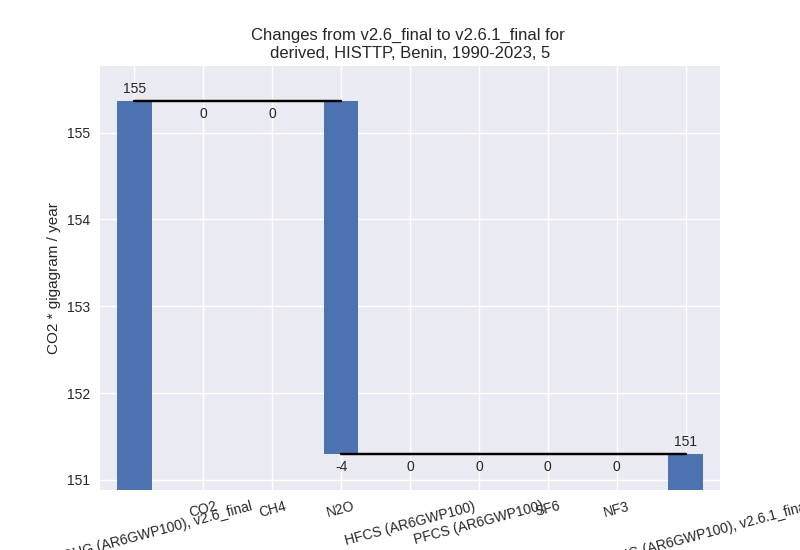
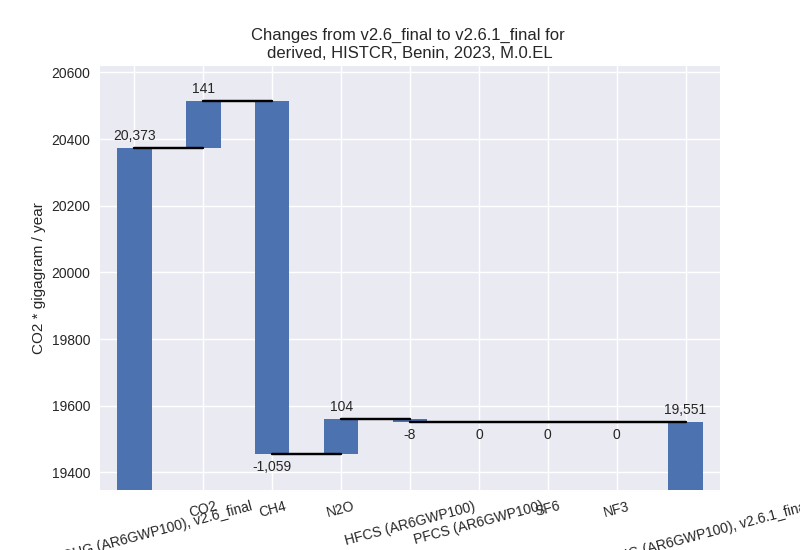
For each scenario and time frame the changes are displayed for all individual sectors and all individual gases. In the sector plot we use aggregate Kyoto GHGs in AR6GWP100. In the gas plot we usenational total emissions without LULUCF.
country reported scenario
2023
1990-2023
third party scenario
2023


1990-2023


Detailed changes for the scenarios:
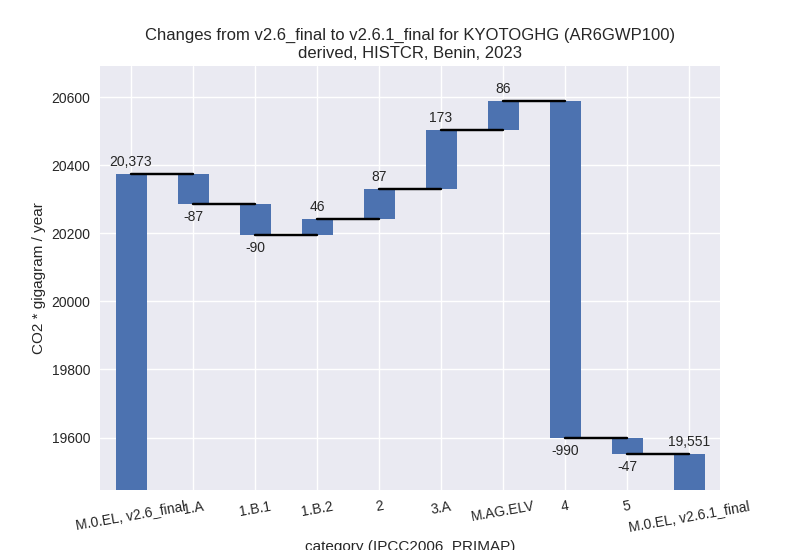
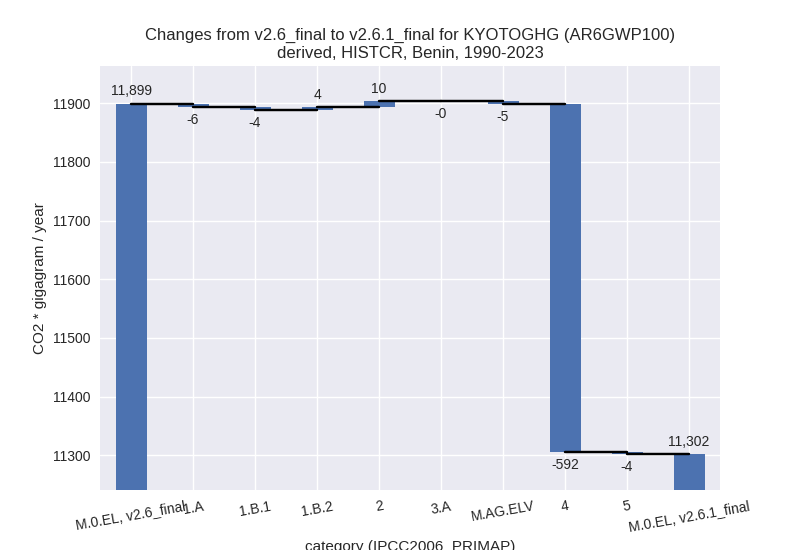
country reported scenario (HISTCR):
Most important changes per time frame
For 2023 the following sector-gas combinations have the highest absolute impact on national total KyotoGHG (AR6GWP100) emissions in 2023 (top 5):
- 1: 4, CH4 with -998.58 Gg CO2 / year (-43.6%)
- 2: M.AG.ELV, N2O with 138.68 Gg CO2 / year (5.6%)
- 3: 3.A, CH4 with 127.92 Gg CO2 / year (4.0%)
- 4: 2, CO2 with 94.72 Gg CO2 / year (23.9%)
- 5: 1.B.1, CH4 with -88.72 Gg CO2 / year (-5.6%)
For 1990-2023 the following sector-gas combinations have the highest absolute impact on national total KyotoGHG (AR6GWP100) emissions in 1990-2023 (top 5):
- 1: 4, CH4 with -592.75 Gg CO2 / year (-41.6%)
- 2: 2, CO2 with 10.70 Gg CO2 / year (5.3%)
- 3: M.AG.ELV, CH4 with -6.07 Gg CO2 / year (-1.0%)
- 4: 1.B.2, CO2 with 6.07 Gg CO2 / year (7001.2%)
- 5: 3.A, CH4 with -4.24 Gg CO2 / year (-0.2%)
Changes in the main sectors for aggregate KyotoGHG (AR6GWP100) are
- 1: Total sectoral emissions in 2022 are 10079.19 Gg CO2 / year which is 51.8% of M.0.EL emissions. 2023 Emissions have changed by -1.3% (-131.11 Gg CO2 / year). 1990-2023 Emissions have changed by -0.1% (-6.03 Gg CO2 / year).
- 2: Total sectoral emissions in 2022 are 1467.62 Gg
CO2 / year which is 7.5% of M.0.EL emissions. 2023 Emissions have
changed by 6.0% (87.00 Gg CO2 /
year). 1990-2023 Emissions have changed by 1.9% (10.15 Gg CO2 / year). For 2023 the
changes per gas
are:

- M.AG: Total sectoral emissions in 2022 are 6306.81
Gg CO2 / year which is 32.4% of M.0.EL emissions. 2023 Emissions have
changed by 4.1% (258.87 Gg CO2 /
year). 1990-2023 Emissions have changed by -0.1% (-5.30 Gg CO2 / year). For 2023 the
changes per gas
are:
The changes come from the following subsectors:- 3.A: Total sectoral emissions in 2022 are 3390.84
Gg CO2 / year which is 53.8% of category M.AG emissions. 2023 Emissions
have changed by 5.2% (173.33 Gg CO2
/ year). 1990-2023 Emissions have changed by -0.0% (-0.25 Gg CO2 / year). For 2023 the
changes per gas
are:

There is no subsector information available in PRIMAP-hist. - M.AG.ELV: Total sectoral emissions in 2022 are
2915.97 Gg CO2 / year which is 46.2% of category M.AG emissions. 2023
Emissions have changed by 2.9%
(85.54 Gg CO2 / year). 1990-2023 Emissions have changed by -0.2% (-5.05 Gg CO2 / year). For 2023 the
changes per gas
are:
There is no subsector information available in PRIMAP-hist.
- 3.A: Total sectoral emissions in 2022 are 3390.84
Gg CO2 / year which is 53.8% of category M.AG emissions. 2023 Emissions
have changed by 5.2% (173.33 Gg CO2
/ year). 1990-2023 Emissions have changed by -0.0% (-0.25 Gg CO2 / year). For 2023 the
changes per gas
are:
- 4: Total sectoral emissions in 2022 are 1410.70 Gg
CO2 / year which is 7.3% of M.0.EL emissions. 2023 Emissions have
changed by -40.6% (-989.74 Gg CO2 /
year). 1990-2023 Emissions have changed by -39.0% (-591.72 Gg CO2 / year). For 2023
the changes per gas
are:

For 1990-2023 the changes per gas are:
- 5: Total sectoral emissions in 2022 are 185.87 Gg
CO2 / year which is 1.0% of M.0.EL emissions. 2023 Emissions have
changed by -20.2% (-46.70 Gg CO2 /
year). 1990-2023 Emissions have changed by -2.6% (-4.07 Gg CO2 / year). For 2023 the
changes per gas
are:

For 1990-2023 the changes per gas are:
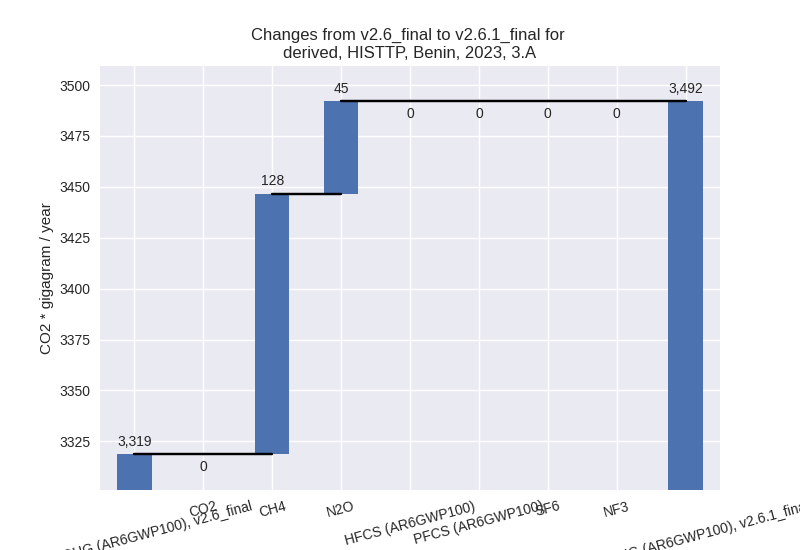
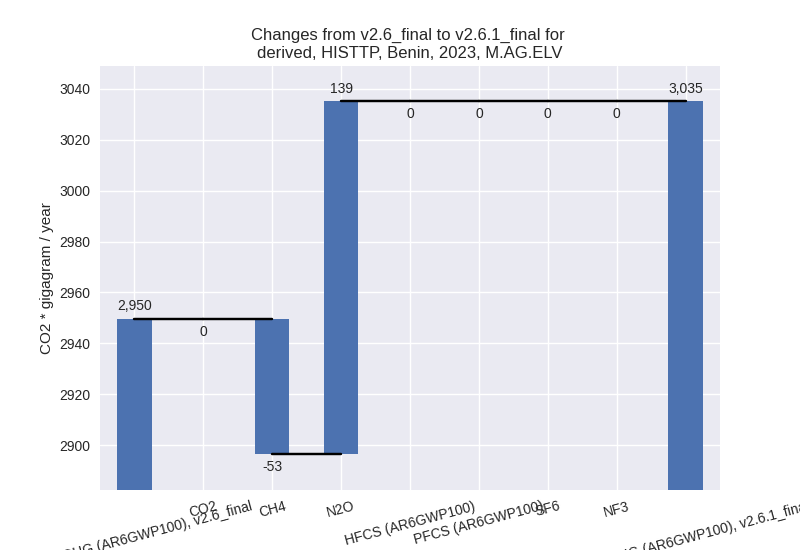
third party scenario (HISTTP):
Most important changes per time frame
For 2023 the following sector-gas combinations have the highest absolute impact on national total KyotoGHG (AR6GWP100) emissions in 2023 (top 5):
- 1: 4, CH4 with -998.58 Gg CO2 / year (-43.6%)
- 2: M.AG.ELV, N2O with 138.68 Gg CO2 / year (5.6%)
- 3: 3.A, CH4 with 127.92 Gg CO2 / year (4.0%)
- 4: 2, CO2 with 94.72 Gg CO2 / year (23.9%)
- 5: 1.B.1, CH4 with -88.72 Gg CO2 / year (-5.6%)
For 1990-2023 the following sector-gas combinations have the highest absolute impact on national total KyotoGHG (AR6GWP100) emissions in 1990-2023 (top 5):
- 1: 4, CH4 with -592.75 Gg CO2 / year (-41.6%)
- 2: 2, CO2 with 10.70 Gg CO2 / year (5.3%)
- 3: M.AG.ELV, CH4 with -6.07 Gg CO2 / year (-1.0%)
- 4: 1.B.2, CO2 with 6.07 Gg CO2 / year (7001.2%)
- 5: 3.A, CH4 with -4.24 Gg CO2 / year (-0.2%)
Changes in the main sectors for aggregate KyotoGHG (AR6GWP100) are
- 1: Total sectoral emissions in 2022 are 10079.19 Gg CO2 / year which is 51.8% of M.0.EL emissions. 2023 Emissions have changed by -1.3% (-131.11 Gg CO2 / year). 1990-2023 Emissions have changed by -0.1% (-6.03 Gg CO2 / year).
- 2: Total sectoral emissions in 2022 are 1467.62 Gg
CO2 / year which is 7.5% of M.0.EL emissions. 2023 Emissions have
changed by 6.0% (87.00 Gg CO2 /
year). 1990-2023 Emissions have changed by 1.9% (10.15 Gg CO2 / year). For 2023 the
changes per gas
are:
- M.AG: Total sectoral emissions in 2022 are 6306.81
Gg CO2 / year which is 32.4% of M.0.EL emissions. 2023 Emissions have
changed by 4.1% (258.87 Gg CO2 /
year). 1990-2023 Emissions have changed by -0.1% (-5.30 Gg CO2 / year). For 2023 the
changes per gas
are:

The changes come from the following subsectors:- 3.A: Total sectoral emissions in 2022 are 3390.84
Gg CO2 / year which is 53.8% of category M.AG emissions. 2023 Emissions
have changed by 5.2% (173.33 Gg CO2
/ year). 1990-2023 Emissions have changed by -0.0% (-0.25 Gg CO2 / year). For 2023 the
changes per gas
are:
There is no subsector information available in PRIMAP-hist. - M.AG.ELV: Total sectoral emissions in 2022 are
2915.97 Gg CO2 / year which is 46.2% of category M.AG emissions. 2023
Emissions have changed by 2.9%
(85.54 Gg CO2 / year). 1990-2023 Emissions have changed by -0.2% (-5.05 Gg CO2 / year). For 2023 the
changes per gas
are:
There is no subsector information available in PRIMAP-hist.
- 3.A: Total sectoral emissions in 2022 are 3390.84
Gg CO2 / year which is 53.8% of category M.AG emissions. 2023 Emissions
have changed by 5.2% (173.33 Gg CO2
/ year). 1990-2023 Emissions have changed by -0.0% (-0.25 Gg CO2 / year). For 2023 the
changes per gas
are:
- 4: Total sectoral emissions in 2022 are 1410.70 Gg
CO2 / year which is 7.3% of M.0.EL emissions. 2023 Emissions have
changed by -40.6% (-989.74 Gg CO2 /
year). 1990-2023 Emissions have changed by -39.0% (-591.72 Gg CO2 / year). For 2023
the changes per gas
are:

For 1990-2023 the changes per gas are: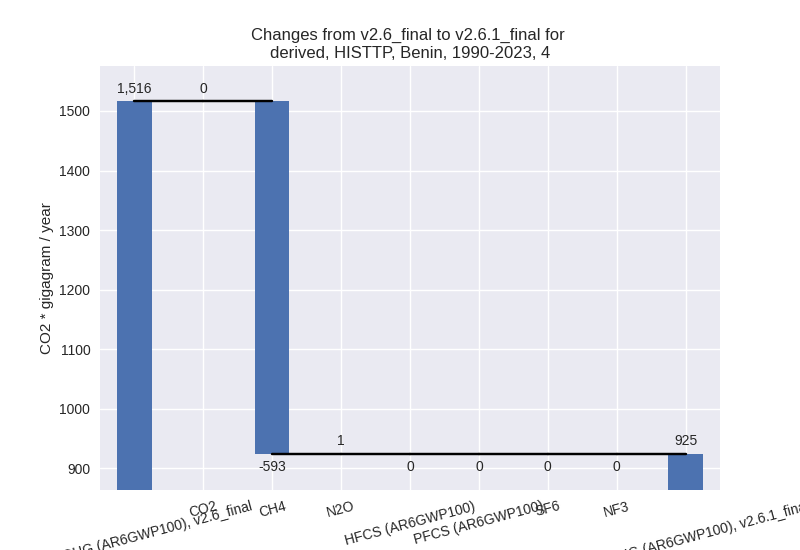
- 5: Total sectoral emissions in 2022 are 185.87 Gg
CO2 / year which is 1.0% of M.0.EL emissions. 2023 Emissions have
changed by -20.2% (-46.70 Gg CO2 /
year). 1990-2023 Emissions have changed by -2.6% (-4.07 Gg CO2 / year). For 2023 the
changes per gas
are:

For 1990-2023 the changes per gas are: