Changes in PRIMAP-hist v2.6.1_final compared to v2.6_final for Bahrain
2025-03-19
Johannes Gütschow
Change analysis for Bahrain for PRIMAP-hist v2.6.1_final compared to v2.6_final
Overview over emissions by sector and gas
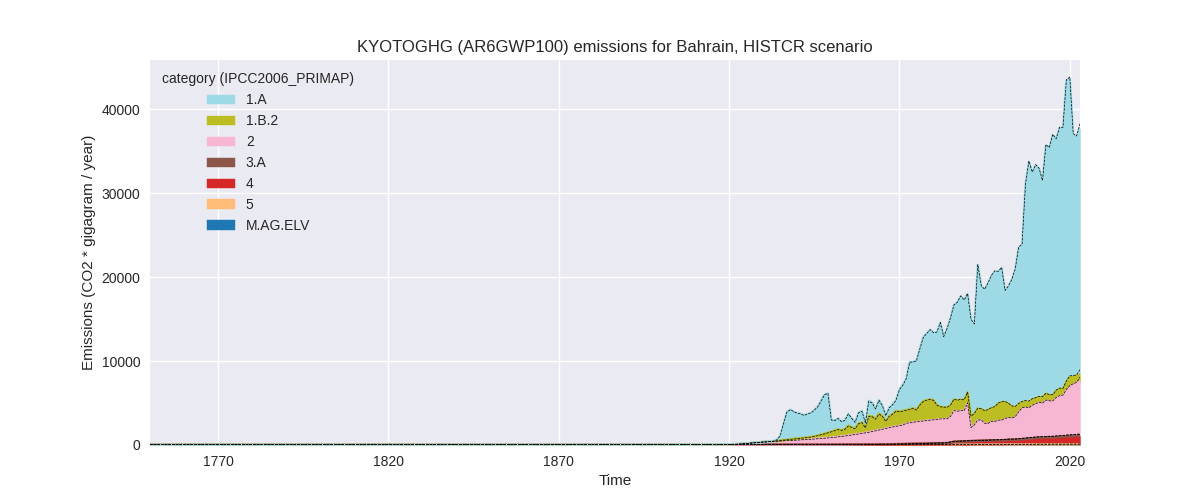
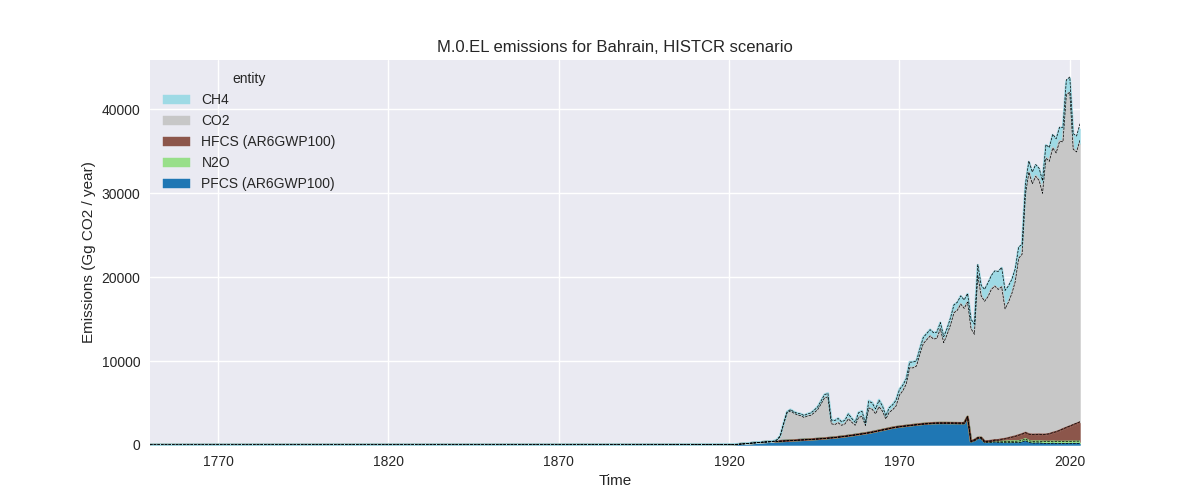
The following figures show the aggregate national total emissions excluding LULUCF AR6GWP100 for the country reported priority scenario. The dotted linesshow the v2.6_final data.
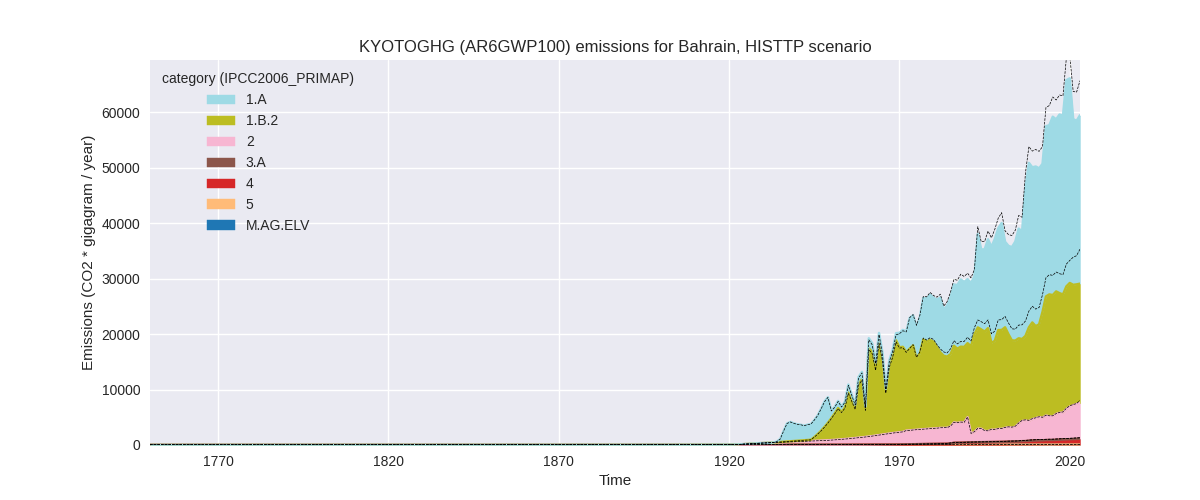
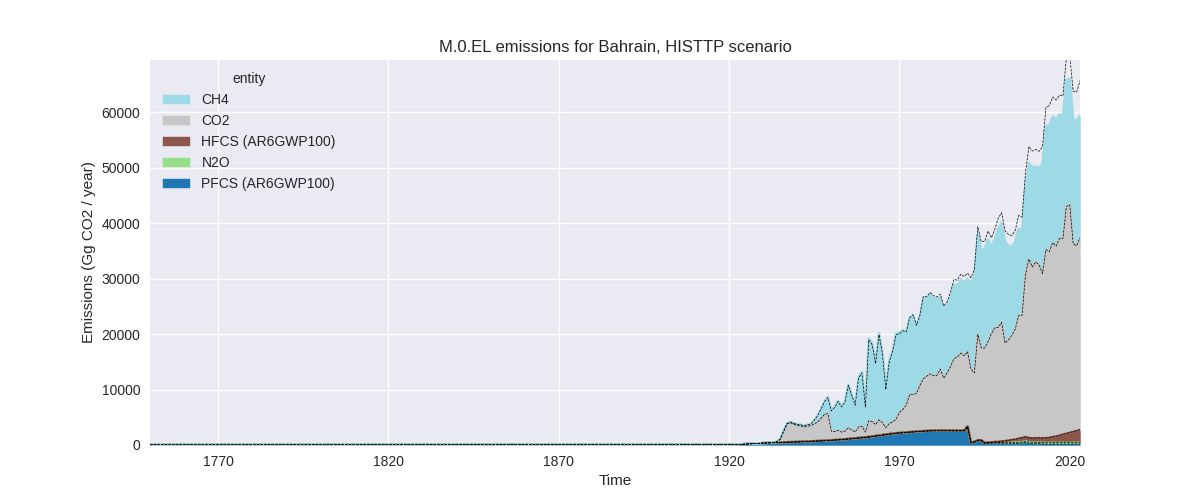
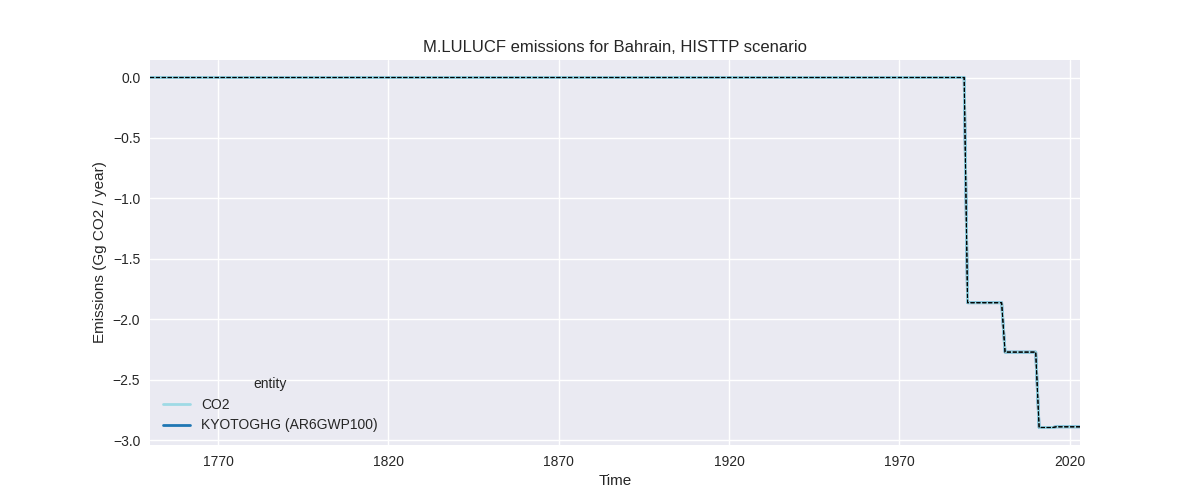
The following figures show the aggregate national total emissions excluding LULUCF AR6GWP100 for the third party priority scenario. The dotted linesshow the v2.6_final data.
Overview over changes
In the country reported priority scenario we have the following changes for aggregate Kyoto GHG and national total emissions excluding LULUCF (M.0.EL):
- Emissions in 2023 have changed by -1.4%% (-550.36 Gg CO2 / year)
- Emissions in 1990-2023 have changed by -0.4%% (-101.11 Gg CO2 / year)
In the third party priority scenario we have the following changes for aggregate Kyoto GHG and national total emissions excluding LULUCF (M.0.EL):
- Emissions in 2023 have changed by -9.5%% (-6227.67 Gg CO2 / year)
- Emissions in 1990-2023 have changed by -5.6%% (-2715.22 Gg CO2 / year)
Most important changes per scenario and time frame
In the country reported priority scenario the following sector-gas combinations have the highest absolute impact on national total KyotoGHG (AR6GWP100) emissions in 2023 (top 5):
- 1: 2, CO2 with -264.99 Gg CO2 / year (-6.4%)
- 2: 4, CH4 with -147.38 Gg CO2 / year (-12.9%)
- 3: 1.B.2, CH4 with -55.05 Gg CO2 / year (-7.9%)
- 4: 5, N2O with -34.56 Gg CO2 / year (-34.0%)
- 5: 4, N2O with -18.09 Gg CO2 / year (-65.9%)
In the country reported priority scenario the following sector-gas combinations have the highest absolute impact on national total KyotoGHG (AR6GWP100) emissions in 1990-2023 (top 5):
- 1: 4, CH4 with -87.16 Gg CO2 / year (-12.0%)
- 2: 5, N2O with -23.67 Gg CO2 / year (-32.8%)
- 3: 2, CO2 with 20.70 Gg CO2 / year (0.9%)
- 4: 4, N2O with -6.26 Gg CO2 / year (-43.5%)
- 5: 1.B.2, CH4 with -2.80 Gg CO2 / year (-0.4%)
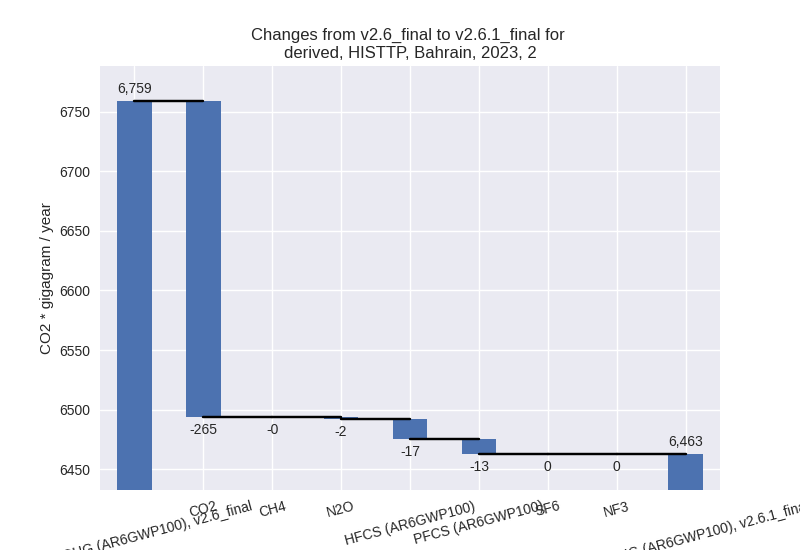
In the third party priority scenario the following sector-gas combinations have the highest absolute impact on national total KyotoGHG (AR6GWP100) emissions in 2023 (top 5):
- 1: 1.B.2, CH4 with -5731.69 Gg CO2 / year (-21.2%)
- 2: 2, CO2 with -264.99 Gg CO2 / year (-6.4%)
- 3: 4, CH4 with -147.38 Gg CO2 / year (-12.9%)
- 4: 5, N2O with -34.56 Gg CO2 / year (-34.0%)
- 5: 4, N2O with -18.09 Gg CO2 / year (-65.9%)
In the third party priority scenario the following sector-gas combinations have the highest absolute impact on national total KyotoGHG (AR6GWP100) emissions in 1990-2023 (top 5):
- 1: 1.B.2, CH4 with -2616.93 Gg CO2 / year (-12.7%)
- 2: 4, CH4 with -87.16 Gg CO2 / year (-12.0%)
- 3: 5, N2O with -23.67 Gg CO2 / year (-32.8%)
- 4: 2, CO2 with 20.70 Gg CO2 / year (0.9%)
- 5: 4, N2O with -6.26 Gg CO2 / year (-43.5%)
Notes on data changes
Here we list notes explaining important emissions changes for the country.
- There is no new country reported data for Bahrain available. Overall changes in the CR time-series are small and in sectors with relatively low emissions. In sectors 4 and 5 there is no country reported data and thus Changes in EDGAR data also affect the CR Scenario for all years.
- TP scenario emissions are lower for 2023 and cumulatively. The by far highest contribution is from CH4 in 1.B.2 which is a very important sector for Bahrain (in the CR scenario, country reported emissions are low). The reason for the lower emissions is that EDGAR data is lower in the new version.
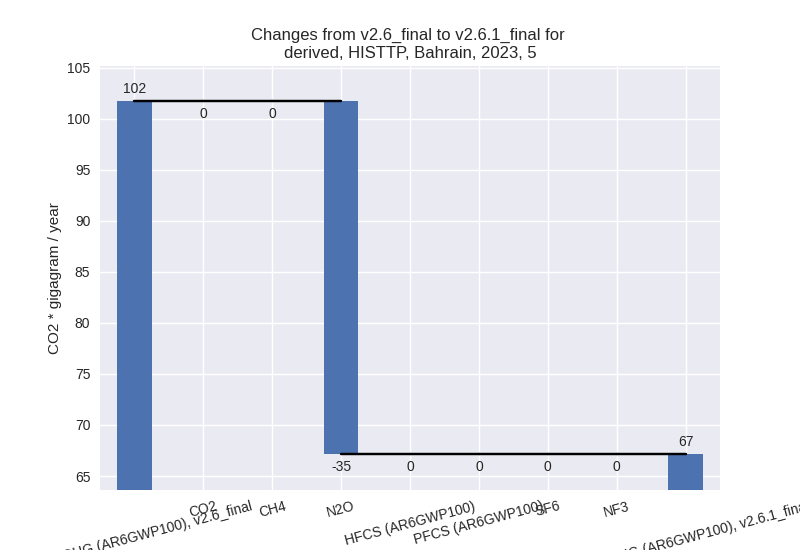
Changes by sector and gas
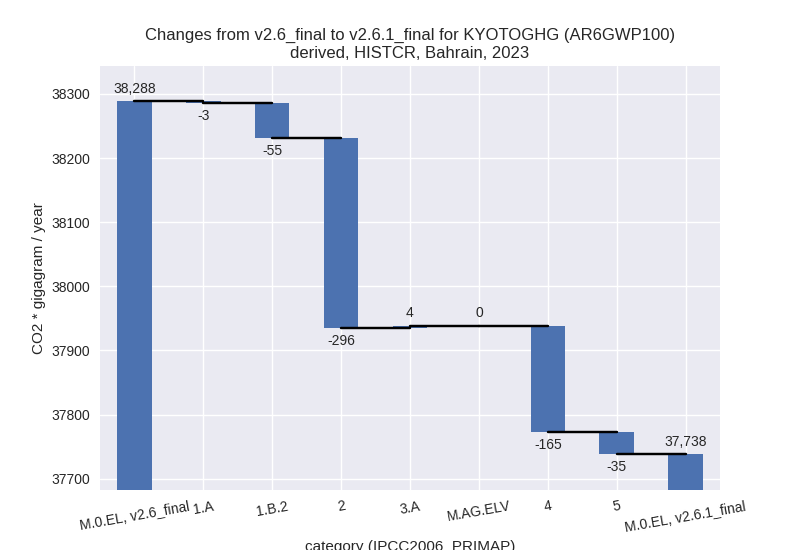
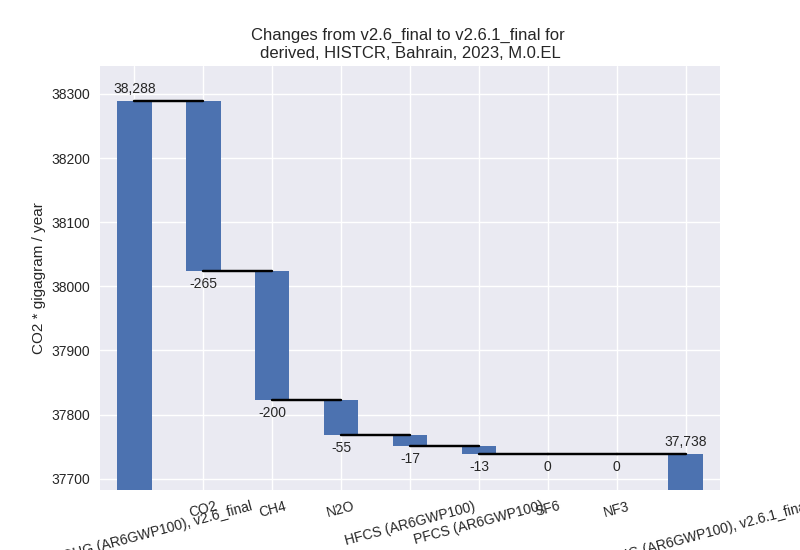
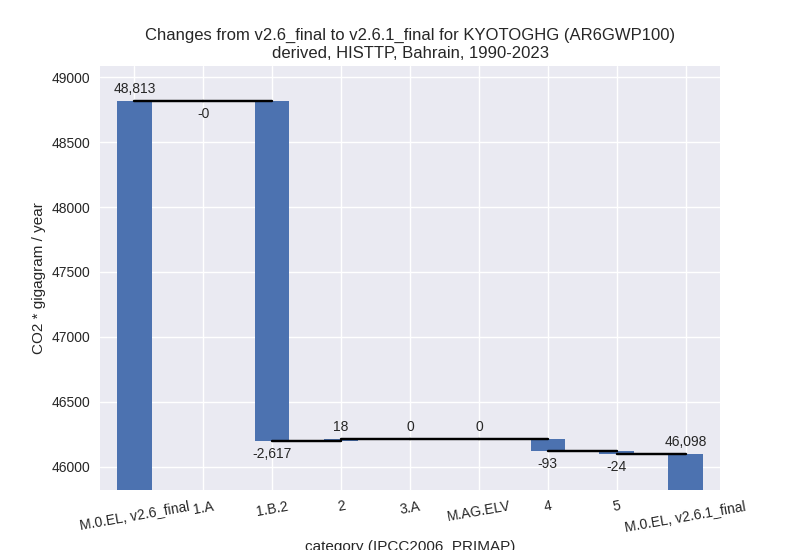
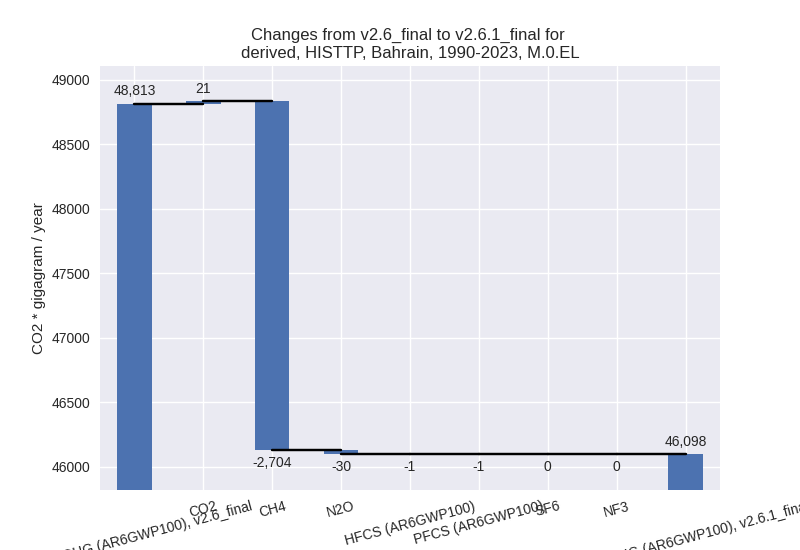
For each scenario and time frame the changes are displayed for all individual sectors and all individual gases. In the sector plot we use aggregate Kyoto GHGs in AR6GWP100. In the gas plot we usenational total emissions without LULUCF.
country reported scenario
2023
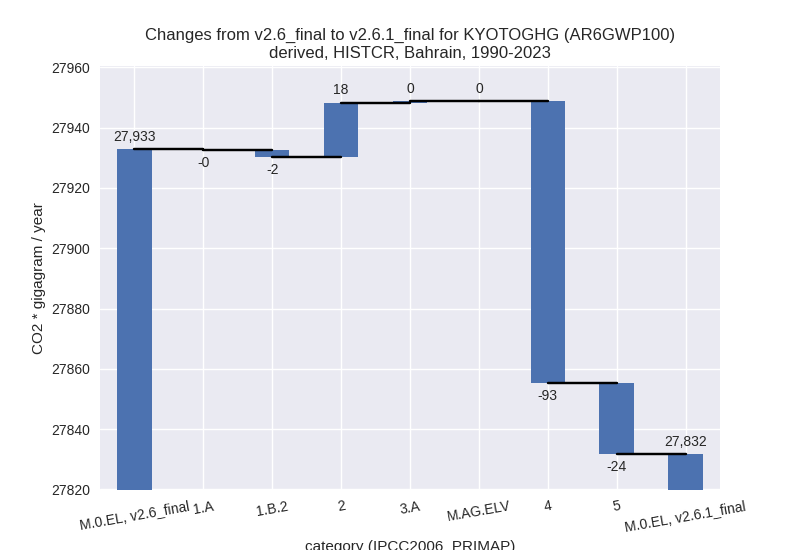
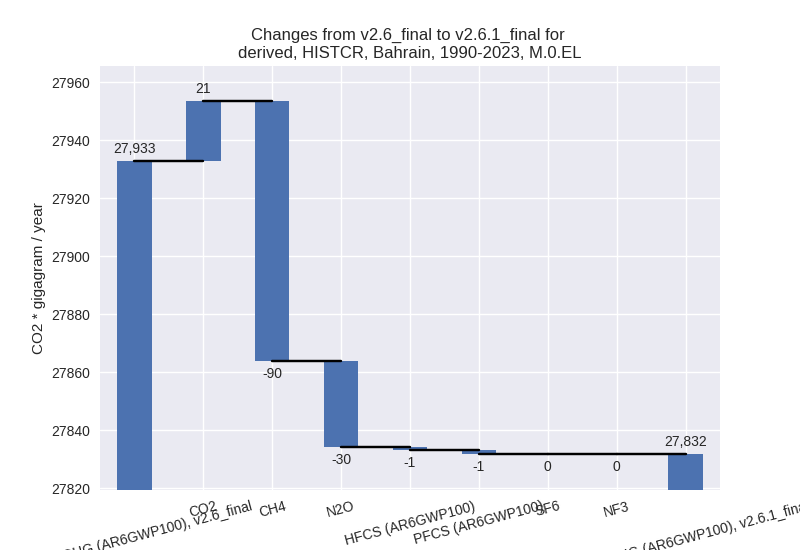
1990-2023
third party scenario
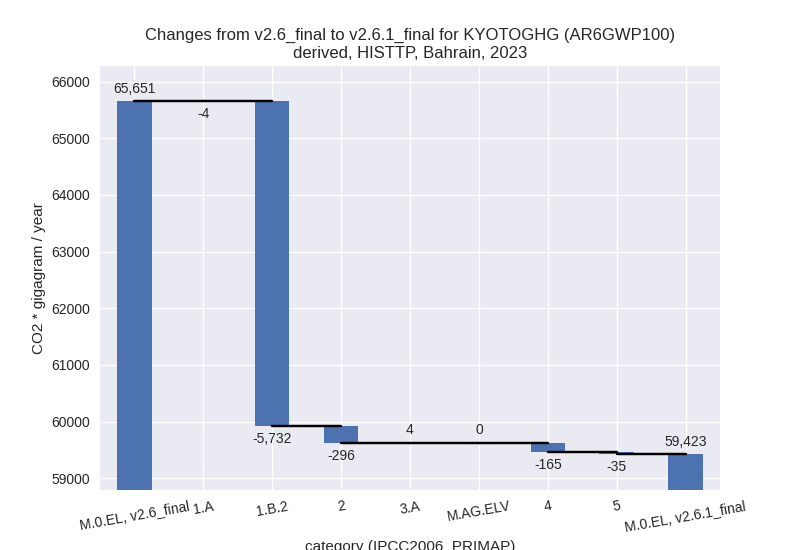
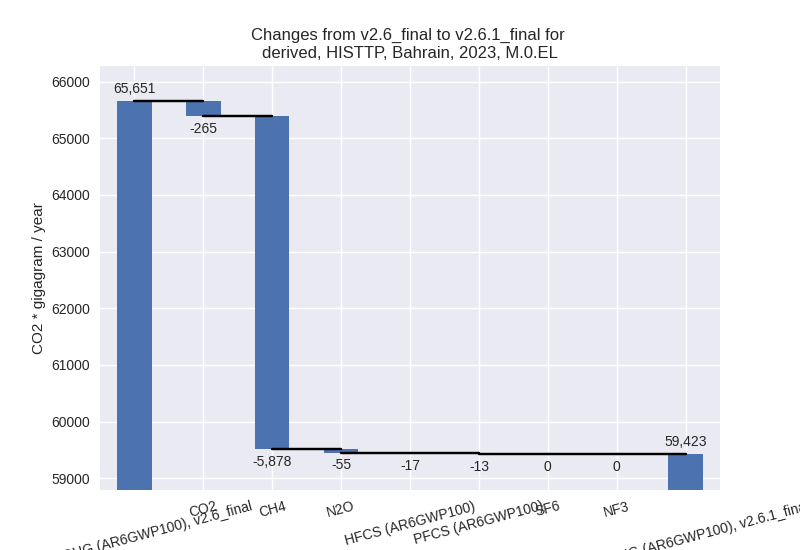
2023
1990-2023
Detailed changes for the scenarios:
country reported scenario (HISTCR):
Most important changes per time frame
For 2023 the following sector-gas combinations have the highest absolute impact on national total KyotoGHG (AR6GWP100) emissions in 2023 (top 5):
- 1: 2, CO2 with -264.99 Gg CO2 / year (-6.4%)
- 2: 4, CH4 with -147.38 Gg CO2 / year (-12.9%)
- 3: 1.B.2, CH4 with -55.05 Gg CO2 / year (-7.9%)
- 4: 5, N2O with -34.56 Gg CO2 / year (-34.0%)
- 5: 4, N2O with -18.09 Gg CO2 / year (-65.9%)
For 1990-2023 the following sector-gas combinations have the highest absolute impact on national total KyotoGHG (AR6GWP100) emissions in 1990-2023 (top 5):
- 1: 4, CH4 with -87.16 Gg CO2 / year (-12.0%)
- 2: 5, N2O with -23.67 Gg CO2 / year (-32.8%)
- 3: 2, CO2 with 20.70 Gg CO2 / year (0.9%)
- 4: 4, N2O with -6.26 Gg CO2 / year (-43.5%)
- 5: 1.B.2, CH4 with -2.80 Gg CO2 / year (-0.4%)
Changes in the main sectors for aggregate KyotoGHG (AR6GWP100) are
- 1: Total sectoral emissions in 2022 are 29315.46 Gg CO2 / year which is 79.9% of M.0.EL emissions. 2023 Emissions have changed by -0.2% (-57.82 Gg CO2 / year). 1990-2023 Emissions have changed by -0.0% (-2.66 Gg CO2 / year).
- 2: Total sectoral emissions in 2022 are 6290.52 Gg
CO2 / year which is 17.1% of M.0.EL emissions. 2023 Emissions have
changed by -4.4% (-296.24 Gg CO2 /
year). 1990-2023 Emissions have changed by 0.5% (18.12 Gg CO2 / year). For 2023 the
changes per gas
are:

- M.AG: Total sectoral emissions in 2022 are 45.21 Gg
CO2 / year which is 0.1% of M.0.EL emissions. 2023 Emissions have
changed by 8.8% (3.72 Gg CO2 /
year). 1990-2023 Emissions have changed by 1.3% (0.53 Gg CO2 / year). For 2023 the
changes per gas
are:
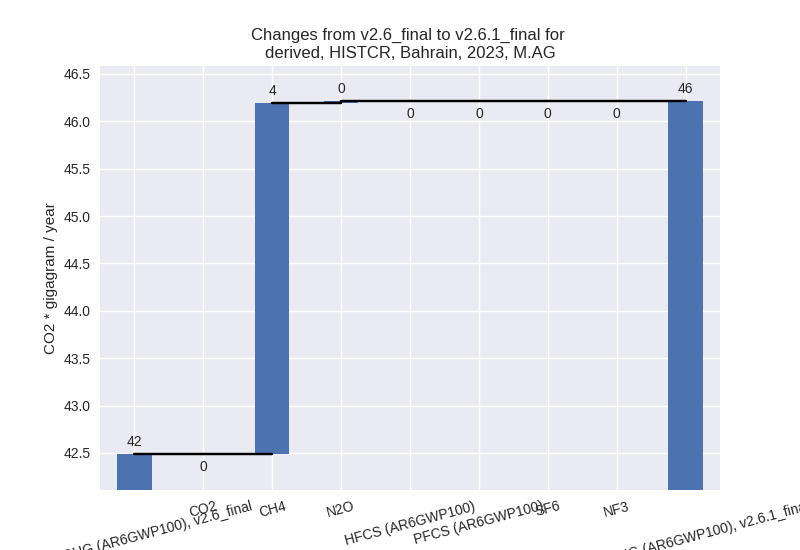
The changes come from the following subsectors:- 3.A: Total sectoral emissions in 2022 are 26.87 Gg
CO2 / year which is 59.4% of category M.AG emissions. 2023 Emissions
have changed by 15.5% (3.70 Gg CO2 /
year). 1990-2023 Emissions have changed by 2.2% (0.49 Gg CO2 / year). For 2023 the
changes per gas
are:

For 1990-2023 the changes per gas are:
There is no subsector information available in PRIMAP-hist. - M.AG.ELV: Total sectoral emissions in 2022 are 18.35 Gg CO2 / year which is 40.6% of category M.AG emissions. 2023 Emissions have changed by 0.1% (0.03 Gg CO2 / year). 1990-2023 Emissions have changed by 0.2% (0.04 Gg CO2 / year).
- 3.A: Total sectoral emissions in 2022 are 26.87 Gg
CO2 / year which is 59.4% of category M.AG emissions. 2023 Emissions
have changed by 15.5% (3.70 Gg CO2 /
year). 1990-2023 Emissions have changed by 2.2% (0.49 Gg CO2 / year). For 2023 the
changes per gas
are:
- 4: Total sectoral emissions in 2022 are 981.10 Gg
CO2 / year which is 2.7% of M.0.EL emissions. 2023 Emissions have
changed by -14.1% (-165.46 Gg CO2 /
year). 1990-2023 Emissions have changed by -12.6% (-93.42 Gg CO2 / year). For 2023
the changes per gas
are:
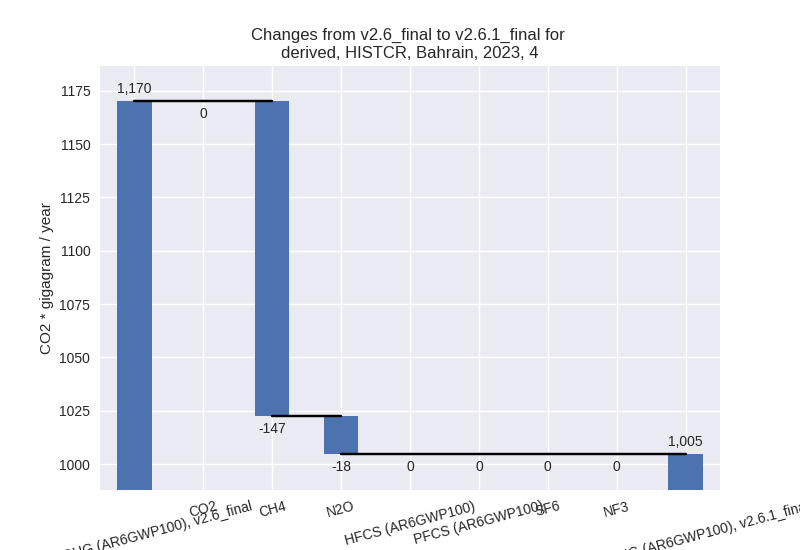
For 1990-2023 the changes per gas are:
- 5: Total sectoral emissions in 2022 are 65.50 Gg
CO2 / year which is 0.2% of M.0.EL emissions. 2023 Emissions have
changed by -34.0% (-34.56 Gg CO2 /
year). 1990-2023 Emissions have changed by -32.8% (-23.67 Gg CO2 / year). For 2023
the changes per gas
are:

For 1990-2023 the changes per gas are:
third party scenario (HISTTP):
Most important changes per time frame
For 2023 the following sector-gas combinations have the highest absolute impact on national total KyotoGHG (AR6GWP100) emissions in 2023 (top 5):
- 1: 1.B.2, CH4 with -5731.69 Gg CO2 / year (-21.2%)
- 2: 2, CO2 with -264.99 Gg CO2 / year (-6.4%)
- 3: 4, CH4 with -147.38 Gg CO2 / year (-12.9%)
- 4: 5, N2O with -34.56 Gg CO2 / year (-34.0%)
- 5: 4, N2O with -18.09 Gg CO2 / year (-65.9%)
For 1990-2023 the following sector-gas combinations have the highest absolute impact on national total KyotoGHG (AR6GWP100) emissions in 1990-2023 (top 5):
- 1: 1.B.2, CH4 with -2616.93 Gg CO2 / year (-12.7%)
- 2: 4, CH4 with -87.16 Gg CO2 / year (-12.0%)
- 3: 5, N2O with -23.67 Gg CO2 / year (-32.8%)
- 4: 2, CO2 with 20.70 Gg CO2 / year (0.9%)
- 5: 4, N2O with -6.26 Gg CO2 / year (-43.5%)
Changes in the main sectors for aggregate KyotoGHG (AR6GWP100) are
- 1: Total sectoral emissions in 2022 are 51036.79 Gg
CO2 / year which is 87.4% of M.0.EL emissions. 2023 Emissions have
changed by -10.0% (-5735.13 Gg CO2 /
year). 1990-2023 Emissions have changed by -5.9% (-2616.77 Gg CO2 / year). For 2023
the changes per gas
are:

For 1990-2023 the changes per gas are: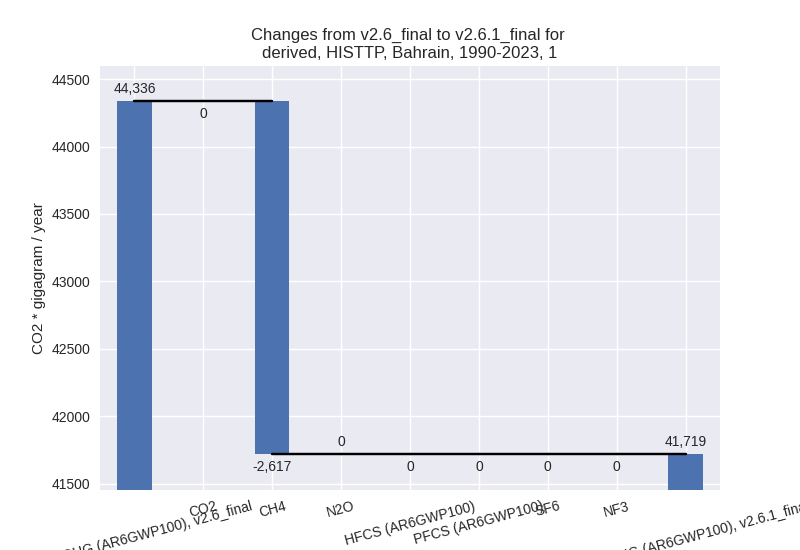
The changes come from the following subsectors:- 1.A: Total sectoral emissions in 2022 are 29472.00 Gg CO2 / year which is 57.7% of category 1 emissions. 2023 Emissions have changed by -0.0% (-3.54 Gg CO2 / year). 1990-2023 Emissions have changed by -0.0% (-0.22 Gg CO2 / year).
- 1.B.2: Total sectoral emissions in 2022 are
21564.79 Gg CO2 / year which is 42.3% of category 1 emissions. 2023
Emissions have changed by -21.1%
(-5731.58 Gg CO2 / year). 1990-2023 Emissions have changed by -12.5% (-2616.55 Gg CO2 / year). For 2023
the changes per gas
are:

For 1990-2023 the changes per gas are:
There is no subsector information available in PRIMAP-hist.
- 2: Total sectoral emissions in 2022 are 6290.52 Gg
CO2 / year which is 10.8% of M.0.EL emissions. 2023 Emissions have
changed by -4.4% (-296.24 Gg CO2 /
year). 1990-2023 Emissions have changed by 0.5% (18.12 Gg CO2 / year). For 2023 the
changes per gas
are:
- M.AG: Total sectoral emissions in 2022 are 45.21 Gg
CO2 / year which is 0.1% of M.0.EL emissions. 2023 Emissions have
changed by 8.8% (3.72 Gg CO2 /
year). 1990-2023 Emissions have changed by 1.3% (0.53 Gg CO2 / year). For 2023 the
changes per gas
are:

The changes come from the following subsectors:- 3.A: Total sectoral emissions in 2022 are 26.87 Gg
CO2 / year which is 59.4% of category M.AG emissions. 2023 Emissions
have changed by 15.5% (3.70 Gg CO2 /
year). 1990-2023 Emissions have changed by 2.2% (0.49 Gg CO2 / year). For 2023 the
changes per gas
are:
For 1990-2023 the changes per gas are:
There is no subsector information available in PRIMAP-hist. - M.AG.ELV: Total sectoral emissions in 2022 are 18.35 Gg CO2 / year which is 40.6% of category M.AG emissions. 2023 Emissions have changed by 0.1% (0.03 Gg CO2 / year). 1990-2023 Emissions have changed by 0.2% (0.04 Gg CO2 / year).
- 3.A: Total sectoral emissions in 2022 are 26.87 Gg
CO2 / year which is 59.4% of category M.AG emissions. 2023 Emissions
have changed by 15.5% (3.70 Gg CO2 /
year). 1990-2023 Emissions have changed by 2.2% (0.49 Gg CO2 / year). For 2023 the
changes per gas
are:
- 4: Total sectoral emissions in 2022 are 981.10 Gg
CO2 / year which is 1.7% of M.0.EL emissions. 2023 Emissions have
changed by -14.1% (-165.46 Gg CO2 /
year). 1990-2023 Emissions have changed by -12.6% (-93.42 Gg CO2 / year). For 2023
the changes per gas
are:

For 1990-2023 the changes per gas are: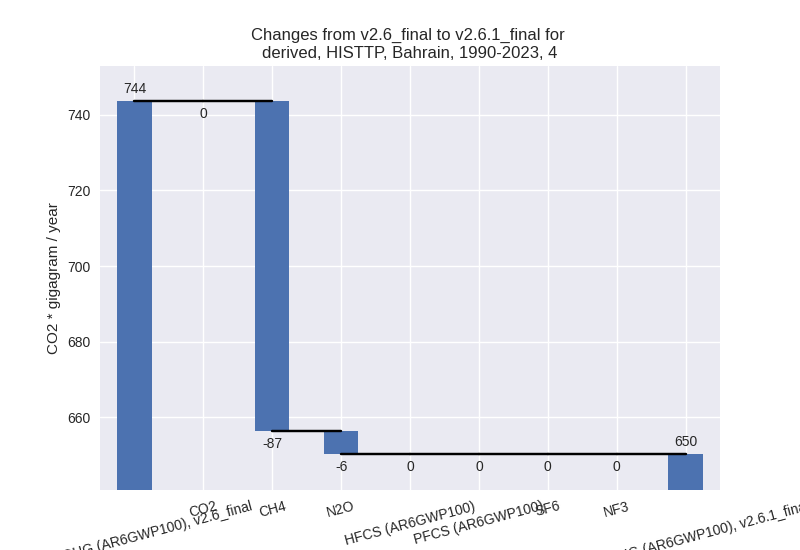
- 5: Total sectoral emissions in 2022 are 65.50 Gg
CO2 / year which is 0.1% of M.0.EL emissions. 2023 Emissions have
changed by -34.0% (-34.56 Gg CO2 /
year). 1990-2023 Emissions have changed by -32.8% (-23.67 Gg CO2 / year). For 2023
the changes per gas
are:
For 1990-2023 the changes per gas are: