Changes in PRIMAP-hist v2.6.1_final compared to v2.6_final for Belarus
2025-03-19
Johannes Gütschow
Change analysis for Belarus for PRIMAP-hist v2.6.1_final compared to v2.6_final
Overview over emissions by sector and gas
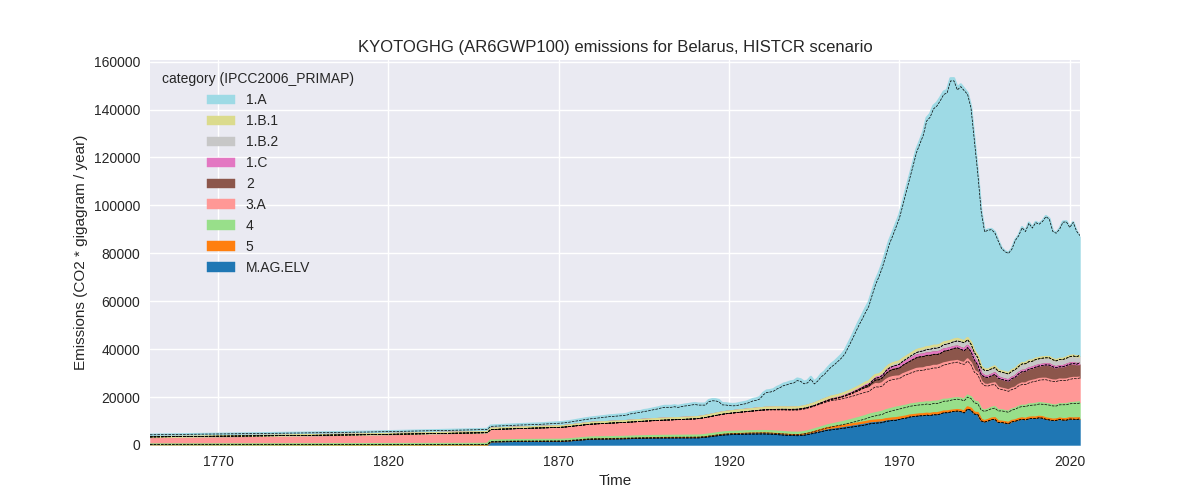
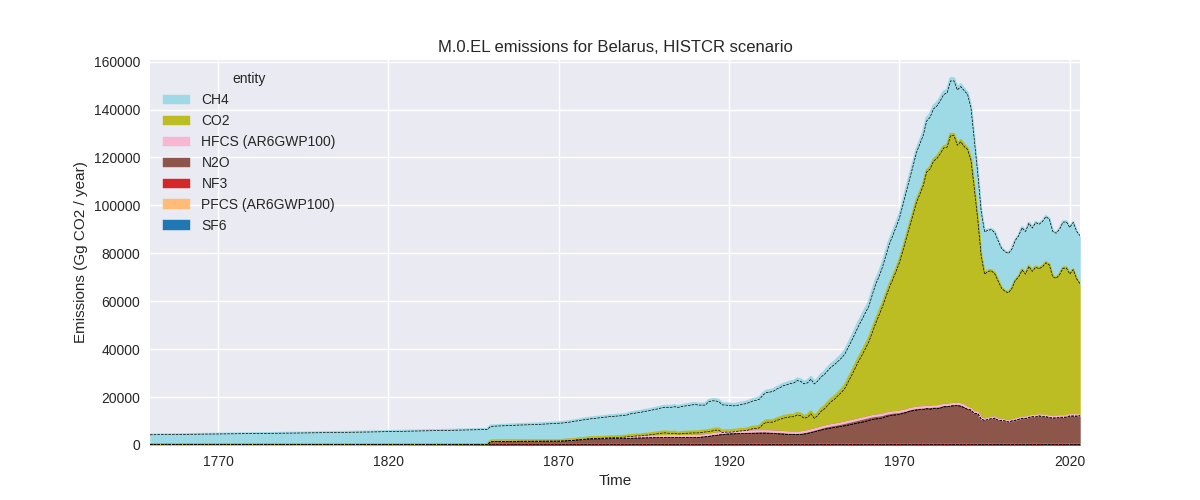
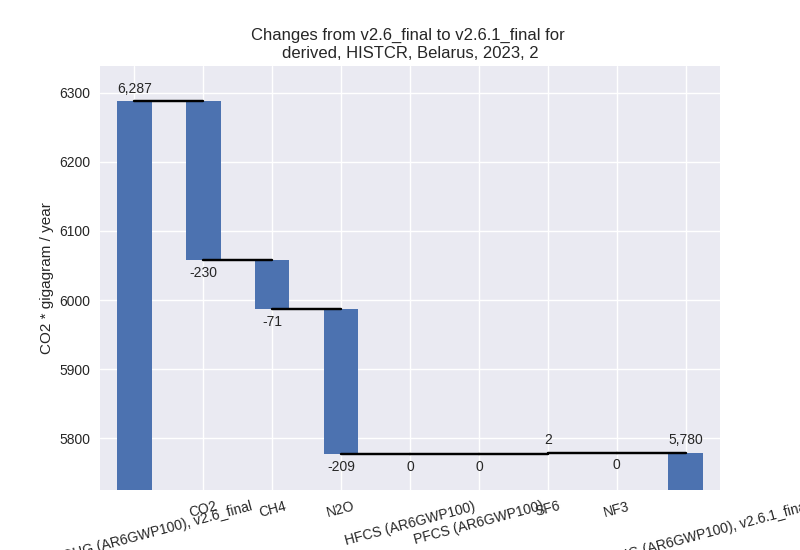
The following figures show the aggregate national total emissions excluding LULUCF AR6GWP100 for the country reported priority scenario. The dotted linesshow the v2.6_final data.
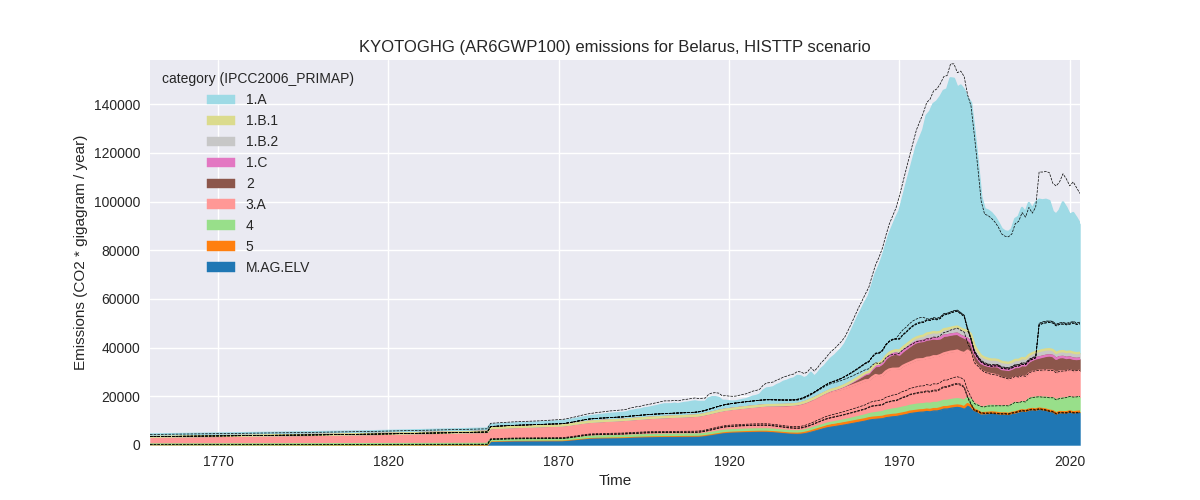
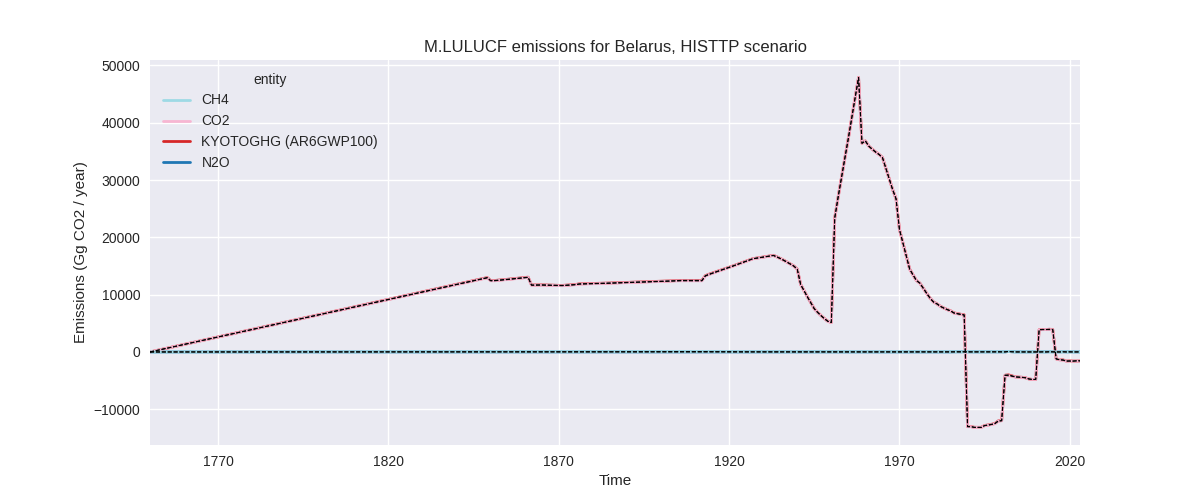
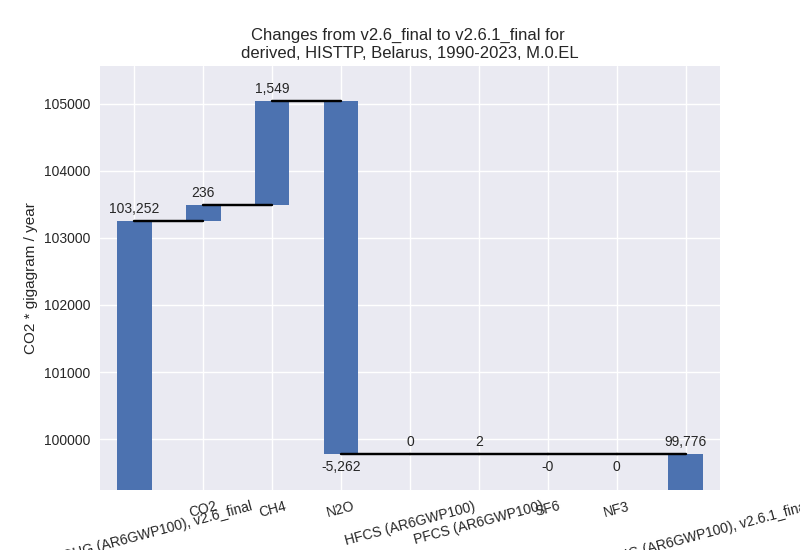
The following figures show the aggregate national total emissions excluding LULUCF AR6GWP100 for the third party priority scenario. The dotted linesshow the v2.6_final data.

Overview over changes
In the country reported priority scenario we have the following changes for aggregate Kyoto GHG and national total emissions excluding LULUCF (M.0.EL):
- Emissions in 2023 have changed by -0.5%% (-461.16 Gg CO2 / year)
- Emissions in 1990-2023 have changed by 0.2%% (233.36 Gg CO2 / year)
In the third party priority scenario we have the following changes for aggregate Kyoto GHG and national total emissions excluding LULUCF (M.0.EL):
- Emissions in 2023 have changed by -12.1%% (-12521.49 Gg CO2 / year)
- Emissions in 1990-2023 have changed by -3.4%% (-3475.44 Gg CO2 / year)
Most important changes per scenario and time frame
In the country reported priority scenario the following sector-gas combinations have the highest absolute impact on national total KyotoGHG (AR6GWP100) emissions in 2023 (top 5):
- 1: 2, CO2 with -230.06 Gg CO2 / year (-4.6%)
- 2: 2, N2O with -209.43 Gg CO2 / year (-24.0%)
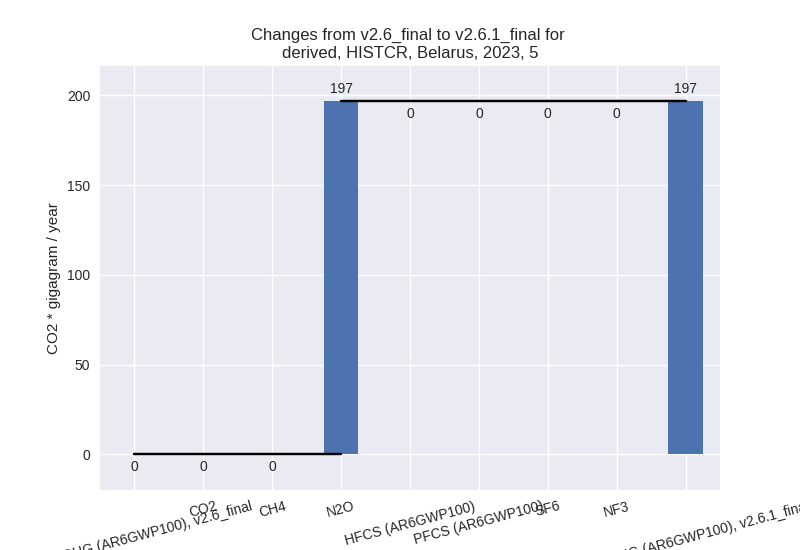
- 3: 5, N2O with 196.73 Gg CO2 / year (inf%)
- 4: 3.A, CH4 with -191.93 Gg CO2 / year (-1.9%)
- 5: 1.A, CO2 with -126.13 Gg CO2 / year (-0.3%)
In the country reported priority scenario the following sector-gas combinations have the highest absolute impact on national total KyotoGHG (AR6GWP100) emissions in 1990-2023 (top 5):
- 1: 5, N2O with 262.35 Gg CO2 / year (inf%)
- 2: M.AG.ELV, CO2 with 110.93 Gg CO2 / year (9.1%)
- 3: 1.A, CO2 with -81.78 Gg CO2 / year (-0.1%)
- 4: 3.A, CH4 with 78.44 Gg CO2 / year (0.8%)
- 5: 4, CH4 with -72.65 Gg CO2 / year (-1.4%)
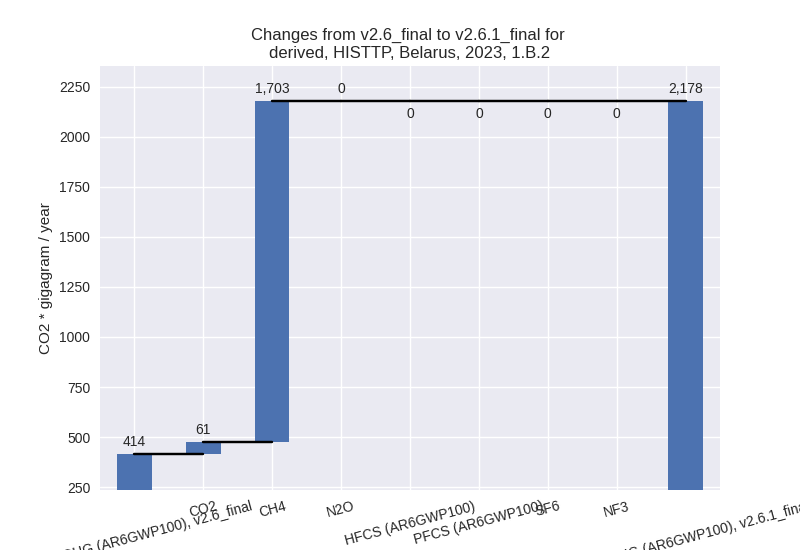
In the third party priority scenario the following sector-gas combinations have the highest absolute impact on national total KyotoGHG (AR6GWP100) emissions in 2023 (top 5):
- 1: 2, N2O with -14297.97 Gg CO2 / year (-95.8%)
- 2: 1.B.2, CH4 with 1702.66 Gg CO2 / year (413.5%)
- 3: 4, CH4 with -661.96 Gg CO2 / year (-10.3%)
- 4: M.AG.ELV, N2O with 322.98 Gg CO2 / year (2.5%)
- 5: 2, CO2 with 203.56 Gg CO2 / year (5.3%)
In the third party priority scenario the following sector-gas combinations have the highest absolute impact on national total KyotoGHG (AR6GWP100) emissions in 1990-2023 (top 5):
- 1: 2, N2O with -5191.46 Gg CO2 / year (-89.2%)
- 2: 1.B.2, CH4 with 1789.03 Gg CO2 / year (397.7%)
- 3: 1.B.2, CO2 with 265.36 Gg CO2 / year (3850.5%)
- 4: 4, CH4 with -238.62 Gg CO2 / year (-5.9%)
- 5: M.AG.ELV, N2O with -61.99 Gg CO2 / year (-0.5%)
Notes on data changes
Here we list notes explaining important emissions changes for the country.
- The country reported data has been updated from limited resolution official data (downscaled using CRF2023) to the CRT data submitted with BTR1. The datasets are very similar. Changes in the CR time-series are small and mostly come from updated third party data (EDGAR, FAO) which is used to extrapolate the country reported data.
- The high changes in the TP scenario come from updated EDGAR data, especially N2O from chemical industry (2.B) and fugitive emissions from oil and gas (1.B.2)
- Pre-1990 emissions in M.AG.ELV, N2O have changed, because the downscaling of the data for the former USSR has changed due to the different sectoral resolution used in the processing of the new FAO data.
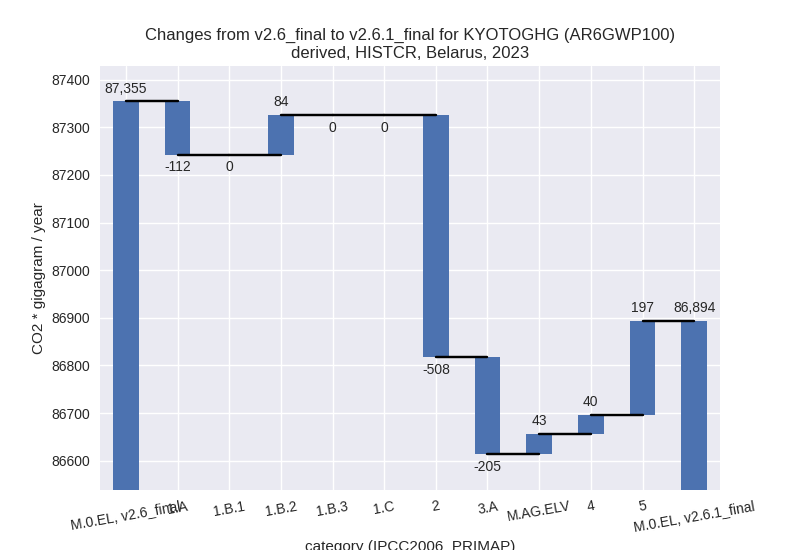
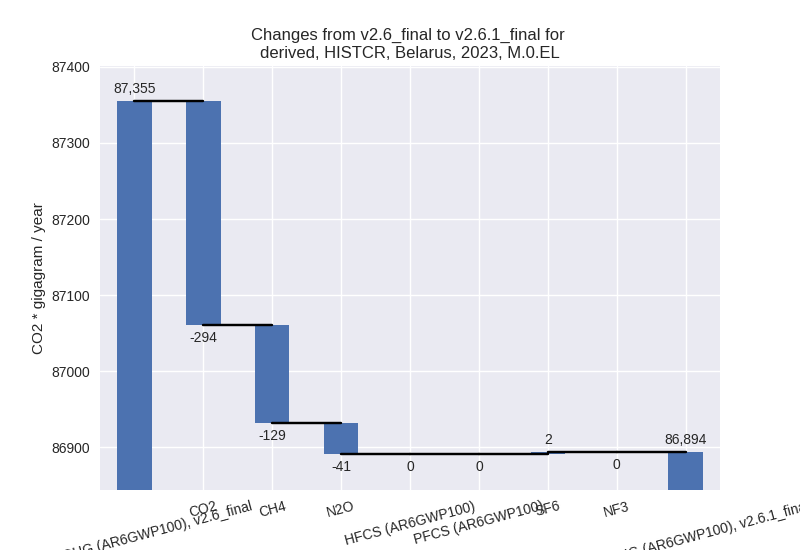
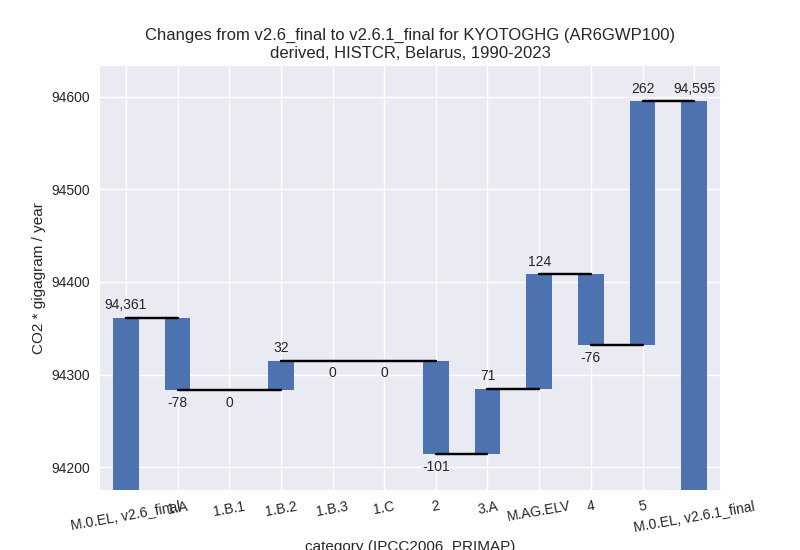
Changes by sector and gas
For each scenario and time frame the changes are displayed for all individual sectors and all individual gases. In the sector plot we use aggregate Kyoto GHGs in AR6GWP100. In the gas plot we usenational total emissions without LULUCF.
country reported scenario
2023
1990-2023
third party scenario
2023
1990-2023
Detailed changes for the scenarios:
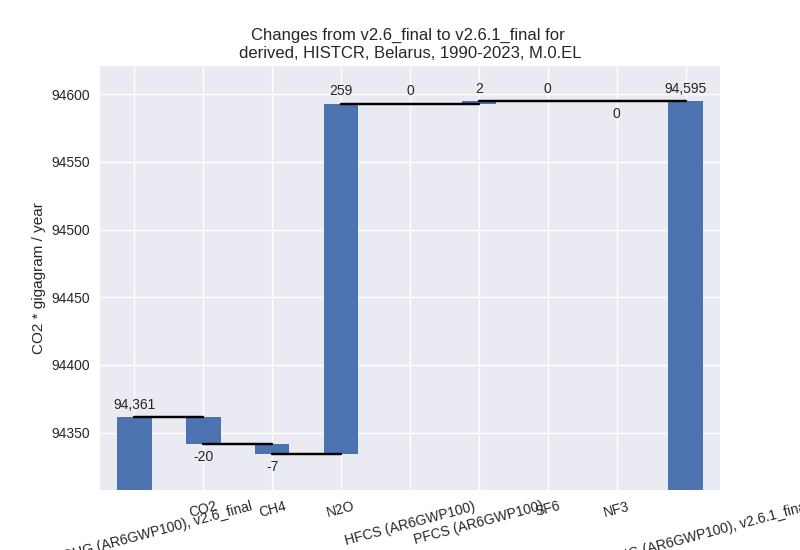
country reported scenario (HISTCR):
Most important changes per time frame
For 2023 the following sector-gas combinations have the highest absolute impact on national total KyotoGHG (AR6GWP100) emissions in 2023 (top 5):
- 1: 2, CO2 with -230.06 Gg CO2 / year (-4.6%)
- 2: 2, N2O with -209.43 Gg CO2 / year (-24.0%)
- 3: 5, N2O with 196.73 Gg CO2 / year (inf%)
- 4: 3.A, CH4 with -191.93 Gg CO2 / year (-1.9%)
- 5: 1.A, CO2 with -126.13 Gg CO2 / year (-0.3%)
For 1990-2023 the following sector-gas combinations have the highest absolute impact on national total KyotoGHG (AR6GWP100) emissions in 1990-2023 (top 5):
- 1: 5, N2O with 262.35 Gg CO2 / year (inf%)
- 2: M.AG.ELV, CO2 with 110.93 Gg CO2 / year (9.1%)
- 3: 1.A, CO2 with -81.78 Gg CO2 / year (-0.1%)
- 4: 3.A, CH4 with 78.44 Gg CO2 / year (0.8%)
- 5: 4, CH4 with -72.65 Gg CO2 / year (-1.4%)
Changes in the main sectors for aggregate KyotoGHG (AR6GWP100) are
- 1: Total sectoral emissions in 2022 are 55423.87 Gg CO2 / year which is 62.1% of M.0.EL emissions. 2023 Emissions have changed by -0.1% (-28.25 Gg CO2 / year). 1990-2023 Emissions have changed by -0.1% (-46.23 Gg CO2 / year).
- 2: Total sectoral emissions in 2022 are 5816.83 Gg
CO2 / year which is 6.5% of M.0.EL emissions. 2023 Emissions have
changed by -8.1% (-507.92 Gg CO2 /
year). 1990-2023 Emissions have changed by -1.9% (-101.00 Gg CO2 / year). For 2023
the changes per gas
are:
- M.AG: Total sectoral emissions in 2022 are 21120.40 Gg CO2 / year which is 23.7% of M.0.EL emissions. 2023 Emissions have changed by -0.8% (-161.52 Gg CO2 / year). 1990-2023 Emissions have changed by 0.9% (194.26 Gg CO2 / year).
- 4: Total sectoral emissions in 2022 are 6627.69 Gg CO2 / year which is 7.4% of M.0.EL emissions. 2023 Emissions have changed by 0.6% (39.80 Gg CO2 / year). 1990-2023 Emissions have changed by -1.4% (-76.02 Gg CO2 / year).
- 5: Total sectoral emissions in 2022 are 199.55 Gg
CO2 / year which is 0.2% of M.0.EL emissions. 2023 Emissions have
changed by inf% (196.73 Gg CO2 /
year). 1990-2023 Emissions have changed by inf% (262.35 Gg CO2 / year). For 2023 the
changes per gas
are:
For 1990-2023 the changes per gas are: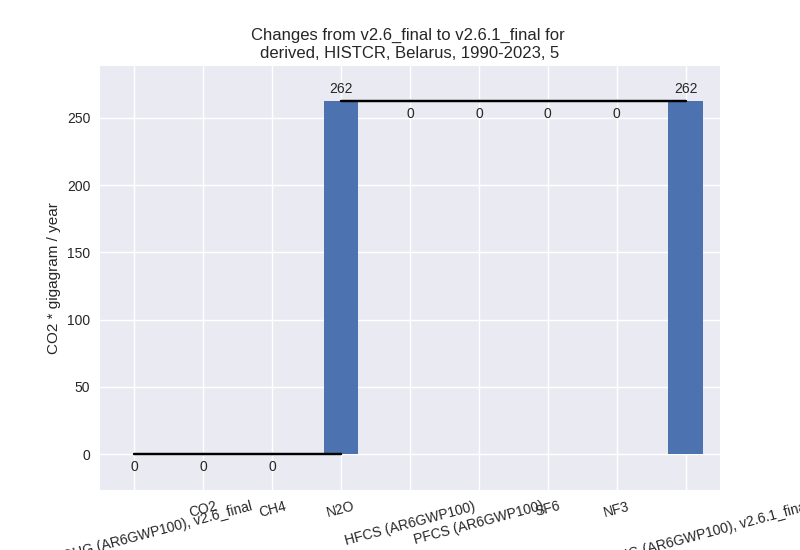
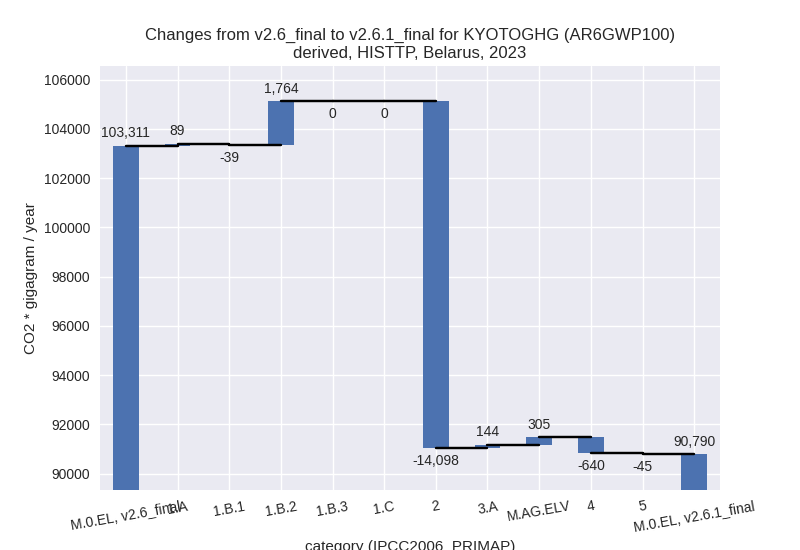
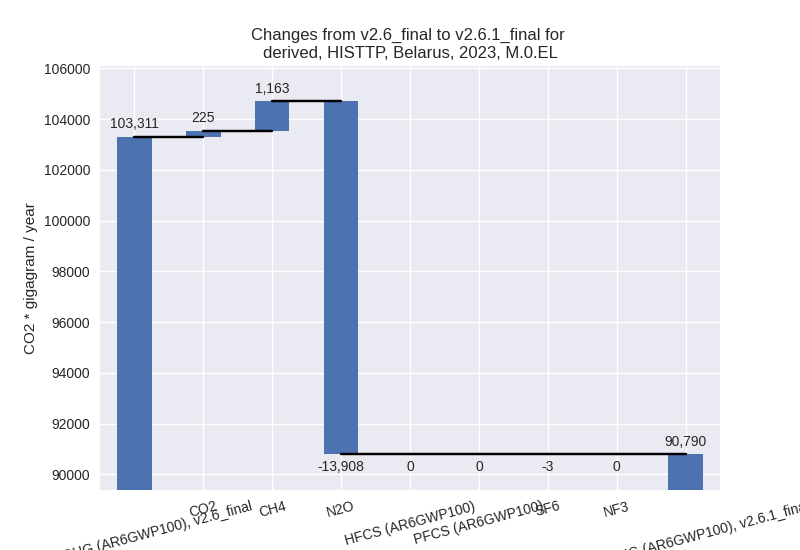
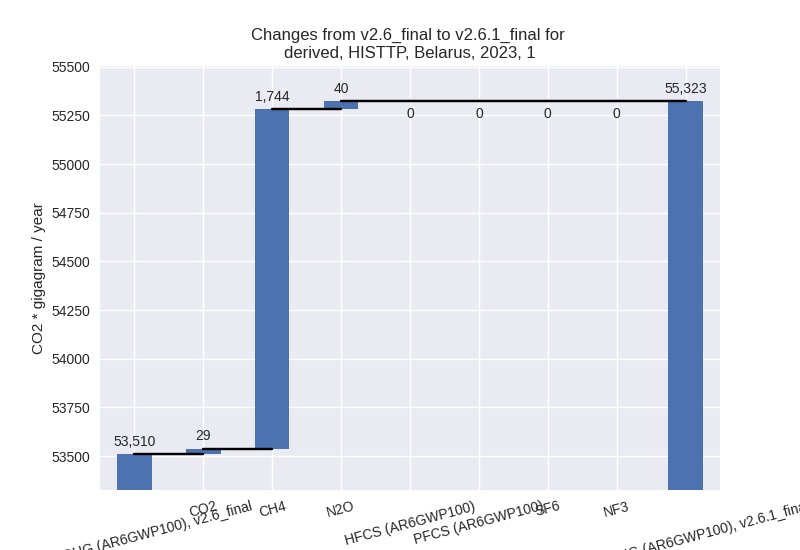
third party scenario (HISTTP):
Most important changes per time frame
For 2023 the following sector-gas combinations have the highest absolute impact on national total KyotoGHG (AR6GWP100) emissions in 2023 (top 5):
- 1: 2, N2O with -14297.97 Gg CO2 / year (-95.8%)
- 2: 1.B.2, CH4 with 1702.66 Gg CO2 / year (413.5%)
- 3: 4, CH4 with -661.96 Gg CO2 / year (-10.3%)
- 4: M.AG.ELV, N2O with 322.98 Gg CO2 / year (2.5%)
- 5: 2, CO2 with 203.56 Gg CO2 / year (5.3%)
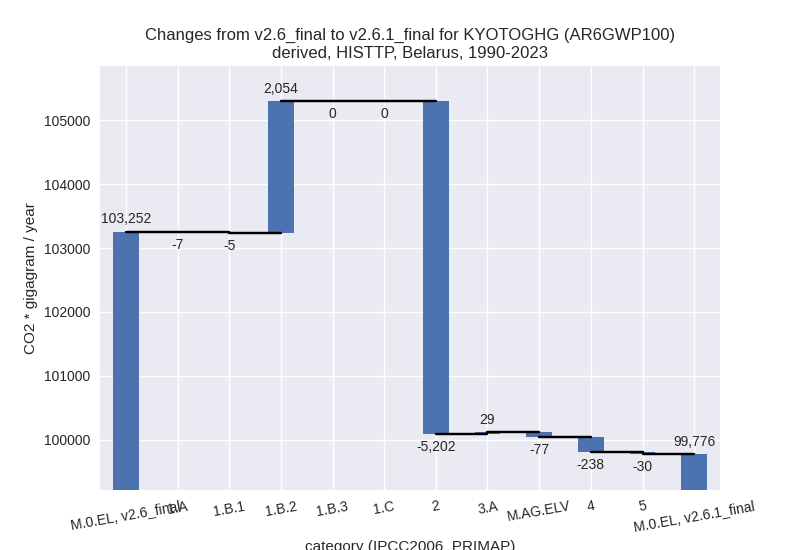
For 1990-2023 the following sector-gas combinations have the highest absolute impact on national total KyotoGHG (AR6GWP100) emissions in 1990-2023 (top 5):
- 1: 2, N2O with -5191.46 Gg CO2 / year (-89.2%)
- 2: 1.B.2, CH4 with 1789.03 Gg CO2 / year (397.7%)
- 3: 1.B.2, CO2 with 265.36 Gg CO2 / year (3850.5%)
- 4: 4, CH4 with -238.62 Gg CO2 / year (-5.9%)
- 5: M.AG.ELV, N2O with -61.99 Gg CO2 / year (-0.5%)
Changes in the main sectors for aggregate KyotoGHG (AR6GWP100) are
- 1: Total sectoral emissions in 2022 are 57873.24 Gg
CO2 / year which is 62.1% of M.0.EL emissions. 2023 Emissions have
changed by 3.4% (1812.91 Gg CO2 /
year). 1990-2023 Emissions have changed by 3.2% (2042.45 Gg CO2 / year). For 2023 the
changes per gas
are:
For 1990-2023 the changes per gas are: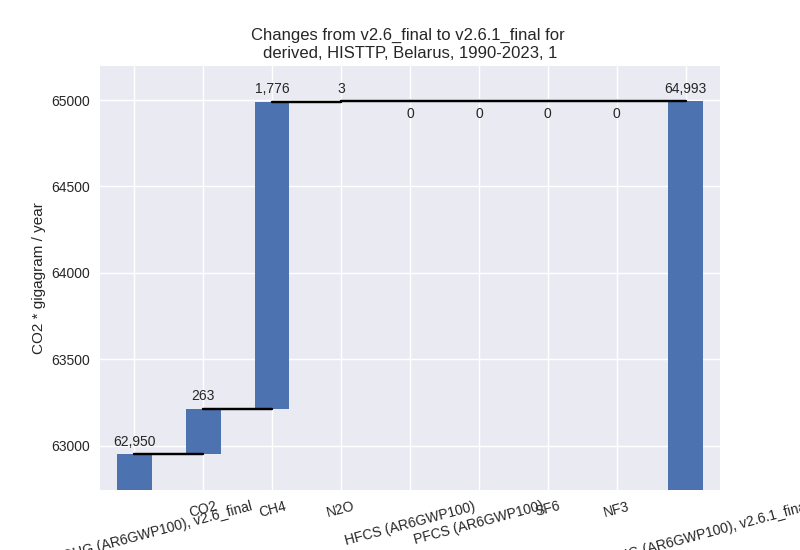
The changes come from the following subsectors:- 1.A: Total sectoral emissions in 2022 are 55502.51 Gg CO2 / year which is 95.9% of category 1 emissions. 2023 Emissions have changed by 0.2% (88.58 Gg CO2 / year). 1990-2023 Emissions have changed by -0.0% (-7.19 Gg CO2 / year).
- 1.B.1: Total sectoral emissions in 2022 are 234.11
Gg CO2 / year which is 0.4% of category 1 emissions. 2023 Emissions have
changed by -13.9% (-39.21 Gg CO2 /
year). 1990-2023 Emissions have changed by -2.2% (-4.78 Gg CO2 / year). For 2023 the
changes per gas
are:
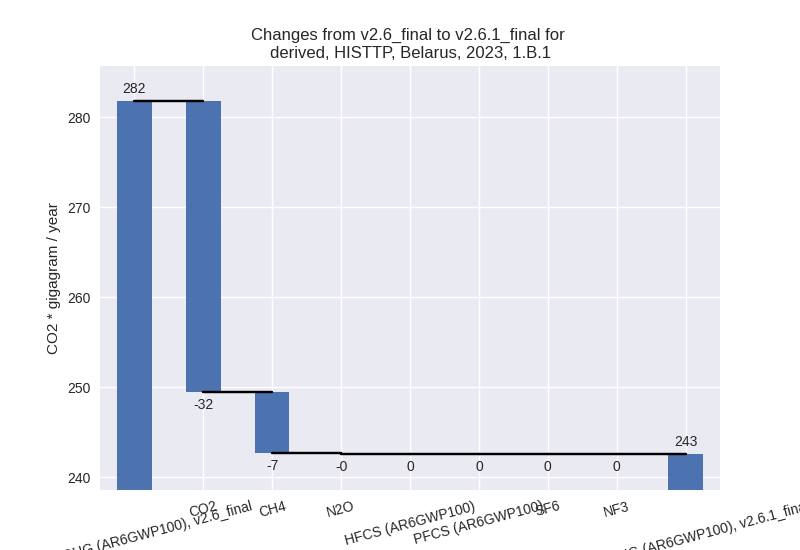
For 1990-2023 the changes per gas are: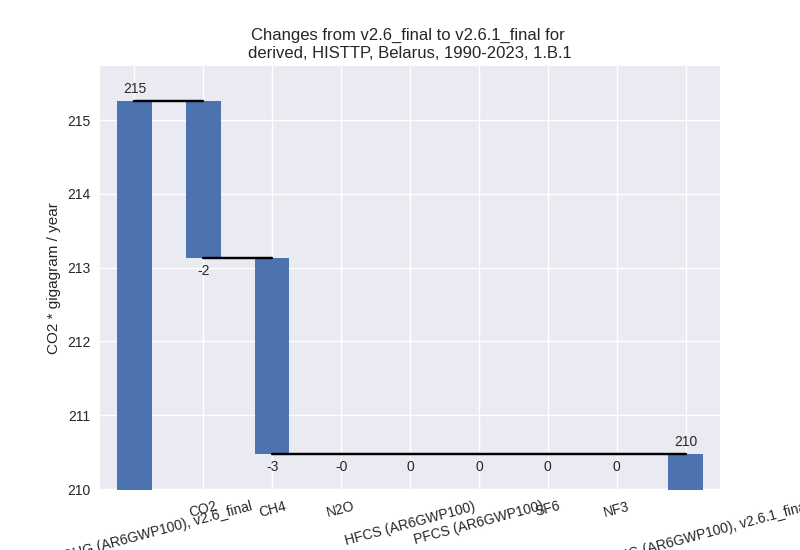
There is no subsector information available in PRIMAP-hist. - 1.B.2: Total sectoral emissions in 2022 are 2136.61
Gg CO2 / year which is 3.7% of category 1 emissions. 2023 Emissions have
changed by 425.7% (1763.54 Gg CO2 /
year). 1990-2023 Emissions have changed by 449.7% (2054.42 Gg CO2 / year). For 2023
the changes per gas
are:
For 1990-2023 the changes per gas are:
There is no subsector information available in PRIMAP-hist.
- 2: Total sectoral emissions in 2022 are 5067.73 Gg
CO2 / year which is 5.4% of M.0.EL emissions. 2023 Emissions have
changed by -73.7% (-14097.60 Gg CO2
/ year). 1990-2023 Emissions have changed by -52.6% (-5202.26 Gg CO2 / year). For 2023
the changes per gas
are:

For 1990-2023 the changes per gas are: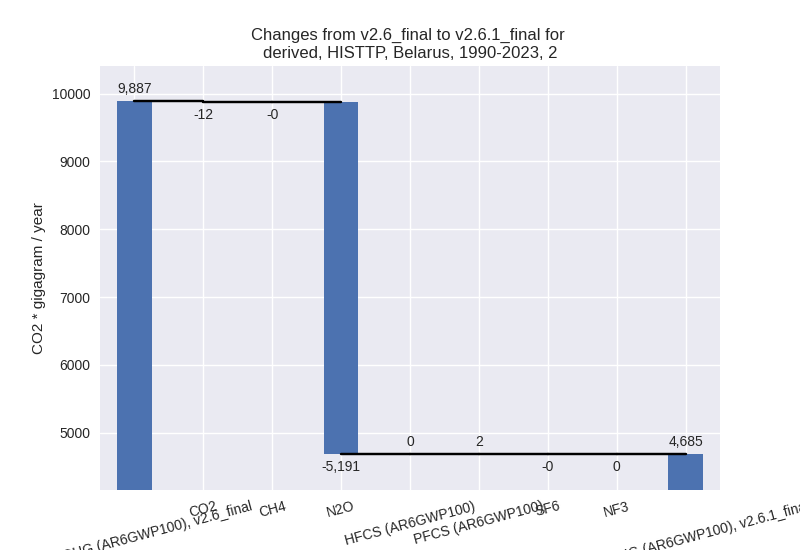
- M.AG: Total sectoral emissions in 2022 are 24211.60 Gg CO2 / year which is 26.0% of M.0.EL emissions. 2023 Emissions have changed by 1.9% (448.60 Gg CO2 / year). 1990-2023 Emissions have changed by -0.2% (-47.90 Gg CO2 / year).
- 4: Total sectoral emissions in 2022 are 5871.18 Gg
CO2 / year which is 6.3% of M.0.EL emissions. 2023 Emissions have
changed by -9.8% (-640.26 Gg CO2 /
year). 1990-2023 Emissions have changed by -5.6% (-237.83 Gg CO2 / year). For 2023
the changes per gas
are:

For 1990-2023 the changes per gas are: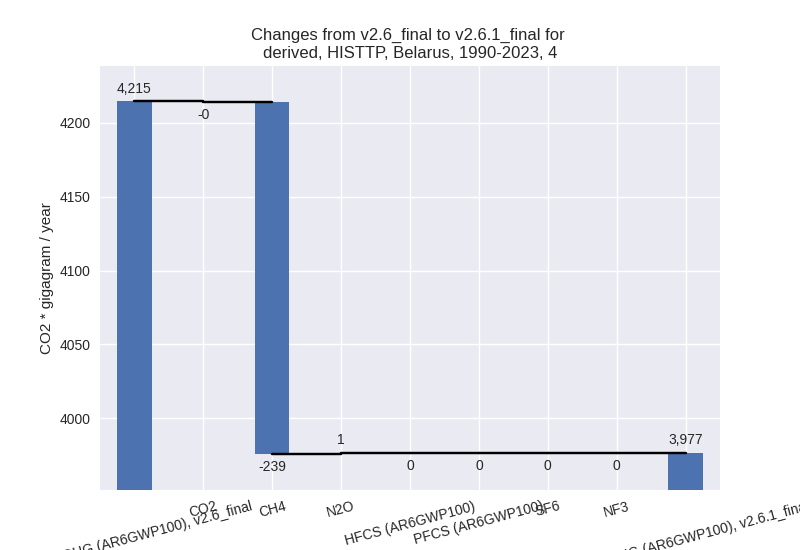
- 5: Total sectoral emissions in 2022 are 199.55 Gg
CO2 / year which is 0.2% of M.0.EL emissions. 2023 Emissions have
changed by -18.7% (-45.14 Gg CO2 /
year). 1990-2023 Emissions have changed by -10.2% (-29.91 Gg CO2 / year). For 2023
the changes per gas
are:

For 1990-2023 the changes per gas are: