Changes in PRIMAP-hist v2.6.1_final compared to v2.6_final for Belize
2025-03-19
Johannes Gütschow
Change analysis for Belize for PRIMAP-hist v2.6.1_final compared to v2.6_final
Overview over emissions by sector and gas
The following figures show the aggregate national total emissions excluding LULUCF AR6GWP100 for the country reported priority scenario. The dotted linesshow the v2.6_final data.
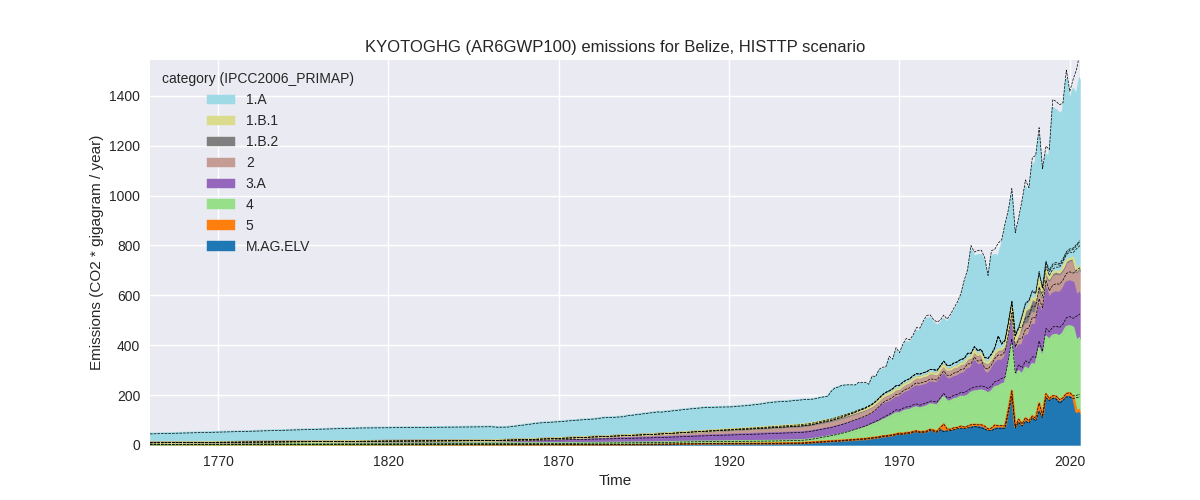
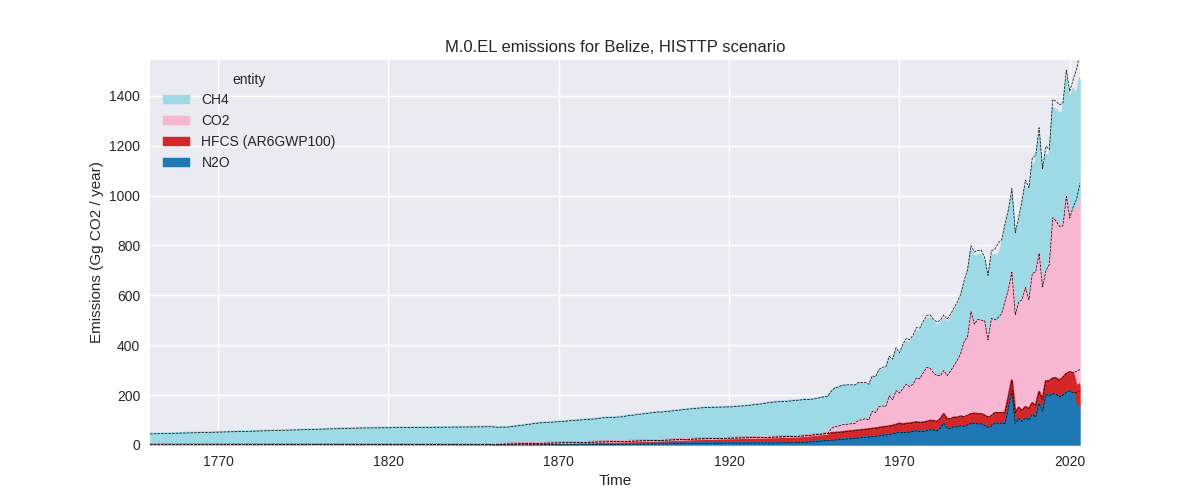
The following figures show the aggregate national total emissions excluding LULUCF AR6GWP100 for the third party priority scenario. The dotted linesshow the v2.6_final data.

Overview over changes
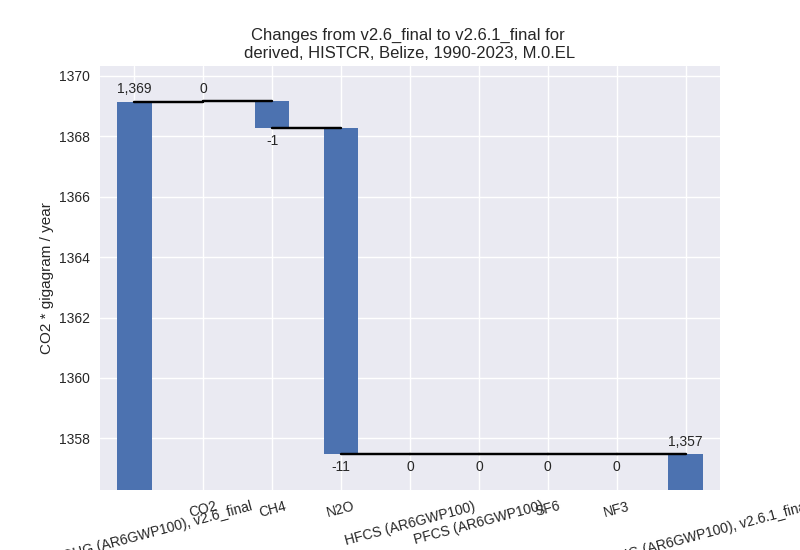
In the country reported priority scenario we have the following changes for aggregate Kyoto GHG and national total emissions excluding LULUCF (M.0.EL):
- Emissions in 2023 have changed by -6.9%% (-132.17 Gg CO2 / year)
- Emissions in 1990-2023 have changed by -0.9%% (-11.67 Gg CO2 / year)
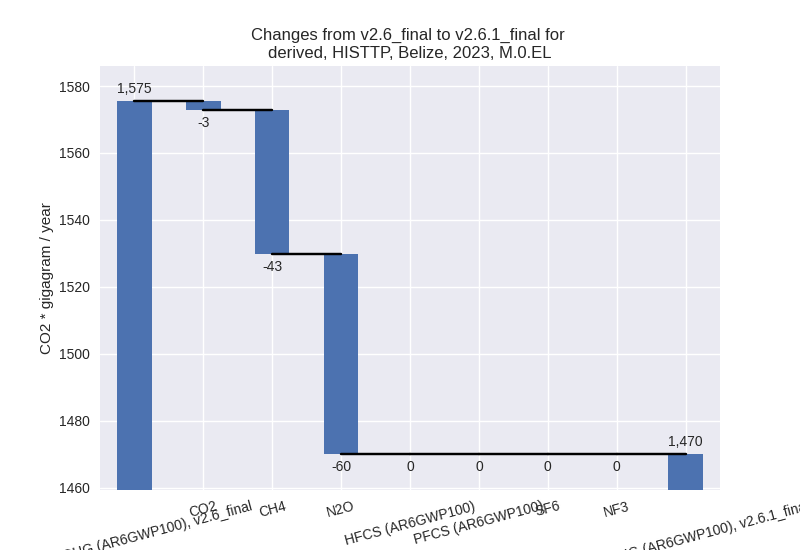
In the third party priority scenario we have the following changes for aggregate Kyoto GHG and national total emissions excluding LULUCF (M.0.EL):
- Emissions in 2023 have changed by -6.7%% (-105.47 Gg CO2 / year)
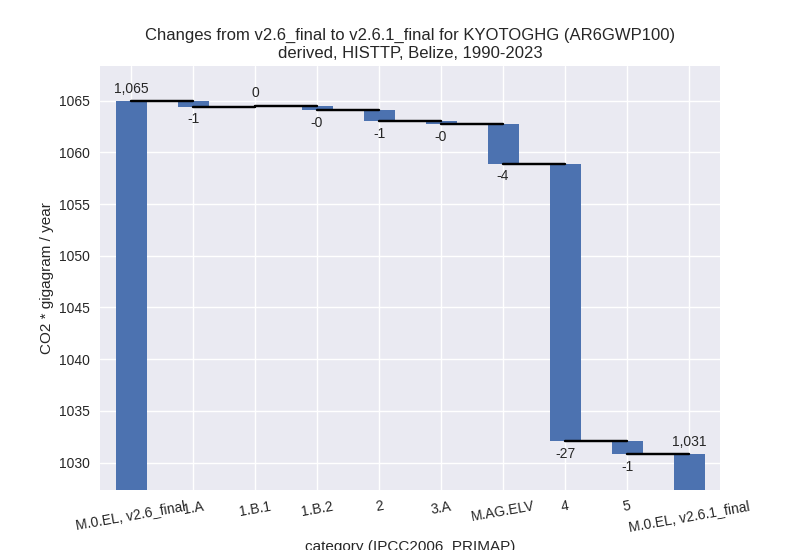
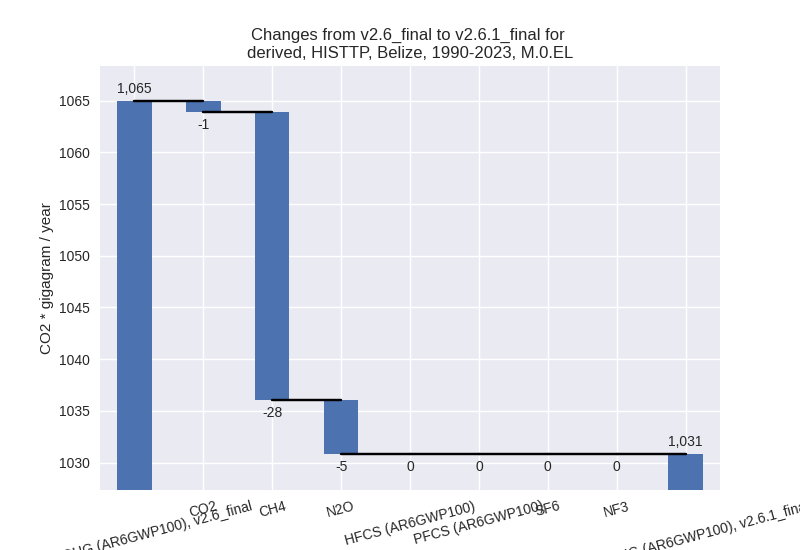
- Emissions in 1990-2023 have changed by -3.2%% (-34.12 Gg CO2 / year)
Most important changes per scenario and time frame
In the country reported priority scenario the following sector-gas combinations have the highest absolute impact on national total KyotoGHG (AR6GWP100) emissions in 2023 (top 5):
- 1: M.AG.ELV, N2O with -110.94 Gg CO2 / year (-35.2%)
- 2: 3.A, N2O with -12.27 Gg CO2 / year (-3.6%)
- 3: M.AG.ELV, CH4 with -5.17 Gg CO2 / year (-23.3%)
- 4: 5, N2O with 3.65 Gg CO2 / year (33.9%)
- 5: 3.A, CH4 with -3.52 Gg CO2 / year (-2.1%)
In the country reported priority scenario the following sector-gas combinations have the highest absolute impact on national total KyotoGHG (AR6GWP100) emissions in 1990-2023 (top 5):
- 1: M.AG.ELV, N2O with -6.47 Gg CO2 / year (-3.3%)
- 2: 3.A, N2O with -3.11 Gg CO2 / year (-1.1%)
- 3: 5, N2O with -1.26 Gg CO2 / year (-10.6%)
- 4: 1.B.2, CH4 with -0.43 Gg CO2 / year (-3.2%)
- 5: M.AG.ELV, CH4 with -0.24 Gg CO2 / year (-1.4%)
In the third party priority scenario the following sector-gas combinations have the highest absolute impact on national total KyotoGHG (AR6GWP100) emissions in 2023 (top 5):
- 1: M.AG.ELV, N2O with -63.72 Gg CO2 / year (-35.2%)
- 2: 4, CH4 with -34.03 Gg CO2 / year (-11.1%)
- 3: 3.A, CH4 with -3.85 Gg CO2 / year (-2.1%)
- 4: 5, N2O with 3.65 Gg CO2 / year (33.9%)
- 5: M.AG.ELV, CH4 with -2.73 Gg CO2 / year (-23.3%)
In the third party priority scenario the following sector-gas combinations have the highest absolute impact on national total KyotoGHG (AR6GWP100) emissions in 1990-2023 (top 5):
- 1: 4, CH4 with -26.86 Gg CO2 / year (-12.4%)
- 2: M.AG.ELV, N2O with -3.74 Gg CO2 / year (-3.5%)
- 3: 5, N2O with -1.26 Gg CO2 / year (-10.6%)
- 4: 2, CO2 with -1.06 Gg CO2 / year (-44.9%)
- 5: 1.B.2, CH4 with -0.43 Gg CO2 / year (-3.2%)
Notes on data changes
Here we list notes explaining important emissions changes for the country.
- There is no updated country reported data for Belize. Changes in the CR time-series come from changes in the third party input sources which are used to complement the scarce country reported data.
- The low N2O emissions in M.AG.ELV (CR, TP) come from a drop in emissions from synthetic fertilizers for 2022 in the updated FAO data.
- Lower N2O in 3.A and CH4 in M.AG.ELV in recent years comes fro the new FAO data as well.
- Lower emissions in sectors 4 (TP) and 5 (CR, TP) come from updated EDGAR data.
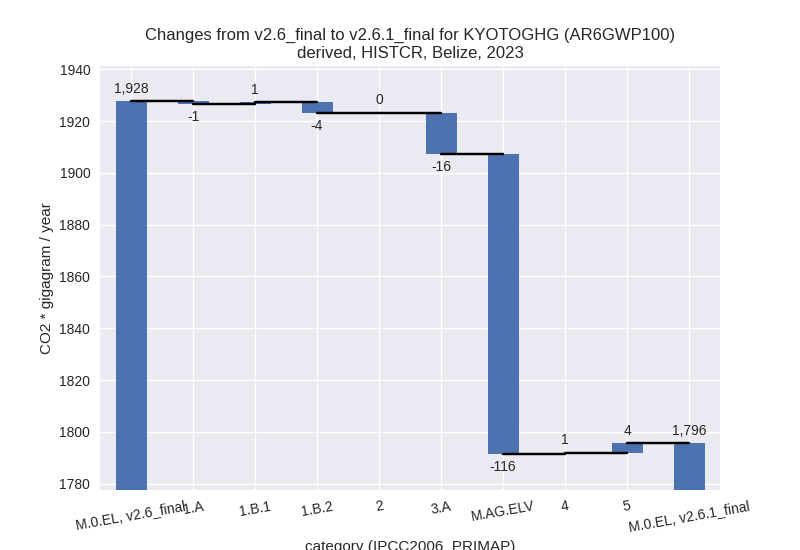
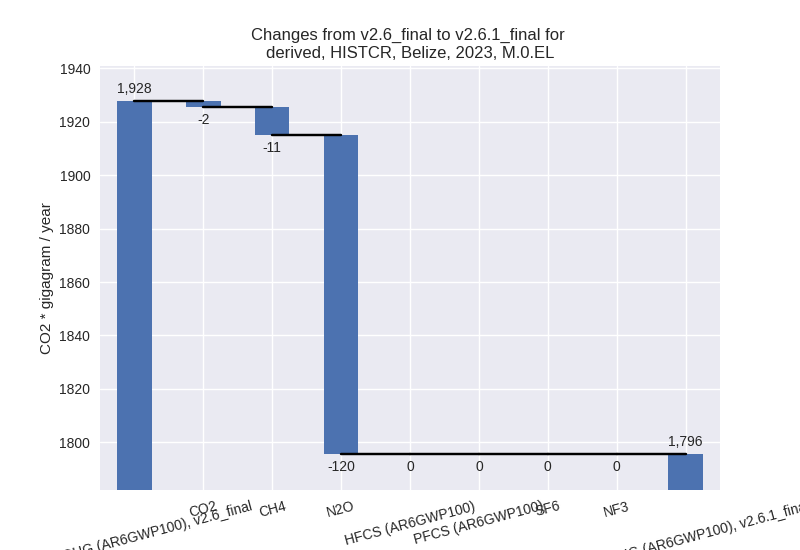
Changes by sector and gas
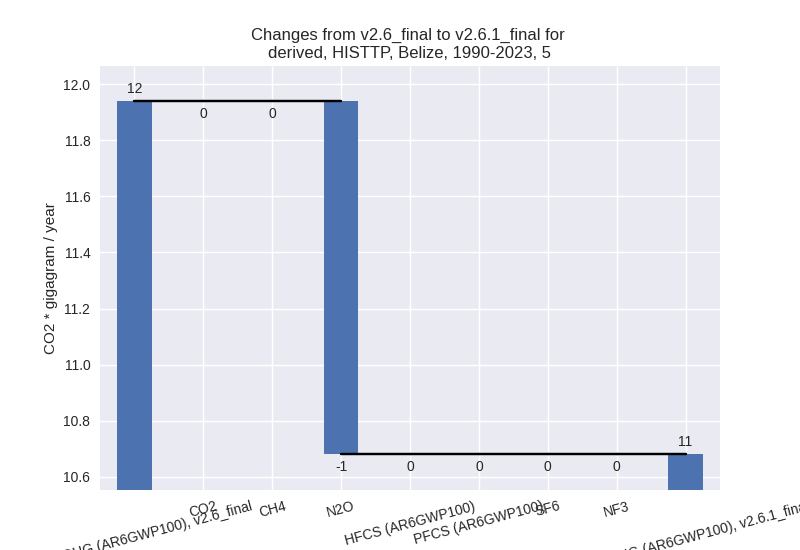
For each scenario and time frame the changes are displayed for all individual sectors and all individual gases. In the sector plot we use aggregate Kyoto GHGs in AR6GWP100. In the gas plot we usenational total emissions without LULUCF.
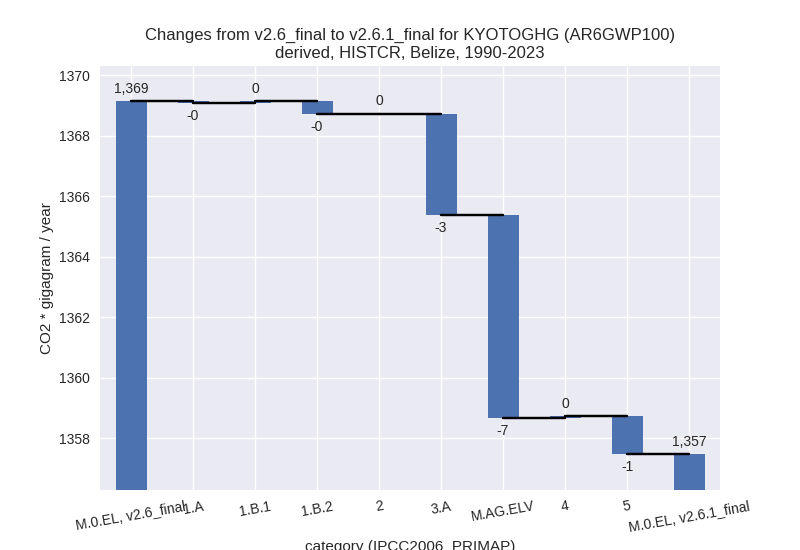
country reported scenario
2023
1990-2023
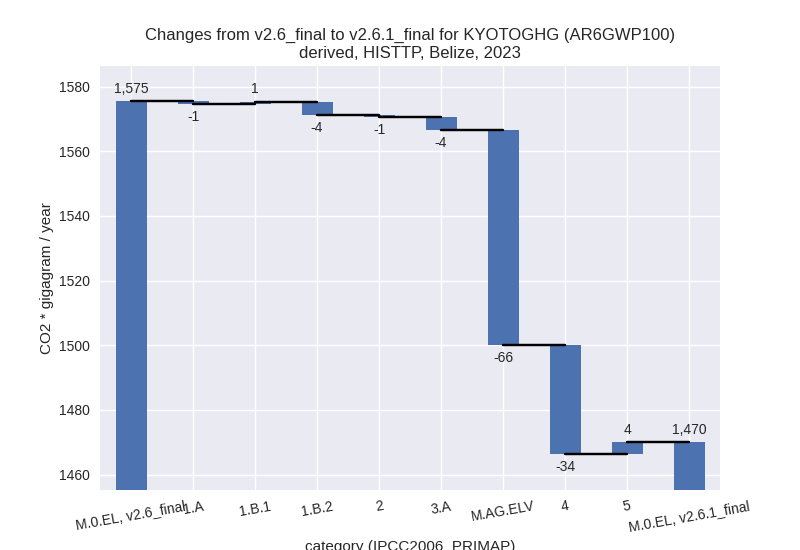
third party scenario
2023
1990-2023
Detailed changes for the scenarios:
country reported scenario (HISTCR):
Most important changes per time frame
For 2023 the following sector-gas combinations have the highest absolute impact on national total KyotoGHG (AR6GWP100) emissions in 2023 (top 5):
- 1: M.AG.ELV, N2O with -110.94 Gg CO2 / year (-35.2%)
- 2: 3.A, N2O with -12.27 Gg CO2 / year (-3.6%)
- 3: M.AG.ELV, CH4 with -5.17 Gg CO2 / year (-23.3%)
- 4: 5, N2O with 3.65 Gg CO2 / year (33.9%)
- 5: 3.A, CH4 with -3.52 Gg CO2 / year (-2.1%)
For 1990-2023 the following sector-gas combinations have the highest absolute impact on national total KyotoGHG (AR6GWP100) emissions in 1990-2023 (top 5):
- 1: M.AG.ELV, N2O with -6.47 Gg CO2 / year (-3.3%)
- 2: 3.A, N2O with -3.11 Gg CO2 / year (-1.1%)
- 3: 5, N2O with -1.26 Gg CO2 / year (-10.6%)
- 4: 1.B.2, CH4 with -0.43 Gg CO2 / year (-3.2%)
- 5: M.AG.ELV, CH4 with -0.24 Gg CO2 / year (-1.4%)
Changes in the main sectors for aggregate KyotoGHG (AR6GWP100) are
- 1: Total sectoral emissions in 2022 are 882.46 Gg CO2 / year which is 51.5% of M.0.EL emissions. 2023 Emissions have changed by -0.5% (-4.46 Gg CO2 / year). 1990-2023 Emissions have changed by -0.1% (-0.42 Gg CO2 / year).
- 2: Total sectoral emissions in 2022 are 84.28 Gg CO2 / year which is 4.9% of M.0.EL emissions. 2023 Emissions have changed by 0.0% (0.01 Gg CO2 / year). 1990-2023 Emissions have changed by 0.0% (0.00 Gg CO2 / year).
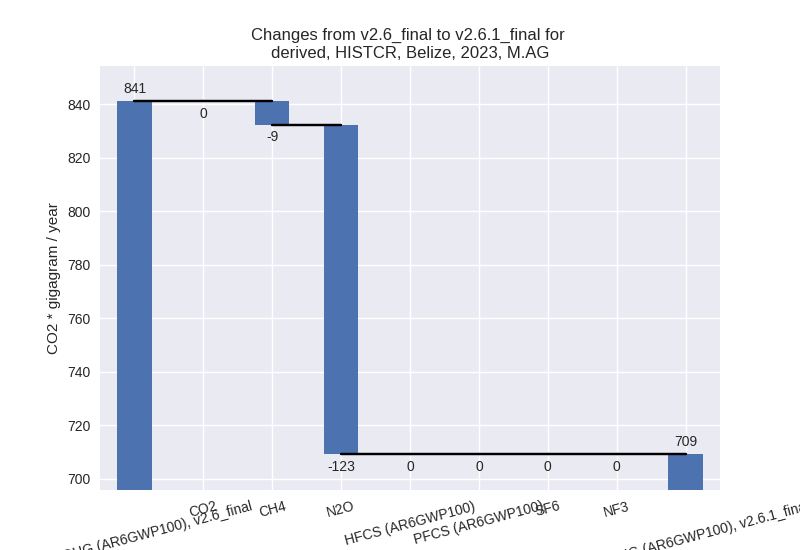
- M.AG: Total sectoral emissions in 2022 are 705.77
Gg CO2 / year which is 41.2% of M.0.EL emissions. 2023 Emissions have
changed by -15.7% (-131.90 Gg CO2 /
year). 1990-2023 Emissions have changed by -1.6% (-10.05 Gg CO2 / year). For 2023 the
changes per gas
are:
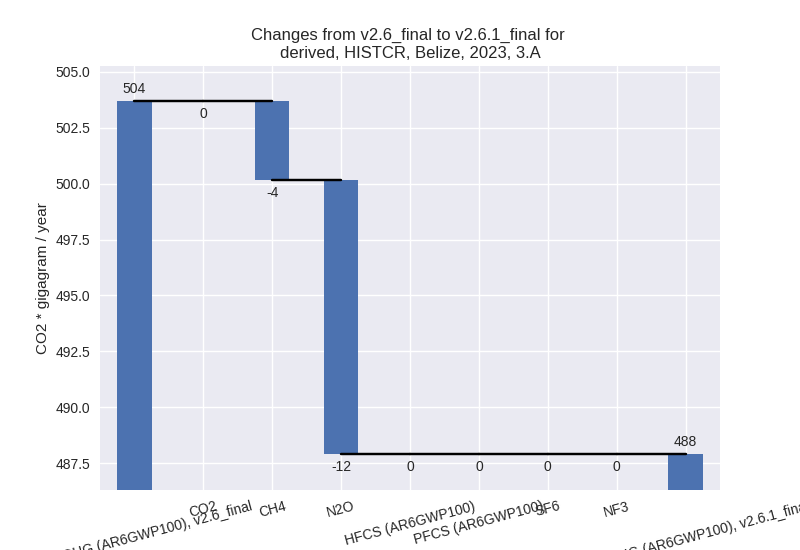
The changes come from the following subsectors:- 3.A: Total sectoral emissions in 2022 are 485.10 Gg
CO2 / year which is 68.7% of category M.AG emissions. 2023 Emissions
have changed by -3.1% (-15.79 Gg CO2
/ year). 1990-2023 Emissions have changed by -0.8% (-3.34 Gg CO2 / year). For 2023 the
changes per gas
are:
There is no subsector information available in PRIMAP-hist. - M.AG.ELV: Total sectoral emissions in 2022 are
220.67 Gg CO2 / year which is 31.3% of category M.AG emissions. 2023
Emissions have changed by -34.4%
(-116.11 Gg CO2 / year). 1990-2023 Emissions have changed by -3.1% (-6.71 Gg CO2 / year). For 2023 the
changes per gas
are:

For 1990-2023 the changes per gas are:
There is no subsector information available in PRIMAP-hist.
- 3.A: Total sectoral emissions in 2022 are 485.10 Gg
CO2 / year which is 68.7% of category M.AG emissions. 2023 Emissions
have changed by -3.1% (-15.79 Gg CO2
/ year). 1990-2023 Emissions have changed by -0.8% (-3.34 Gg CO2 / year). For 2023 the
changes per gas
are:
- 4: Total sectoral emissions in 2022 are 34.74 Gg CO2 / year which is 2.0% of M.0.EL emissions. 2023 Emissions have changed by 1.5% (0.52 Gg CO2 / year). 1990-2023 Emissions have changed by 0.2% (0.06 Gg CO2 / year).
- 5: Total sectoral emissions in 2022 are 7.57 Gg CO2
/ year which is 0.4% of M.0.EL emissions. 2023 Emissions have changed by
33.9% (3.65 Gg CO2 / year).
1990-2023 Emissions have changed by -10.6% (-1.26 Gg CO2 / year). For 2023 the
changes per gas
are:

For 1990-2023 the changes per gas are:
third party scenario (HISTTP):
Most important changes per time frame
For 2023 the following sector-gas combinations have the highest absolute impact on national total KyotoGHG (AR6GWP100) emissions in 2023 (top 5):
- 1: M.AG.ELV, N2O with -63.72 Gg CO2 / year (-35.2%)
- 2: 4, CH4 with -34.03 Gg CO2 / year (-11.1%)
- 3: 3.A, CH4 with -3.85 Gg CO2 / year (-2.1%)
- 4: 5, N2O with 3.65 Gg CO2 / year (33.9%)
- 5: M.AG.ELV, CH4 with -2.73 Gg CO2 / year (-23.3%)
For 1990-2023 the following sector-gas combinations have the highest absolute impact on national total KyotoGHG (AR6GWP100) emissions in 1990-2023 (top 5):
- 1: 4, CH4 with -26.86 Gg CO2 / year (-12.4%)
- 2: M.AG.ELV, N2O with -3.74 Gg CO2 / year (-3.5%)
- 3: 5, N2O with -1.26 Gg CO2 / year (-10.6%)
- 4: 2, CO2 with -1.06 Gg CO2 / year (-44.9%)
- 5: 1.B.2, CH4 with -0.43 Gg CO2 / year (-3.2%)
Changes in the main sectors for aggregate KyotoGHG (AR6GWP100) are
- 1: Total sectoral emissions in 2022 are 717.68 Gg CO2 / year which is 51.3% of M.0.EL emissions. 2023 Emissions have changed by -0.6% (-4.30 Gg CO2 / year). 1990-2023 Emissions have changed by -0.2% (-0.86 Gg CO2 / year).
- 2: Total sectoral emissions in 2022 are 85.07 Gg CO2 / year which is 6.1% of M.0.EL emissions. 2023 Emissions have changed by -0.6% (-0.55 Gg CO2 / year). 1990-2023 Emissions have changed by -2.0% (-1.06 Gg CO2 / year).
- M.AG: Total sectoral emissions in 2022 are 307.58
Gg CO2 / year which is 22.0% of M.0.EL emissions. 2023 Emissions have
changed by -18.6% (-70.42 Gg CO2 /
year). 1990-2023 Emissions have changed by -1.6% (-4.10 Gg CO2 / year). For 2023 the
changes per gas
are:

The changes come from the following subsectors:- 3.A: Total sectoral emissions in 2022 are 181.74 Gg
CO2 / year which is 59.1% of category M.AG emissions. 2023 Emissions
have changed by -2.1% (-3.97 Gg CO2
/ year). 1990-2023 Emissions have changed by -0.2% (-0.28 Gg CO2 / year). For 2023 the
changes per gas
are:
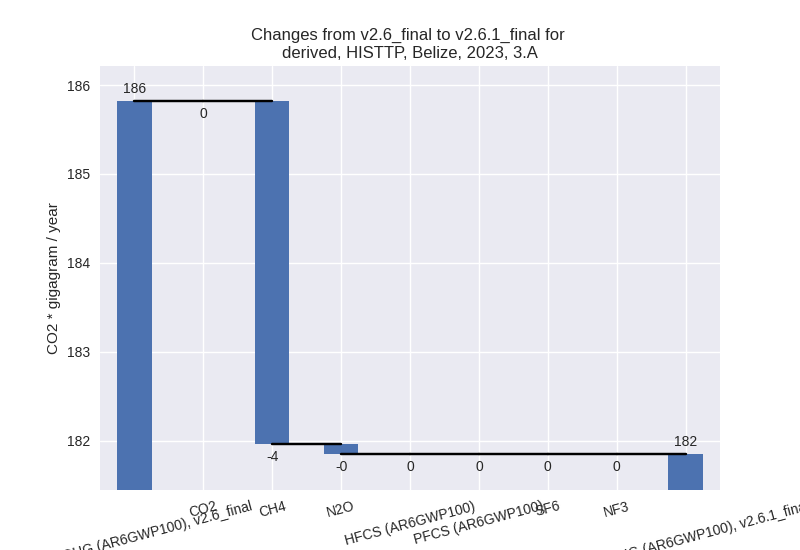
There is no subsector information available in PRIMAP-hist. - M.AG.ELV: Total sectoral emissions in 2022 are
125.84 Gg CO2 / year which is 40.9% of category M.AG emissions. 2023
Emissions have changed by -34.5%
(-66.45 Gg CO2 / year). 1990-2023 Emissions have changed by -3.2% (-3.82 Gg CO2 / year). For 2023 the
changes per gas
are:
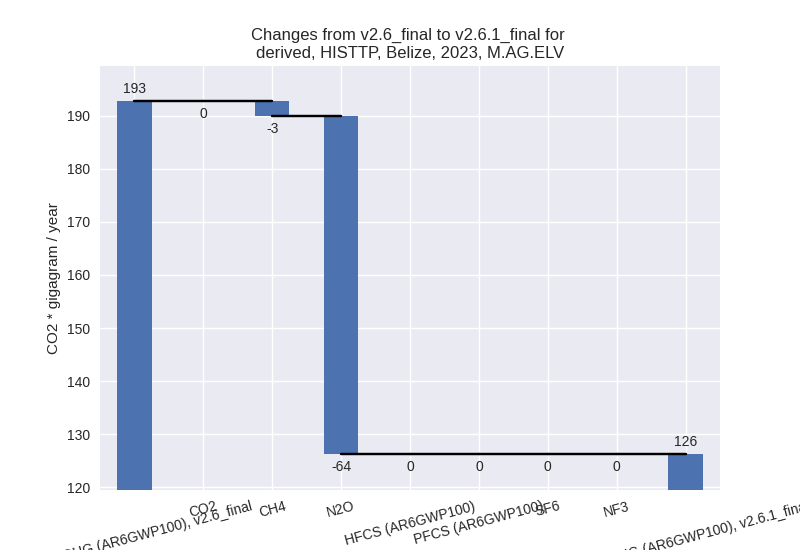
For 1990-2023 the changes per gas are:
There is no subsector information available in PRIMAP-hist.
- 3.A: Total sectoral emissions in 2022 are 181.74 Gg
CO2 / year which is 59.1% of category M.AG emissions. 2023 Emissions
have changed by -2.1% (-3.97 Gg CO2
/ year). 1990-2023 Emissions have changed by -0.2% (-0.28 Gg CO2 / year). For 2023 the
changes per gas
are:
- 4: Total sectoral emissions in 2022 are 281.83 Gg
CO2 / year which is 20.1% of M.0.EL emissions. 2023 Emissions have
changed by -10.5% (-33.87 Gg CO2 /
year). 1990-2023 Emissions have changed by -11.8% (-26.85 Gg CO2 / year). For 2023
the changes per gas
are:
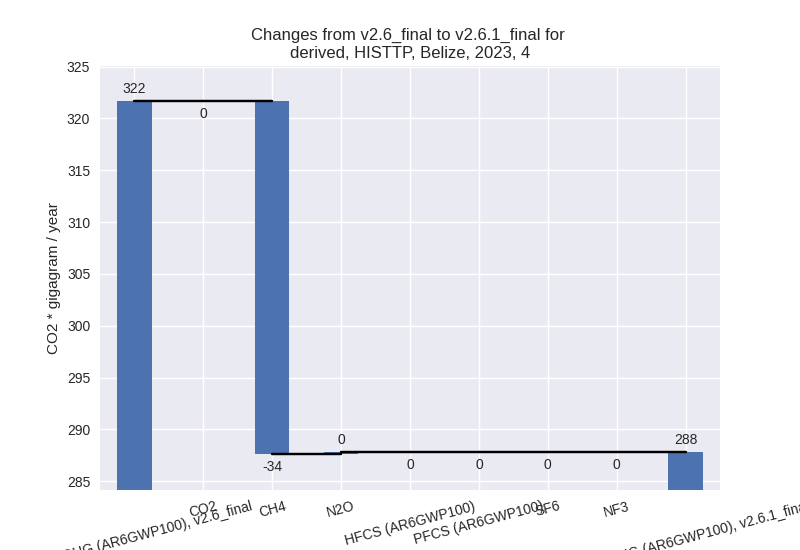
For 1990-2023 the changes per gas are:
- 5: Total sectoral emissions in 2022 are 7.57 Gg CO2
/ year which is 0.5% of M.0.EL emissions. 2023 Emissions have changed by
33.9% (3.65 Gg CO2 / year).
1990-2023 Emissions have changed by -10.6% (-1.26 Gg CO2 / year). For 2023 the
changes per gas
are:
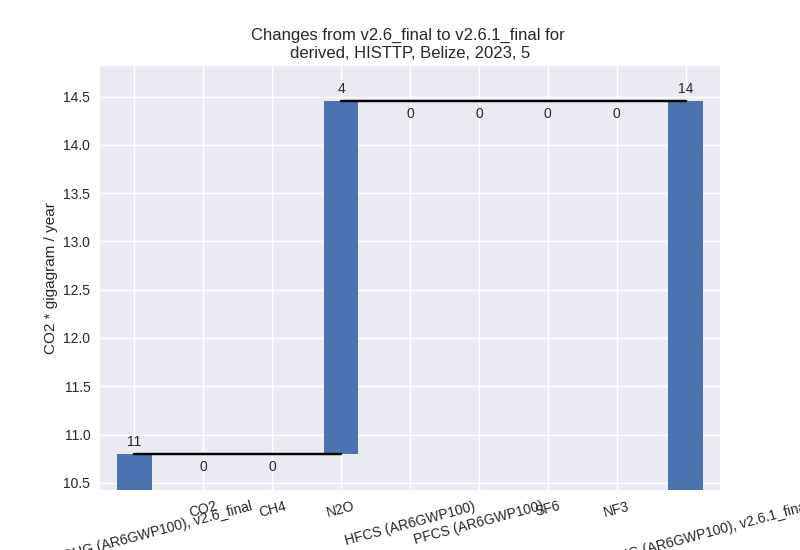
For 1990-2023 the changes per gas are: