Changes in PRIMAP-hist v2.6.1_final compared to v2.6_final for Barbados
2025-03-19
Johannes Gütschow
Change analysis for Barbados for PRIMAP-hist v2.6.1_final compared to v2.6_final
Overview over emissions by sector and gas
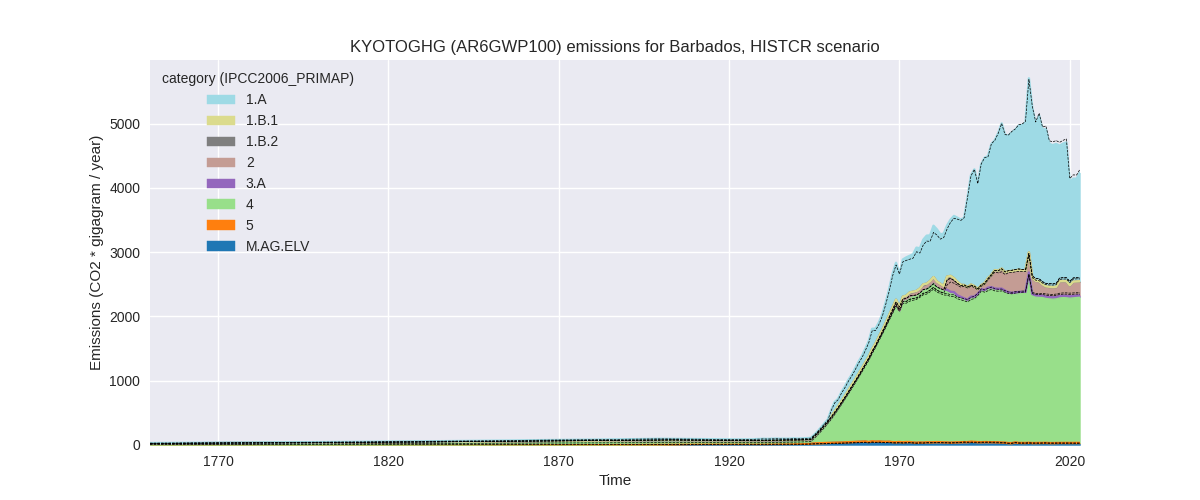
The following figures show the aggregate national total emissions excluding LULUCF AR6GWP100 for the country reported priority scenario. The dotted linesshow the v2.6_final data.
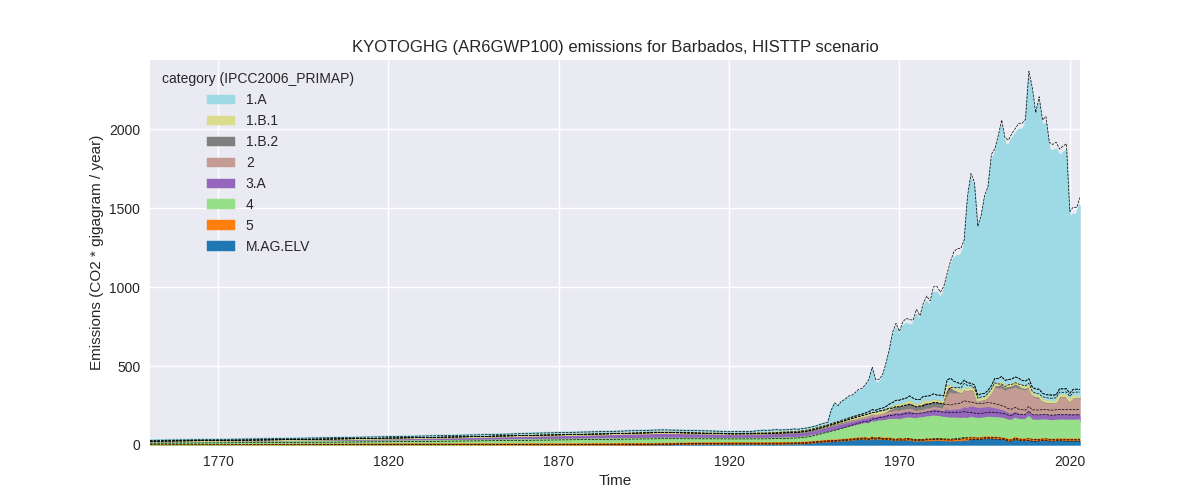
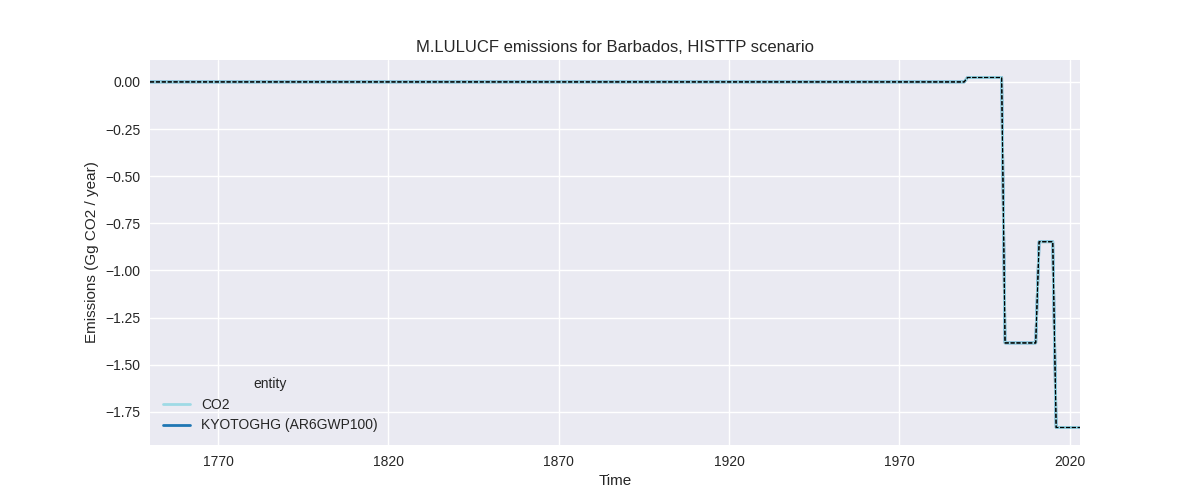
The following figures show the aggregate national total emissions excluding LULUCF AR6GWP100 for the third party priority scenario. The dotted linesshow the v2.6_final data.

Overview over changes
In the country reported priority scenario we have the following changes for aggregate Kyoto GHG and national total emissions excluding LULUCF (M.0.EL):
- Emissions in 2023 have changed by -1.2%% (-51.22 Gg CO2 / year)
- Emissions in 1990-2023 have changed by -0.5%% (-23.37 Gg CO2 / year)
In the third party priority scenario we have the following changes for aggregate Kyoto GHG and national total emissions excluding LULUCF (M.0.EL):
- Emissions in 2023 have changed by -3.0%% (-46.69 Gg CO2 / year)
- Emissions in 1990-2023 have changed by -2.3%% (-42.39 Gg CO2 / year)
Most important changes per scenario and time frame
In the country reported priority scenario the following sector-gas combinations have the highest absolute impact on national total KyotoGHG (AR6GWP100) emissions in 2023 (top 5):
- 1: 4, CH4 with -40.32 Gg CO2 / year (-1.7%)
- 2: 1.B.2, CH4 with -11.69 Gg CO2 / year (-73.7%)
- 3: 5, N2O with -1.61 Gg CO2 / year (-17.8%)
- 4: M.AG.ELV, N2O with 1.58 Gg CO2 / year (6.8%)
- 5: 2, CO2 with -1.37 Gg CO2 / year (-0.6%)
In the country reported priority scenario the following sector-gas combinations have the highest absolute impact on national total KyotoGHG (AR6GWP100) emissions in 1990-2023 (top 5):
- 1: 4, CH4 with -16.95 Gg CO2 / year (-0.7%)
- 2: 1.B.2, CH4 with -7.39 Gg CO2 / year (-31.4%)
- 3: 5, N2O with -2.46 Gg CO2 / year (-26.6%)
- 4: 1.B.2, CO2 with 2.43 Gg CO2 / year (346.4%)
- 5: M.AG.ELV, N2O with 0.74 Gg CO2 / year (2.7%)
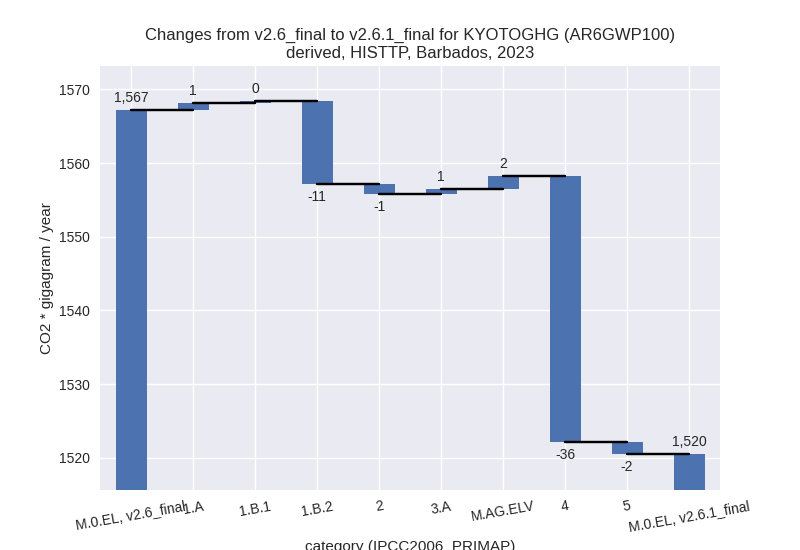
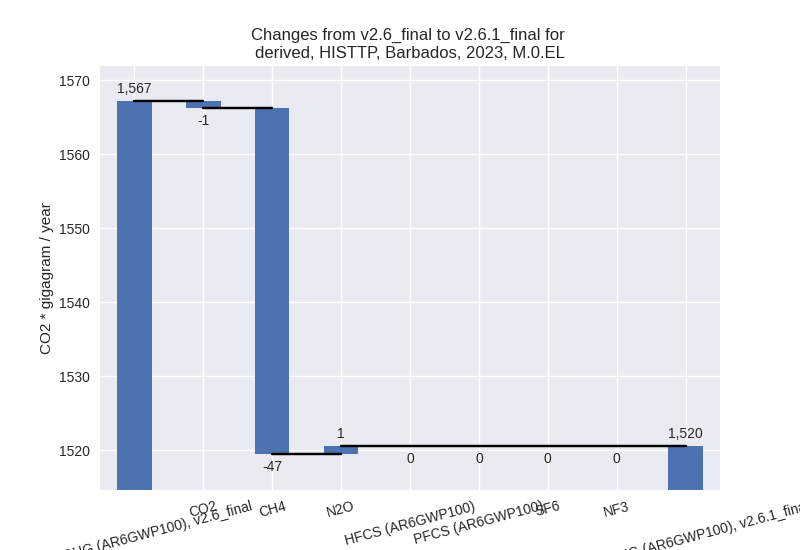
In the third party priority scenario the following sector-gas combinations have the highest absolute impact on national total KyotoGHG (AR6GWP100) emissions in 2023 (top 5):
- 1: 4, CH4 with -36.17 Gg CO2 / year (-23.9%)
- 2: 1.B.2, CH4 with -11.69 Gg CO2 / year (-73.7%)
- 3: M.AG.ELV, N2O with 1.71 Gg CO2 / year (6.8%)
- 4: 5, N2O with -1.61 Gg CO2 / year (-17.8%)
- 5: 2, CO2 with -1.37 Gg CO2 / year (-1.3%)
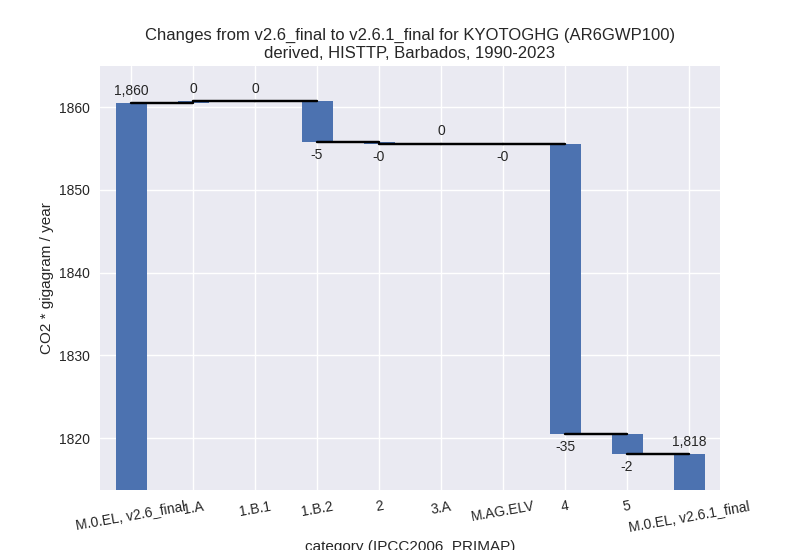
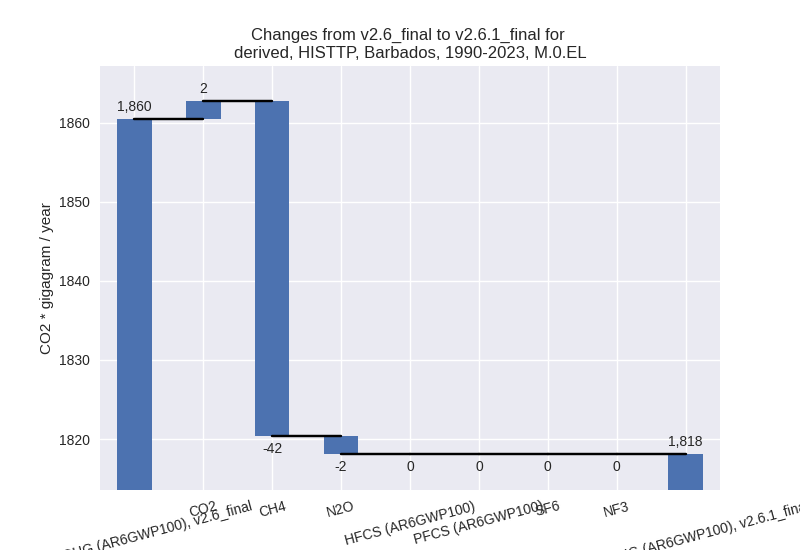
In the third party priority scenario the following sector-gas combinations have the highest absolute impact on national total KyotoGHG (AR6GWP100) emissions in 1990-2023 (top 5):
- 1: 4, CH4 with -35.05 Gg CO2 / year (-22.9%)
- 2: 1.B.2, CH4 with -7.39 Gg CO2 / year (-31.4%)
- 3: 5, N2O with -2.46 Gg CO2 / year (-26.6%)
- 4: 1.B.2, CO2 with 2.43 Gg CO2 / year (346.4%)
- 5: 1.A, N2O with 0.21 Gg CO2 / year (5.4%)
Notes on data changes
Here we list notes explaining important emissions changes for the country.
- No new country reported data for Barbados. Changes in the CR time-series are for the last years and sectors not covered by country reported emissions (e.g. 1.B.2, CH4)
- The highest absolute contribution comes from waste CH4 where EDGAR emissions are over 20% lower than in the previous version leading to lower PRIMAP-hist emissions in the TP scenario and also in the CR scenario for the periods of time not covered by country reported emissions.
Changes by sector and gas
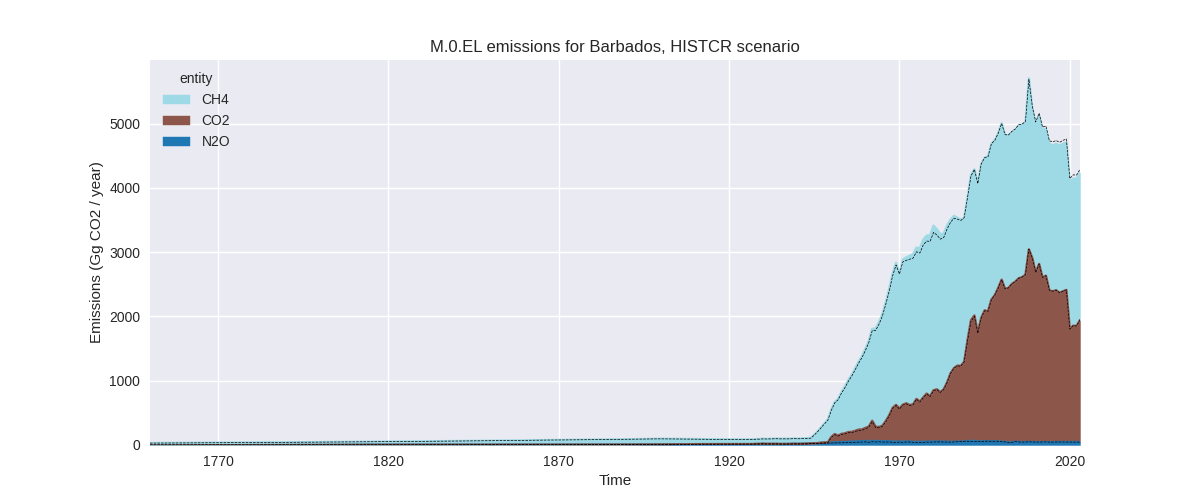
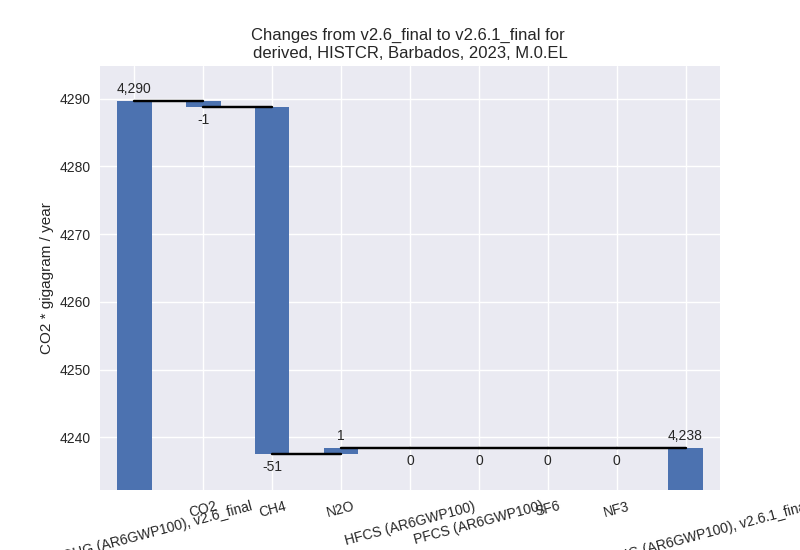
For each scenario and time frame the changes are displayed for all individual sectors and all individual gases. In the sector plot we use aggregate Kyoto GHGs in AR6GWP100. In the gas plot we usenational total emissions without LULUCF.
country reported scenario
2023
1990-2023

third party scenario
2023
1990-2023
Detailed changes for the scenarios:
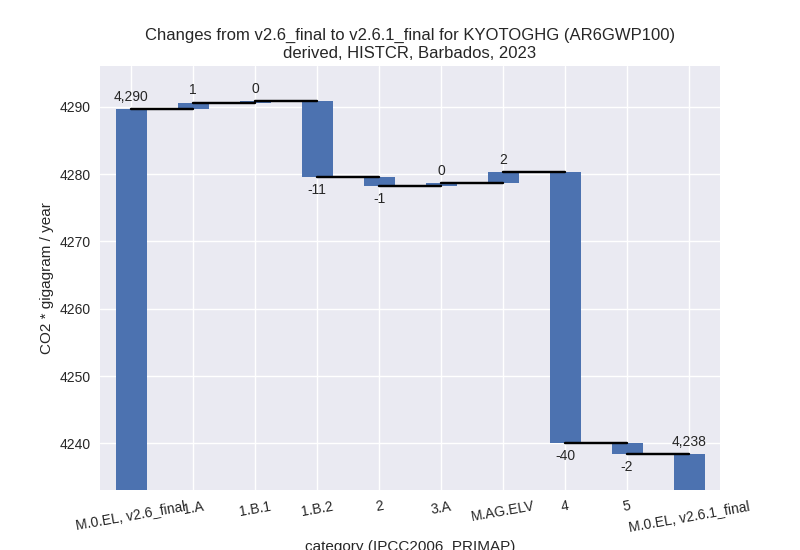
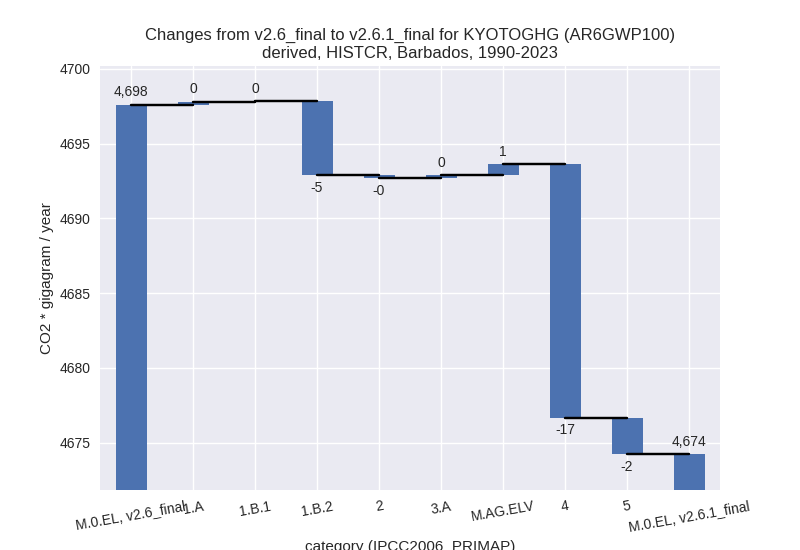
country reported scenario (HISTCR):
Most important changes per time frame
For 2023 the following sector-gas combinations have the highest absolute impact on national total KyotoGHG (AR6GWP100) emissions in 2023 (top 5):
- 1: 4, CH4 with -40.32 Gg CO2 / year (-1.7%)
- 2: 1.B.2, CH4 with -11.69 Gg CO2 / year (-73.7%)
- 3: 5, N2O with -1.61 Gg CO2 / year (-17.8%)
- 4: M.AG.ELV, N2O with 1.58 Gg CO2 / year (6.8%)
- 5: 2, CO2 with -1.37 Gg CO2 / year (-0.6%)
For 1990-2023 the following sector-gas combinations have the highest absolute impact on national total KyotoGHG (AR6GWP100) emissions in 1990-2023 (top 5):
- 1: 4, CH4 with -16.95 Gg CO2 / year (-0.7%)
- 2: 1.B.2, CH4 with -7.39 Gg CO2 / year (-31.4%)
- 3: 5, N2O with -2.46 Gg CO2 / year (-26.6%)
- 4: 1.B.2, CO2 with 2.43 Gg CO2 / year (346.4%)
- 5: M.AG.ELV, N2O with 0.74 Gg CO2 / year (2.7%)
Changes in the main sectors for aggregate KyotoGHG (AR6GWP100) are
- 1: Total sectoral emissions in 2022 are 1603.94 Gg CO2 / year which is 38.7% of M.0.EL emissions. 2023 Emissions have changed by -0.6% (-10.01 Gg CO2 / year). 1990-2023 Emissions have changed by -0.2% (-4.73 Gg CO2 / year).
- 2: Total sectoral emissions in 2022 are 213.70 Gg CO2 / year which is 5.2% of M.0.EL emissions. 2023 Emissions have changed by -0.6% (-1.37 Gg CO2 / year). 1990-2023 Emissions have changed by -0.1% (-0.16 Gg CO2 / year).
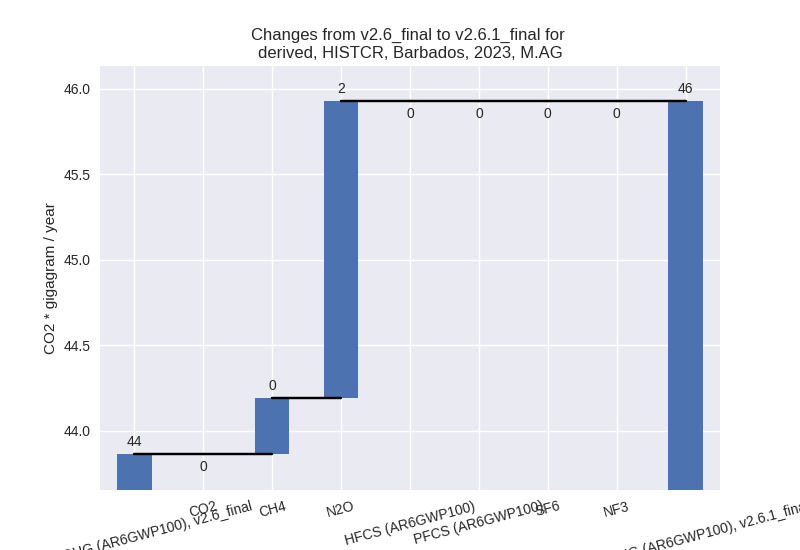
- M.AG: Total sectoral emissions in 2022 are 45.61 Gg
CO2 / year which is 1.1% of M.0.EL emissions. 2023 Emissions have
changed by 4.7% (2.06 Gg CO2 /
year). 1990-2023 Emissions have changed by 1.7% (0.92 Gg CO2 / year). For 2023 the
changes per gas
are:
The changes come from the following subsectors:- 3.A: Total sectoral emissions in 2022 are 20.84 Gg
CO2 / year which is 45.7% of category M.AG emissions. 2023 Emissions
have changed by 2.0% (0.42 Gg CO2 /
year). 1990-2023 Emissions have changed by 0.7% (0.17 Gg CO2 / year). For 2023 the
changes per gas
are:
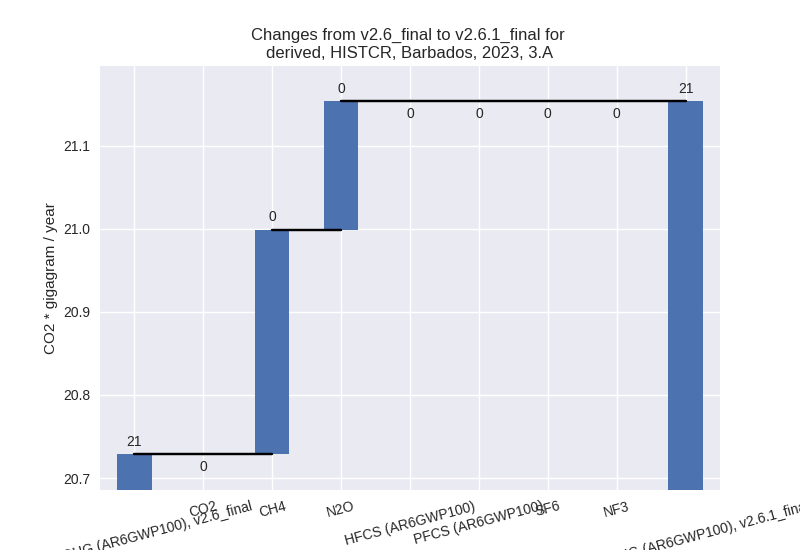
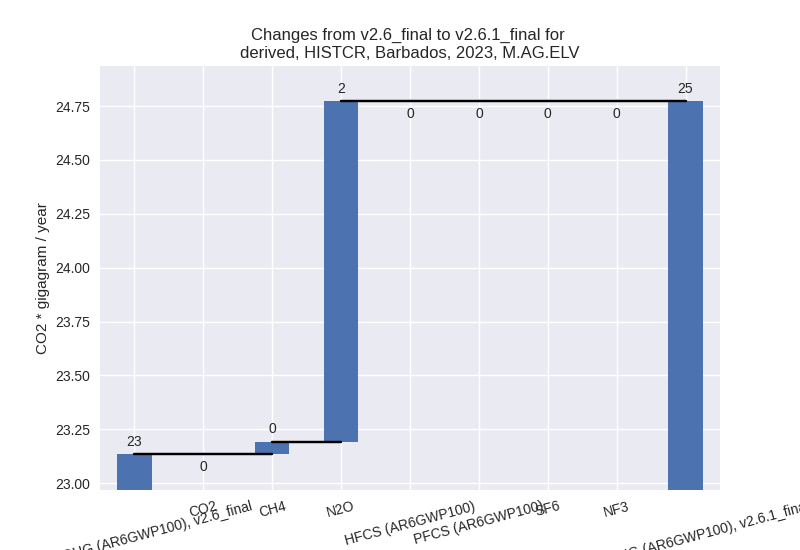
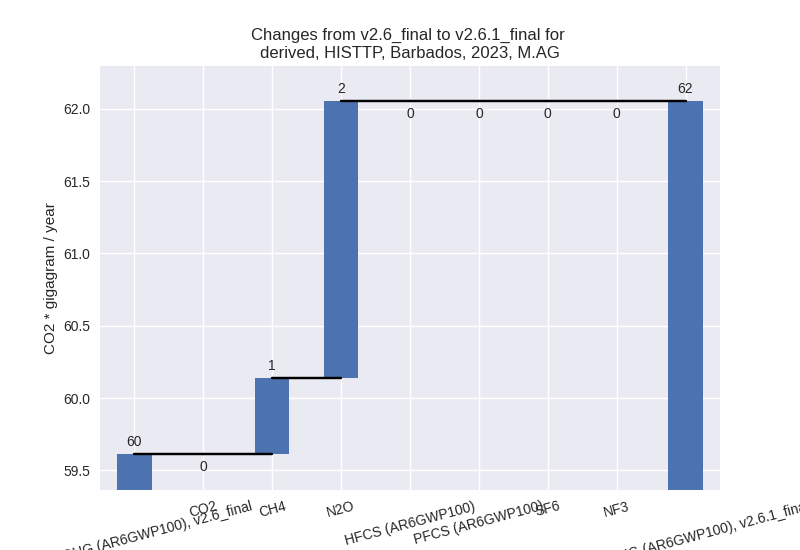
There is no subsector information available in PRIMAP-hist. - M.AG.ELV: Total sectoral emissions in 2022 are
24.77 Gg CO2 / year which is 54.3% of category M.AG emissions. 2023
Emissions have changed by 7.1% (1.64
Gg CO2 / year). 1990-2023 Emissions have changed by 2.6% (0.75 Gg CO2 / year). For 2023 the
changes per gas
are:
For 1990-2023 the changes per gas are: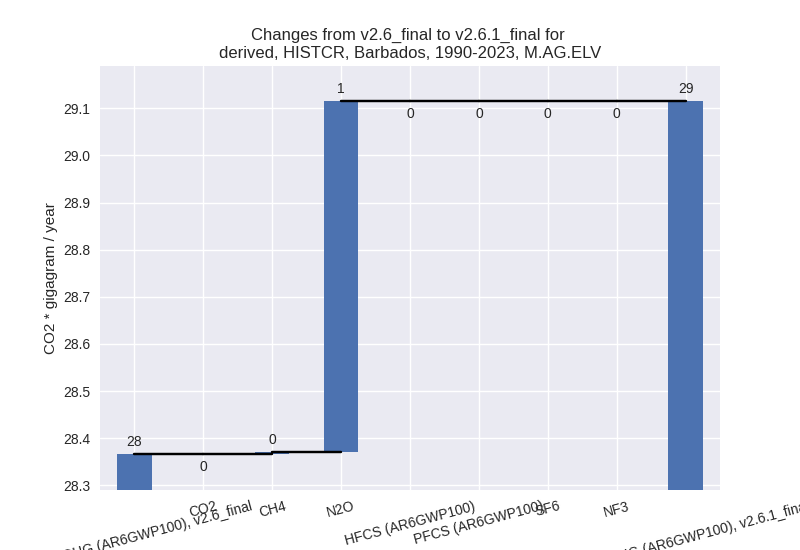
There is no subsector information available in PRIMAP-hist.
- 3.A: Total sectoral emissions in 2022 are 20.84 Gg
CO2 / year which is 45.7% of category M.AG emissions. 2023 Emissions
have changed by 2.0% (0.42 Gg CO2 /
year). 1990-2023 Emissions have changed by 0.7% (0.17 Gg CO2 / year). For 2023 the
changes per gas
are:
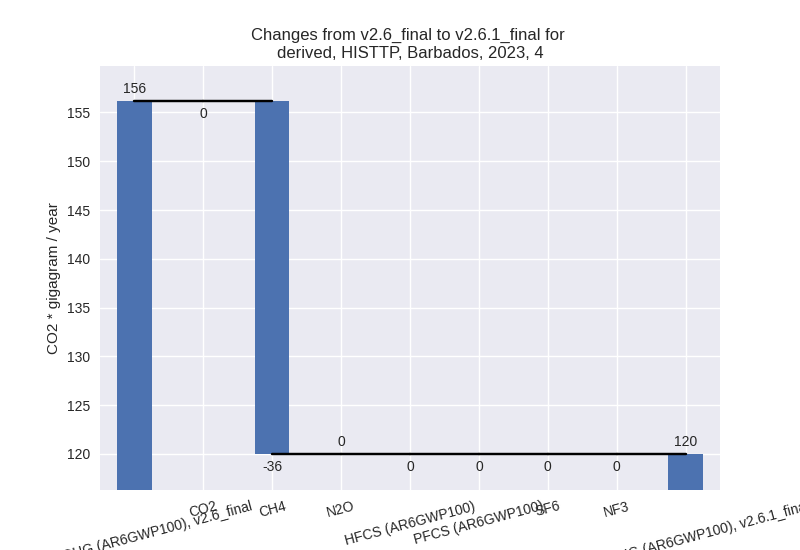
- 4: Total sectoral emissions in 2022 are 2271.16 Gg CO2 / year which is 54.8% of M.0.EL emissions. 2023 Emissions have changed by -1.7% (-40.29 Gg CO2 / year). 1990-2023 Emissions have changed by -0.7% (-16.95 Gg CO2 / year).
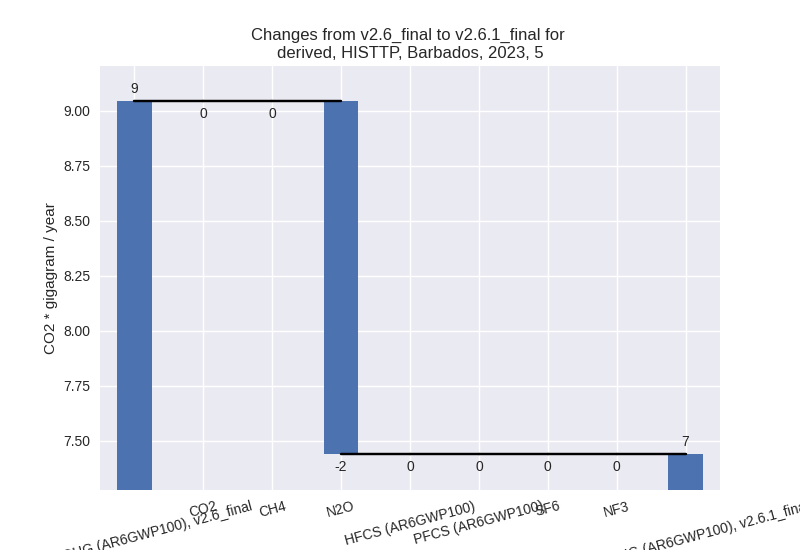
- 5: Total sectoral emissions in 2022 are 7.07 Gg CO2
/ year which is 0.2% of M.0.EL emissions. 2023 Emissions have changed by
-17.8% (-1.61 Gg CO2 / year).
1990-2023 Emissions have changed by -26.6% (-2.46 Gg CO2 / year). For 2023 the
changes per gas
are:

For 1990-2023 the changes per gas are:
third party scenario (HISTTP):
Most important changes per time frame
For 2023 the following sector-gas combinations have the highest absolute impact on national total KyotoGHG (AR6GWP100) emissions in 2023 (top 5):
- 1: 4, CH4 with -36.17 Gg CO2 / year (-23.9%)
- 2: 1.B.2, CH4 with -11.69 Gg CO2 / year (-73.7%)
- 3: M.AG.ELV, N2O with 1.71 Gg CO2 / year (6.8%)
- 4: 5, N2O with -1.61 Gg CO2 / year (-17.8%)
- 5: 2, CO2 with -1.37 Gg CO2 / year (-1.3%)
For 1990-2023 the following sector-gas combinations have the highest absolute impact on national total KyotoGHG (AR6GWP100) emissions in 1990-2023 (top 5):
- 1: 4, CH4 with -35.05 Gg CO2 / year (-22.9%)
- 2: 1.B.2, CH4 with -7.39 Gg CO2 / year (-31.4%)
- 3: 5, N2O with -2.46 Gg CO2 / year (-26.6%)
- 4: 1.B.2, CO2 with 2.43 Gg CO2 / year (346.4%)
- 5: 1.A, N2O with 0.21 Gg CO2 / year (5.4%)
Changes in the main sectors for aggregate KyotoGHG (AR6GWP100) are
- 1: Total sectoral emissions in 2022 are 1155.42 Gg CO2 / year which is 79.6% of M.0.EL emissions. 2023 Emissions have changed by -0.8% (-10.01 Gg CO2 / year). 1990-2023 Emissions have changed by -0.3% (-4.73 Gg CO2 / year).
- 2: Total sectoral emissions in 2022 are 108.59 Gg CO2 / year which is 7.5% of M.0.EL emissions. 2023 Emissions have changed by -1.3% (-1.37 Gg CO2 / year). 1990-2023 Emissions have changed by -0.1% (-0.16 Gg CO2 / year).
- M.AG: Total sectoral emissions in 2022 are 61.51 Gg
CO2 / year which is 4.2% of M.0.EL emissions. 2023 Emissions have
changed by 4.1% (2.44 Gg CO2 /
year). 1990-2023 Emissions have changed by 0.0% (0.00 Gg CO2 / year). For 2023 the
changes per gas
are:
The changes come from the following subsectors:- 3.A: Total sectoral emissions in 2022 are 34.71 Gg CO2 / year which is 56.4% of category M.AG emissions. 2023 Emissions have changed by 1.9% (0.67 Gg CO2 / year). 1990-2023 Emissions have changed by 0.0% (0.01 Gg CO2 / year).
- M.AG.ELV: Total sectoral emissions in 2022 are
26.80 Gg CO2 / year which is 43.6% of category M.AG emissions. 2023
Emissions have changed by 7.1% (1.77
Gg CO2 / year). 1990-2023 Emissions have changed by -0.0% (-0.01 Gg CO2 / year). For 2023 the
changes per gas
are:

There is no subsector information available in PRIMAP-hist.
- 4: Total sectoral emissions in 2022 are 119.81 Gg
CO2 / year which is 8.2% of M.0.EL emissions. 2023 Emissions have
changed by -23.1% (-36.14 Gg CO2 /
year). 1990-2023 Emissions have changed by -22.3% (-35.05 Gg CO2 / year). For 2023
the changes per gas
are:
For 1990-2023 the changes per gas are:
- 5: Total sectoral emissions in 2022 are 7.07 Gg CO2
/ year which is 0.5% of M.0.EL emissions. 2023 Emissions have changed by
-17.8% (-1.61 Gg CO2 / year).
1990-2023 Emissions have changed by -26.6% (-2.46 Gg CO2 / year). For 2023 the
changes per gas
are:
For 1990-2023 the changes per gas are: