Changes in PRIMAP-hist v2.6.1_final compared to v2.6_final for Bhutan
2025-03-19
Johannes Gütschow
Change analysis for Bhutan for PRIMAP-hist v2.6.1_final compared to v2.6_final
Overview over emissions by sector and gas
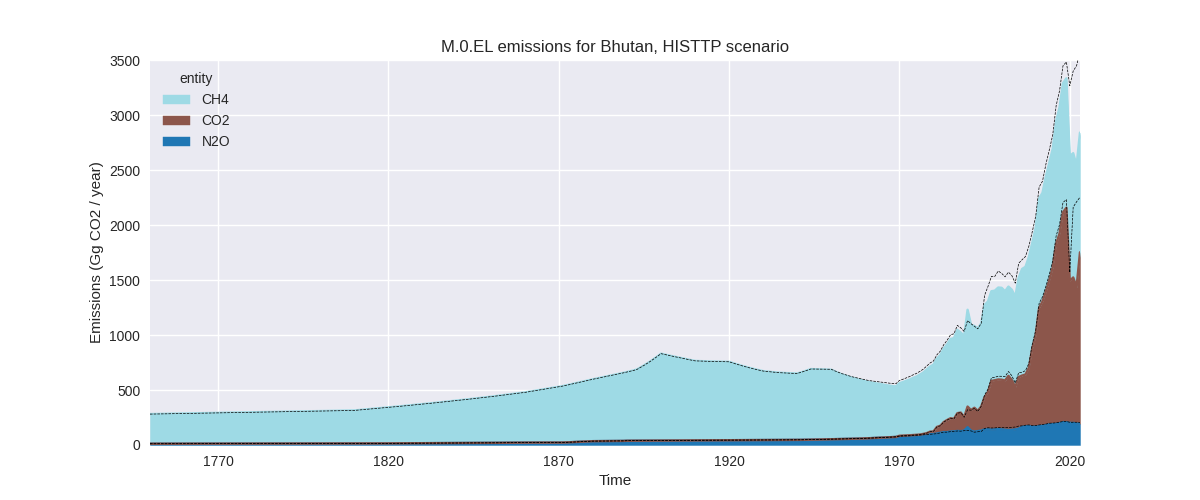
The following figures show the aggregate national total emissions excluding LULUCF AR6GWP100 for the country reported priority scenario. The dotted linesshow the v2.6_final data.
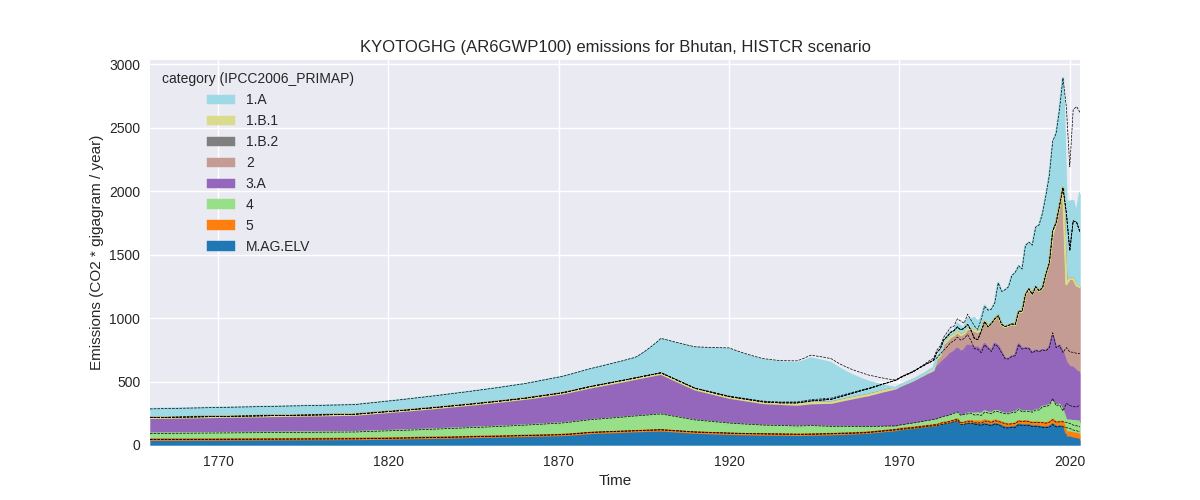
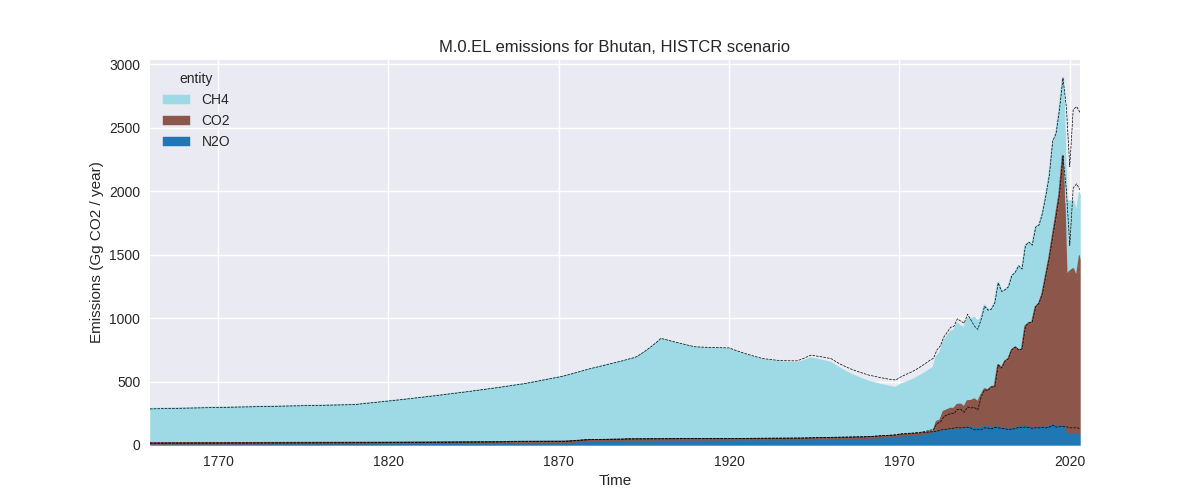
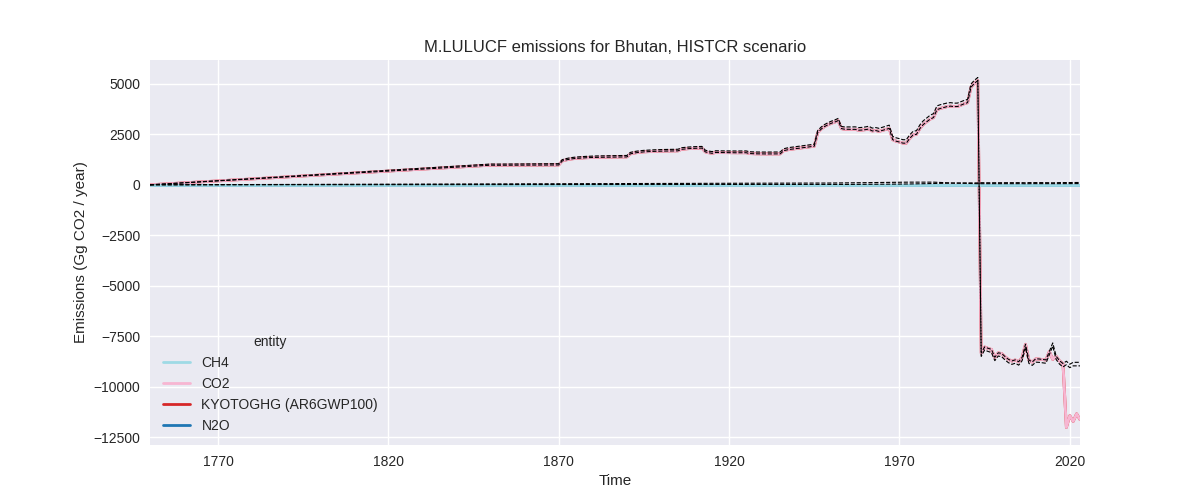
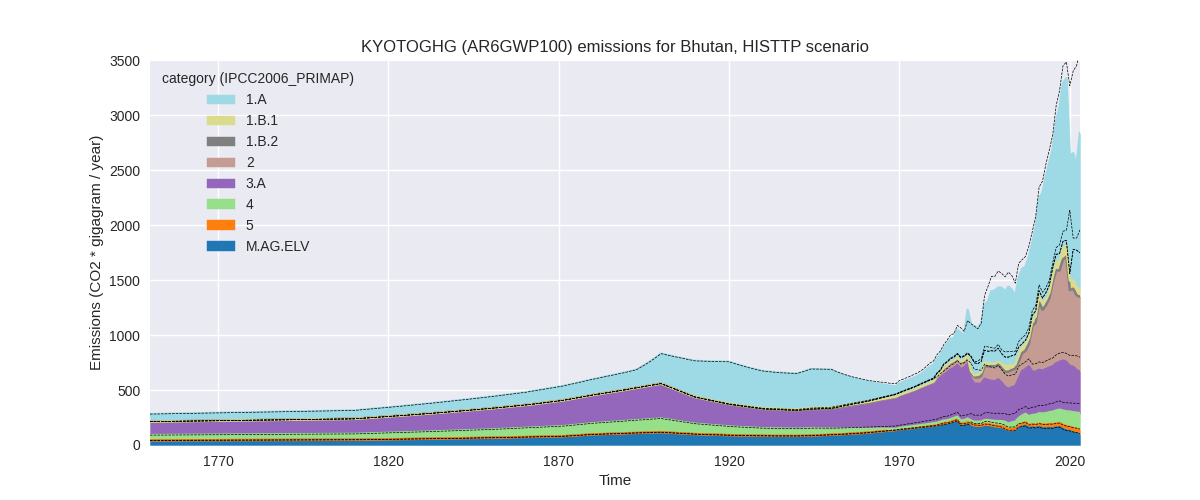
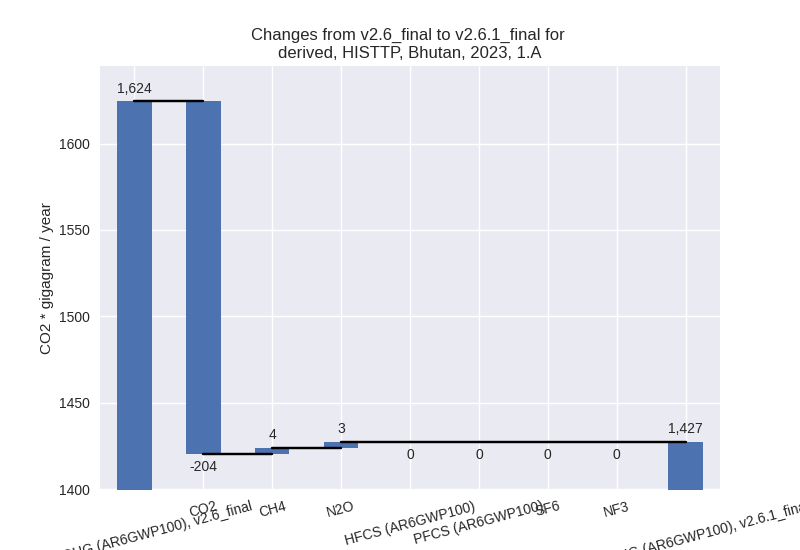
The following figures show the aggregate national total emissions excluding LULUCF AR6GWP100 for the third party priority scenario. The dotted linesshow the v2.6_final data.
Overview over changes
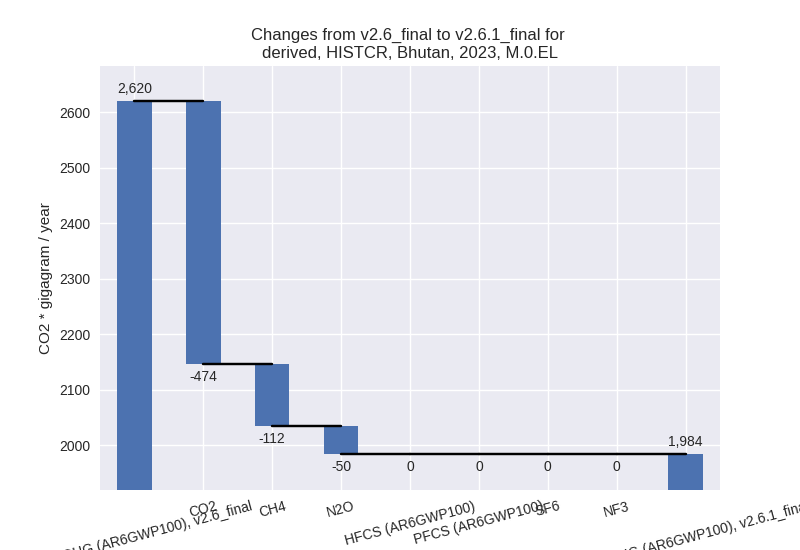
In the country reported priority scenario we have the following changes for aggregate Kyoto GHG and national total emissions excluding LULUCF (M.0.EL):
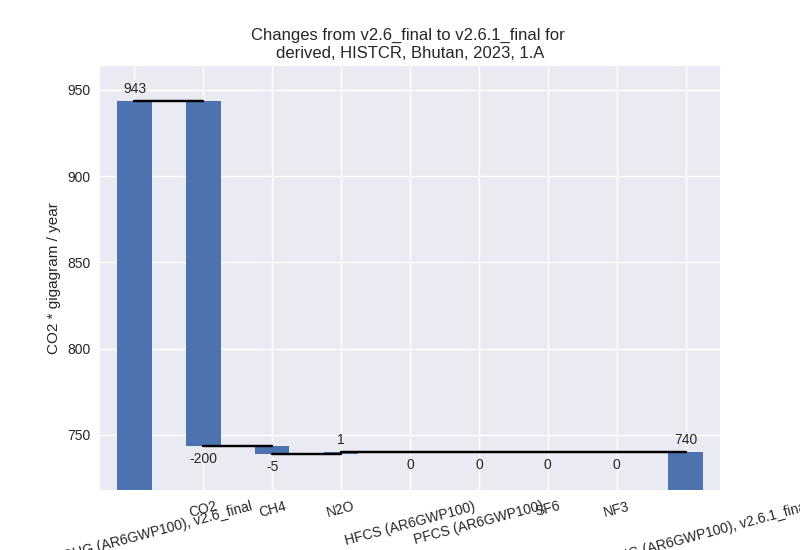
- Emissions in 2023 have changed by -24.3%% (-635.98 Gg CO2 / year)
- Emissions in 1990-2023 have changed by -5.6%% (-94.46 Gg CO2 / year)
In the third party priority scenario we have the following changes for aggregate Kyoto GHG and national total emissions excluding LULUCF (M.0.EL):
- Emissions in 2023 have changed by -20.6%% (-739.57 Gg CO2 / year)
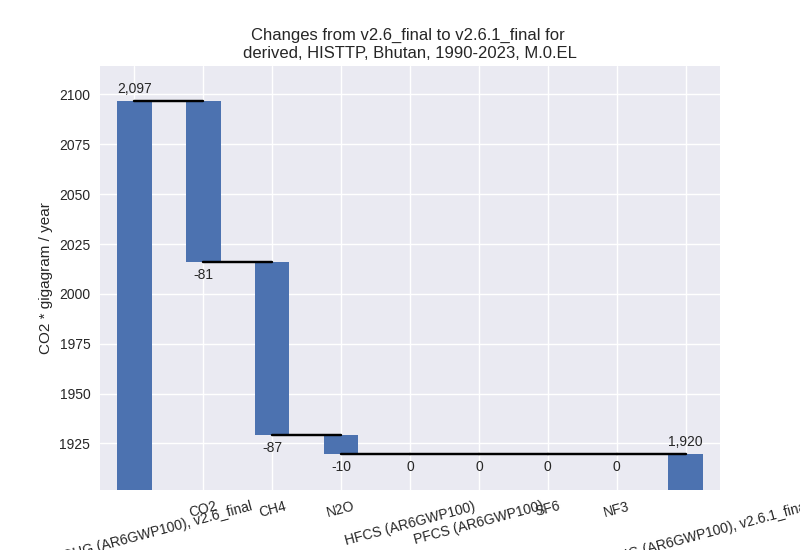
- Emissions in 1990-2023 have changed by -8.4%% (-176.97 Gg CO2 / year)
Most important changes per scenario and time frame
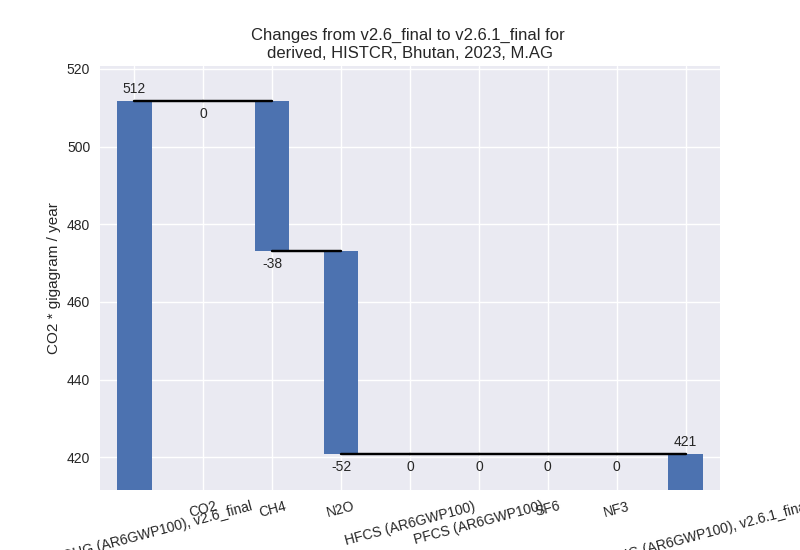
In the country reported priority scenario the following sector-gas combinations have the highest absolute impact on national total KyotoGHG (AR6GWP100) emissions in 2023 (top 5):
- 1: 2, CO2 with -274.28 Gg CO2 / year (-28.9%)
- 2: 1.A, CO2 with -199.85 Gg CO2 / year (-21.5%)
- 3: 4, CH4 with -65.55 Gg CO2 / year (-39.2%)
- 4: M.AG.ELV, N2O with -52.89 Gg CO2 / year (-76.3%)
- 5: 3.A, CH4 with -24.81 Gg CO2 / year (-6.3%)
In the country reported priority scenario the following sector-gas combinations have the highest absolute impact on national total KyotoGHG (AR6GWP100) emissions in 1990-2023 (top 5):
- 1: 2, CO2 with -38.05 Gg CO2 / year (-7.9%)
- 2: 1.A, CO2 with -32.89 Gg CO2 / year (-7.7%)
- 3: M.AG.ELV, N2O with -8.57 Gg CO2 / year (-10.3%)
- 4: 4, CH4 with -6.64 Gg CO2 / year (-6.9%)
- 5: 3.A, CH4 with -5.21 Gg CO2 / year (-1.1%)
In the third party priority scenario the following sector-gas combinations have the highest absolute impact on national total KyotoGHG (AR6GWP100) emissions in 2023 (top 5):
- 1: 2, CO2 with -263.52 Gg CO2 / year (-28.0%)
- 2: 1.A, CO2 with -204.26 Gg CO2 / year (-18.9%)
- 3: 1.B.1, CH4 with -117.46 Gg CO2 / year (-64.4%)
- 4: 4, CH4 with -74.43 Gg CO2 / year (-33.5%)
- 5: 3.A, CH4 with -45.13 Gg CO2 / year (-10.8%)
In the third party priority scenario the following sector-gas combinations have the highest absolute impact on national total KyotoGHG (AR6GWP100) emissions in 1990-2023 (top 5):
- 1: 4, CH4 with -57.80 Gg CO2 / year (-42.3%)
- 2: 2, CO2 with -47.57 Gg CO2 / year (-11.3%)
- 3: 1.A, CO2 with -30.77 Gg CO2 / year (-6.6%)
- 4: 3.A, CH4 with -27.68 Gg CO2 / year (-6.7%)
- 5: 1.A, CH4 with 17.78 Gg CO2 / year (5.2%)
Notes on data changes
Here we list notes explaining important emissions changes for the country.
- CRT data from BTR1 covering 2019-2022 has been added. It replaces
BUR1 for 2019-2020 and extends BUR1 for 2021-2022. BUR1 still used for
1994-2018. BUR1 data downscaled to sectors and gases using CRT1. As
there is a mistake in livestock data in the CRT data (emissions from
cattle are missing) we use a different approach for emissions in 3.A:
BUR1 data is downscaled using DI data for 2015.
- The new data introduces changes for most sectors and gases which also affect data for earlier years as the CRT data is used as a downscaling key for the BUR data.
- Changes in the TP time series are mostly due to changes in EDGAR and
FAO data, but also from country reported data, namely for CO2 1.A where
country reported data is used to extrapolate CDIAC as Bhutan is not
included in the EI data.
- In the FAO dataset agricultural emissions are incomplete for 1991-2005. We have removed FAO data for these years and interpolated with EDGAR (which is quite low for these years as well, so the activity data underlying the EDGAR dataset might also be incomplete)
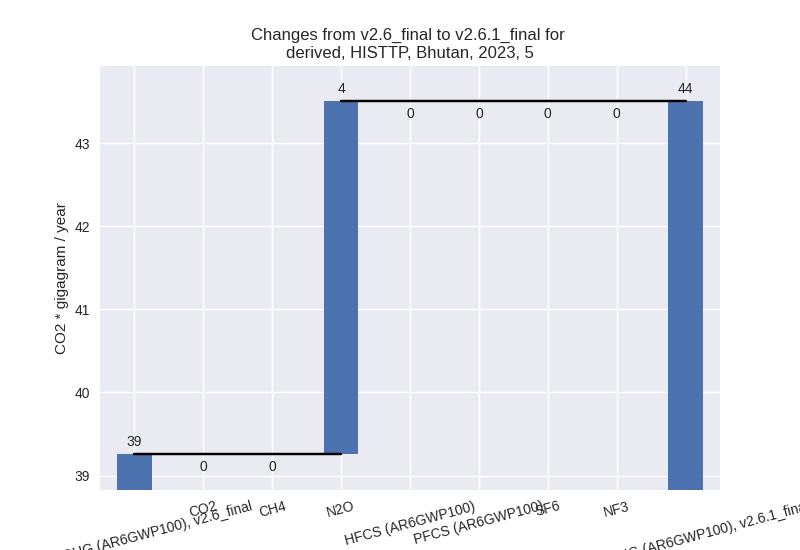
Changes by sector and gas
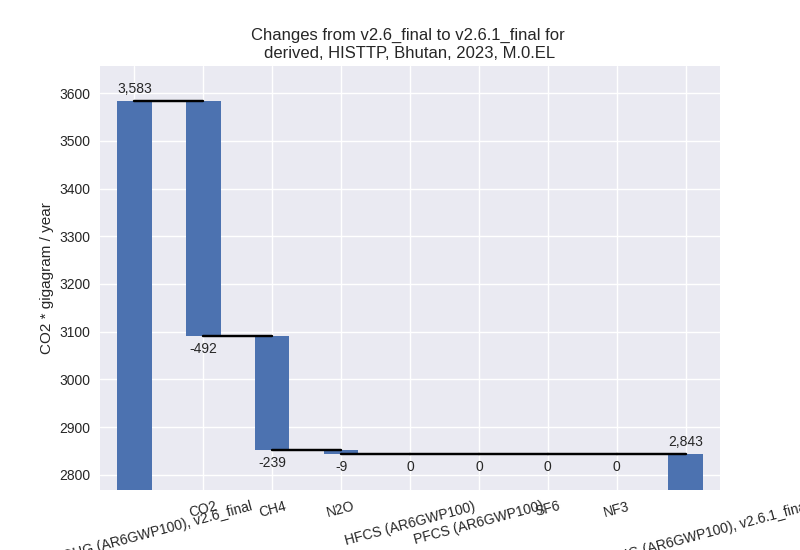
For each scenario and time frame the changes are displayed for all individual sectors and all individual gases. In the sector plot we use aggregate Kyoto GHGs in AR6GWP100. In the gas plot we usenational total emissions without LULUCF.
country reported scenario
2023

1990-2023

third party scenario
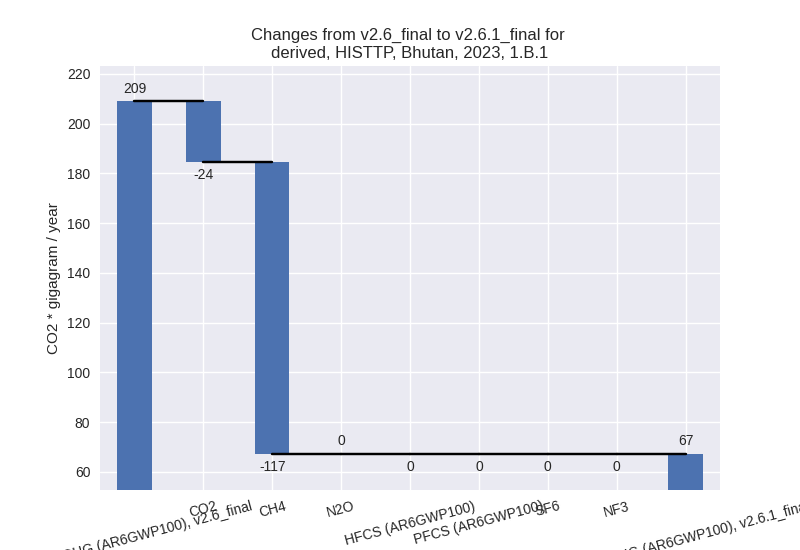
2023
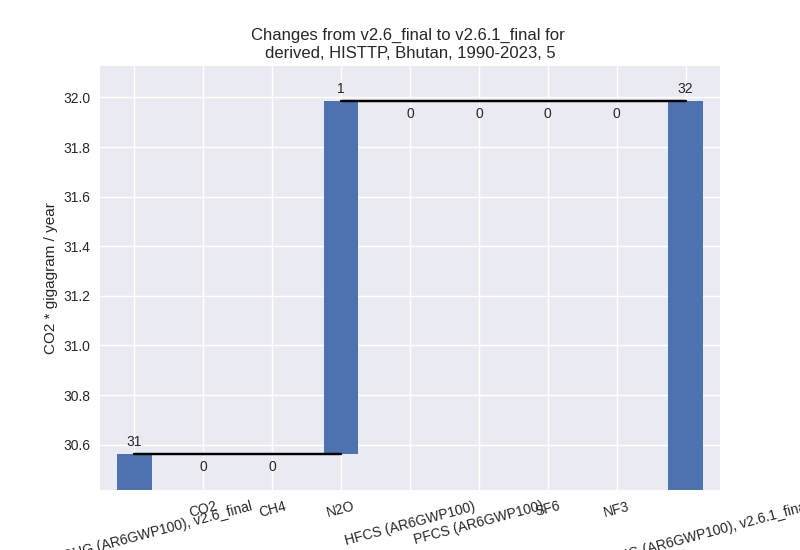
1990-2023
Detailed changes for the scenarios:
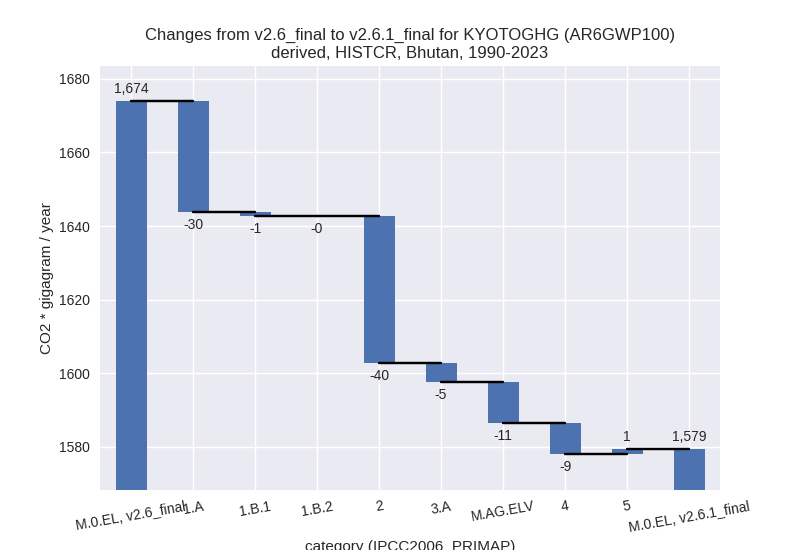
country reported scenario (HISTCR):
Most important changes per time frame
For 2023 the following sector-gas combinations have the highest absolute impact on national total KyotoGHG (AR6GWP100) emissions in 2023 (top 5):
- 1: 2, CO2 with -274.28 Gg CO2 / year (-28.9%)
- 2: 1.A, CO2 with -199.85 Gg CO2 / year (-21.5%)
- 3: 4, CH4 with -65.55 Gg CO2 / year (-39.2%)
- 4: M.AG.ELV, N2O with -52.89 Gg CO2 / year (-76.3%)
- 5: 3.A, CH4 with -24.81 Gg CO2 / year (-6.3%)
For 1990-2023 the following sector-gas combinations have the highest absolute impact on national total KyotoGHG (AR6GWP100) emissions in 1990-2023 (top 5):
- 1: 2, CO2 with -38.05 Gg CO2 / year (-7.9%)
- 2: 1.A, CO2 with -32.89 Gg CO2 / year (-7.7%)
- 3: M.AG.ELV, N2O with -8.57 Gg CO2 / year (-10.3%)
- 4: 4, CH4 with -6.64 Gg CO2 / year (-6.9%)
- 5: 3.A, CH4 with -5.21 Gg CO2 / year (-1.1%)
Changes in the main sectors for aggregate KyotoGHG (AR6GWP100) are
- 1: Total sectoral emissions in 2022 are 559.93 Gg
CO2 / year which is 30.8% of M.0.EL emissions. 2023 Emissions have
changed by -21.5% (-203.00 Gg CO2 /
year). 1990-2023 Emissions have changed by -7.1% (-31.12 Gg CO2 / year). For 2023 the
changes per gas
are:

For 1990-2023 the changes per gas are: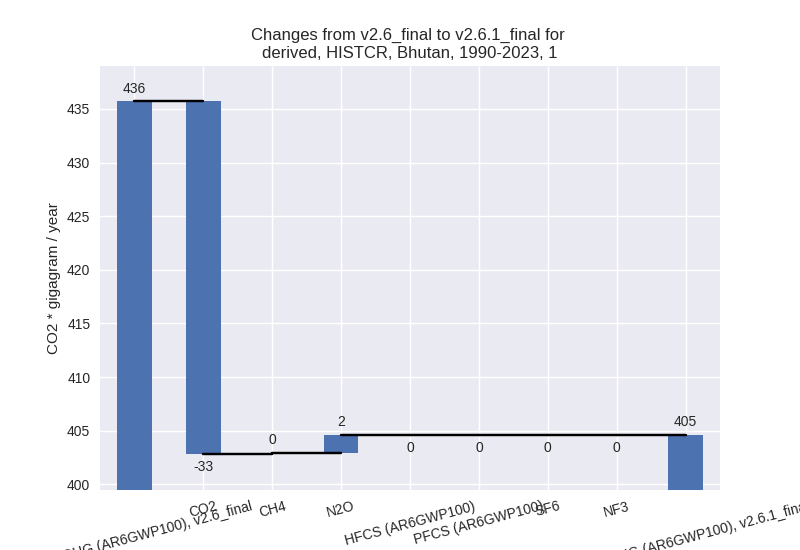
The changes come from the following subsectors:- 1.A: Total sectoral emissions in 2022 are 559.24 Gg
CO2 / year which is 99.9% of category 1 emissions. 2023 Emissions have
changed by -21.5% (-203.25 Gg CO2 /
year). 1990-2023 Emissions have changed by -6.9% (-30.13 Gg CO2 / year). For 2023 the
changes per gas
are:
For 1990-2023 the changes per gas are: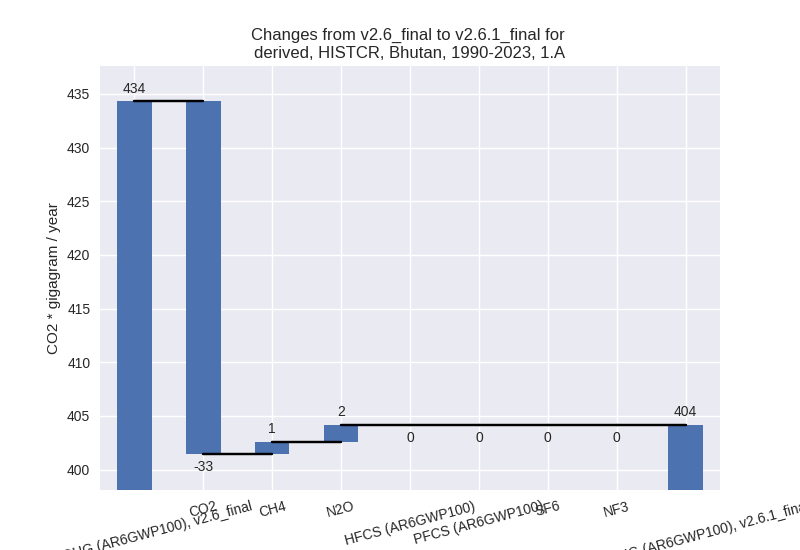
There is no subsector information available in PRIMAP-hist. - 1.B.1: Total sectoral emissions in 2022 are 0.68 Gg
CO2 / year which is 0.1% of category 1 emissions. 2023 Emissions have
changed by 61.5% (0.25 Gg CO2 /
year). 1990-2023 Emissions have changed by -70.8% (-0.99 Gg CO2 / year). For 2023 the
changes per gas
are:
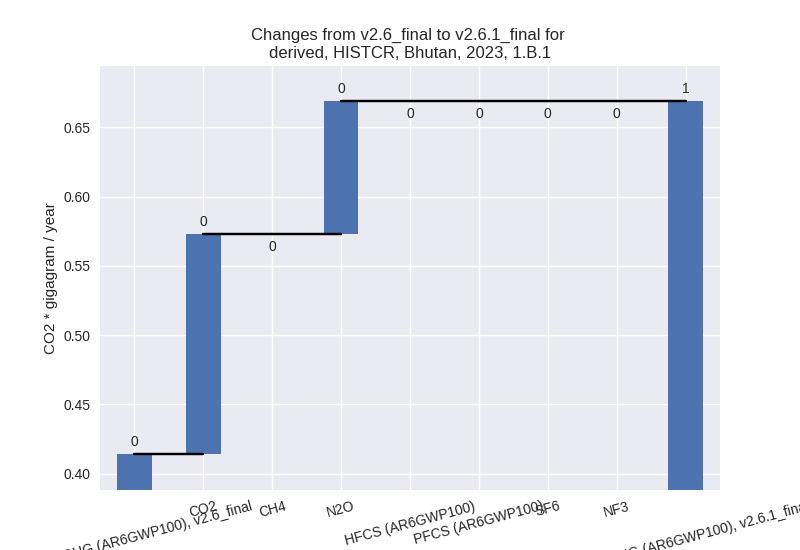
For 1990-2023 the changes per gas are: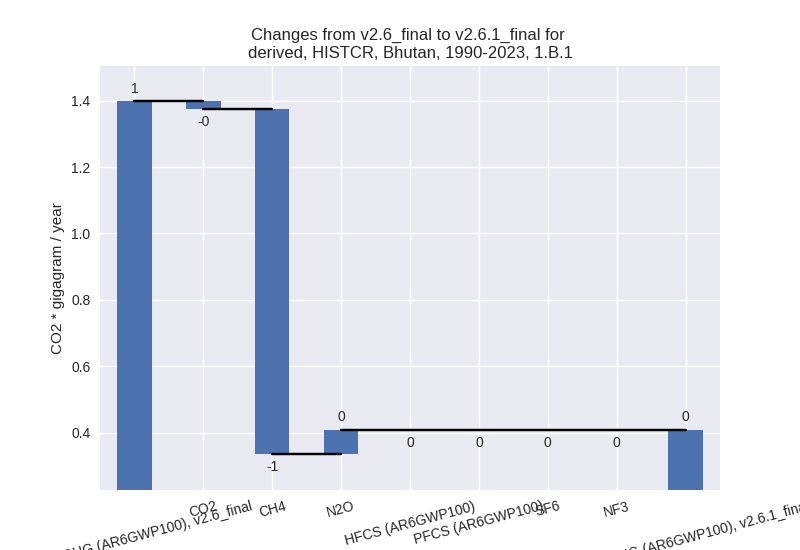
There is no subsector information available in PRIMAP-hist. - 1.B.2: Total sectoral emissions in 2022 are 0.01 Gg
CO2 / year which is 0.0% of category 1 emissions. 2023 Emissions have
changed by -23.5% (-0.00 Gg CO2 /
year). 1990-2023 Emissions have changed by -7.7% (-0.00 Gg CO2 / year). For 2023 the
changes per gas
are:

For 1990-2023 the changes per gas are: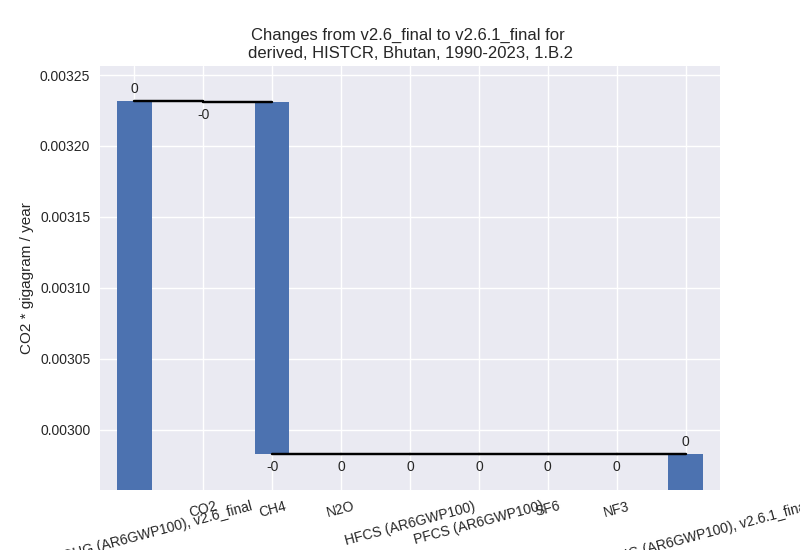
There is no subsector information available in PRIMAP-hist.
- 1.A: Total sectoral emissions in 2022 are 559.24 Gg
CO2 / year which is 99.9% of category 1 emissions. 2023 Emissions have
changed by -21.5% (-203.25 Gg CO2 /
year). 1990-2023 Emissions have changed by -6.9% (-30.13 Gg CO2 / year). For 2023 the
changes per gas
are:
- 2: Total sectoral emissions in 2022 are 677.18 Gg
CO2 / year which is 37.3% of M.0.EL emissions. 2023 Emissions have
changed by -29.1% (-277.49 Gg CO2 /
year). 1990-2023 Emissions have changed by -8.3% (-39.98 Gg CO2 / year). For 2023 the
changes per gas
are:
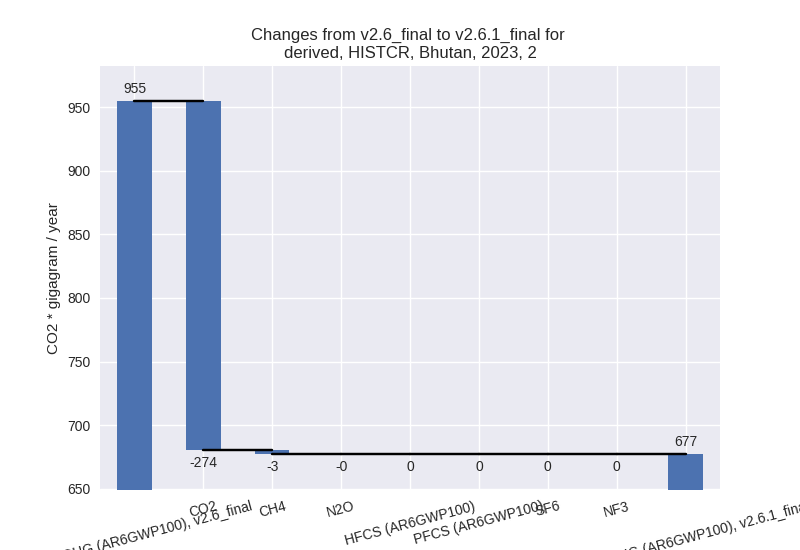
For 1990-2023 the changes per gas are: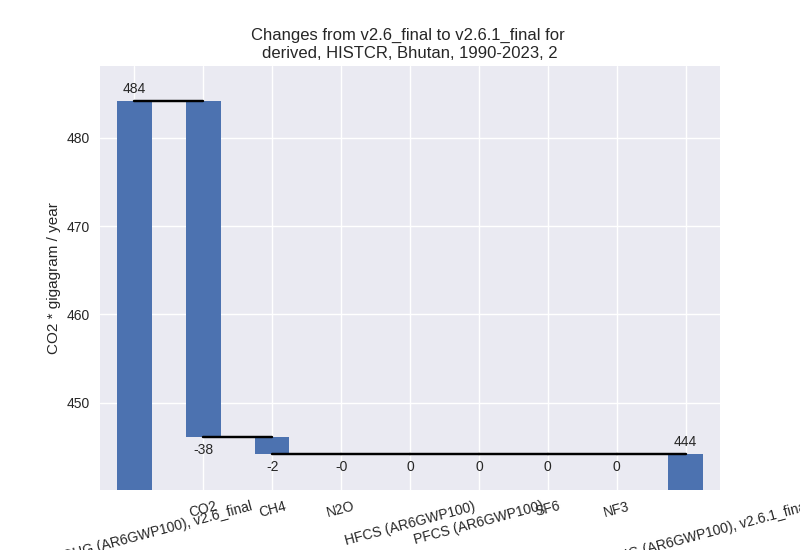
- M.AG: Total sectoral emissions in 2022 are 436.89
Gg CO2 / year which is 24.1% of M.0.EL emissions. 2023 Emissions have
changed by -17.8% (-90.86 Gg CO2 /
year). 1990-2023 Emissions have changed by -2.6% (-16.22 Gg CO2 / year). For 2023 the
changes per gas
are:
For 1990-2023 the changes per gas are: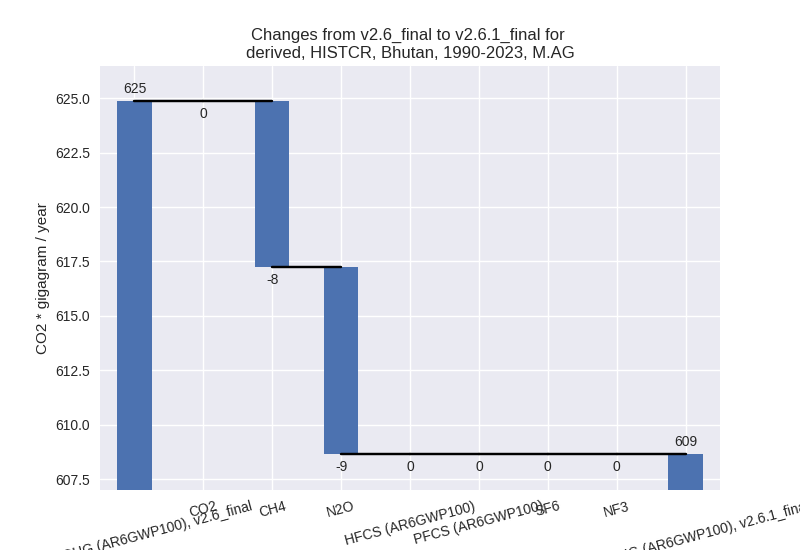
The changes come from the following subsectors:- 3.A: Total sectoral emissions in 2022 are 392.05 Gg
CO2 / year which is 89.7% of category M.AG emissions. 2023 Emissions
have changed by -6.0% (-24.29 Gg CO2
/ year). 1990-2023 Emissions have changed by -1.1% (-5.23 Gg CO2 / year). For 2023 the
changes per gas
are:

There is no subsector information available in PRIMAP-hist. - M.AG.ELV: Total sectoral emissions in 2022 are
44.84 Gg CO2 / year which is 10.3% of category M.AG emissions. 2023
Emissions have changed by -64.1%
(-66.57 Gg CO2 / year). 1990-2023 Emissions have changed by -7.5% (-10.99 Gg CO2 / year). For 2023 the
changes per gas
are:
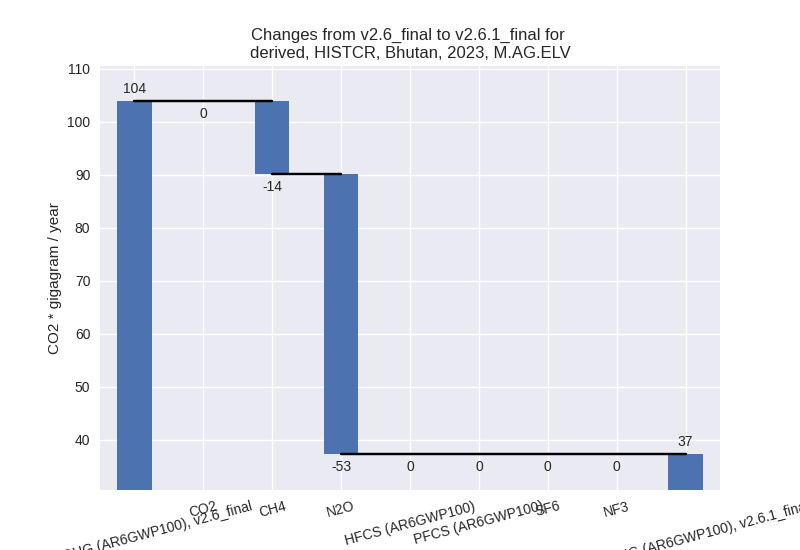
For 1990-2023 the changes per gas are: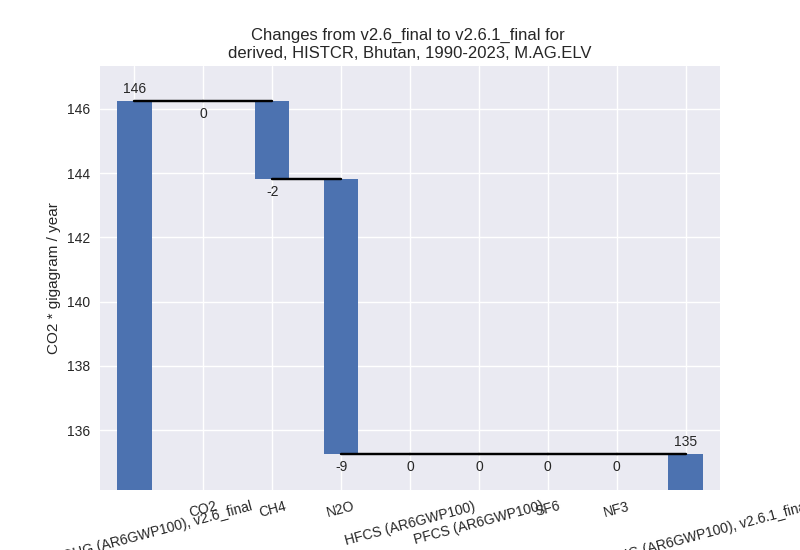
There is no subsector information available in PRIMAP-hist.
- 3.A: Total sectoral emissions in 2022 are 392.05 Gg
CO2 / year which is 89.7% of category M.AG emissions. 2023 Emissions
have changed by -6.0% (-24.29 Gg CO2
/ year). 1990-2023 Emissions have changed by -1.1% (-5.23 Gg CO2 / year). For 2023 the
changes per gas
are:
- 4: Total sectoral emissions in 2022 are 98.66 Gg
CO2 / year which is 5.4% of M.0.EL emissions. 2023 Emissions have
changed by -40.4% (-68.88 Gg CO2 /
year). 1990-2023 Emissions have changed by -8.7% (-8.57 Gg CO2 / year). For 2023 the
changes per gas
are:

For 1990-2023 the changes per gas are: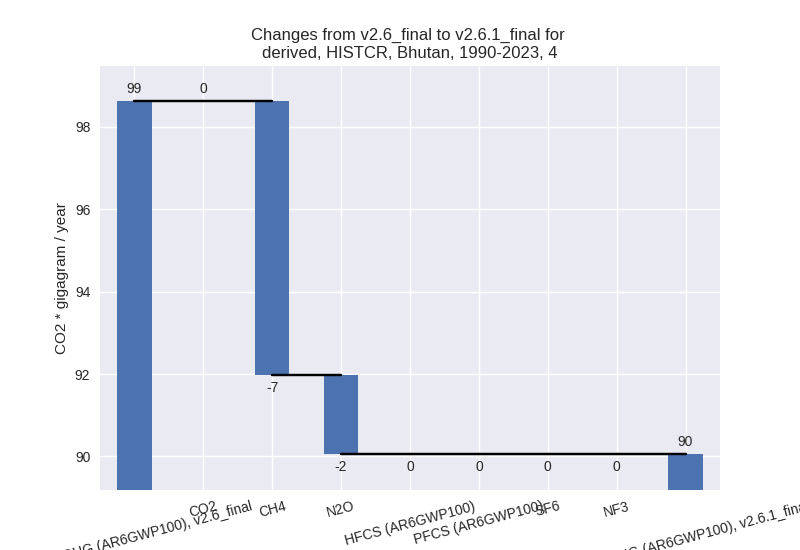
- 5: Total sectoral emissions in 2022 are 42.76 Gg
CO2 / year which is 2.4% of M.0.EL emissions. 2023 Emissions have
changed by 10.8% (4.25 Gg CO2 /
year). 1990-2023 Emissions have changed by 4.7% (1.42 Gg CO2 / year). For 2023 the
changes per gas
are:

For 1990-2023 the changes per gas are: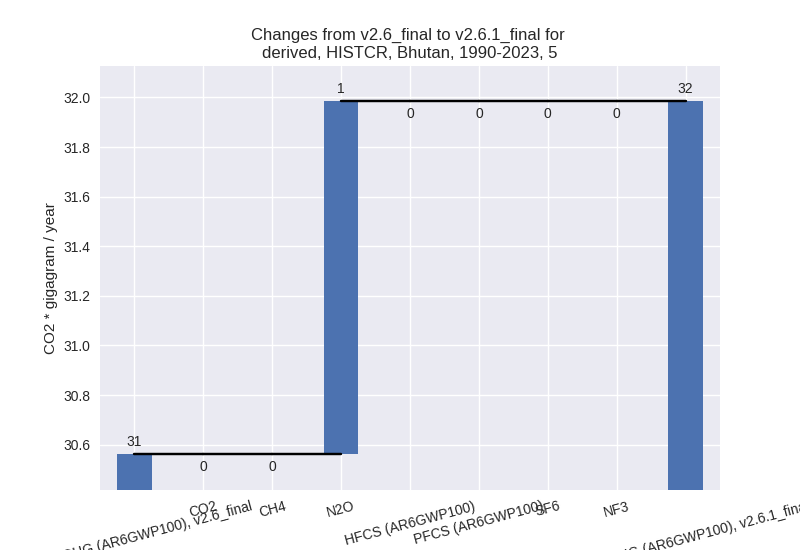
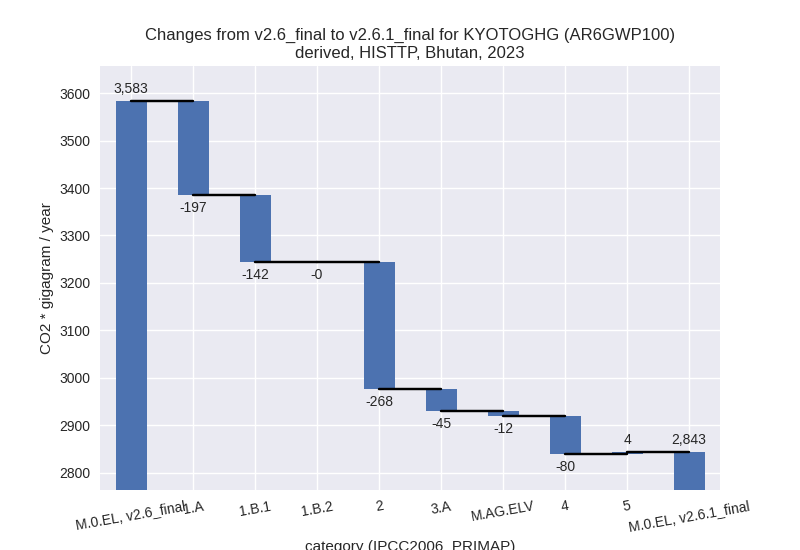
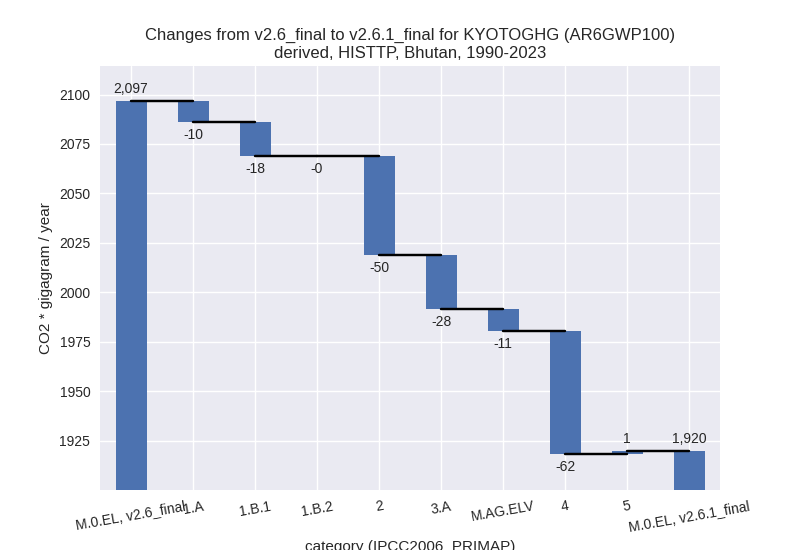
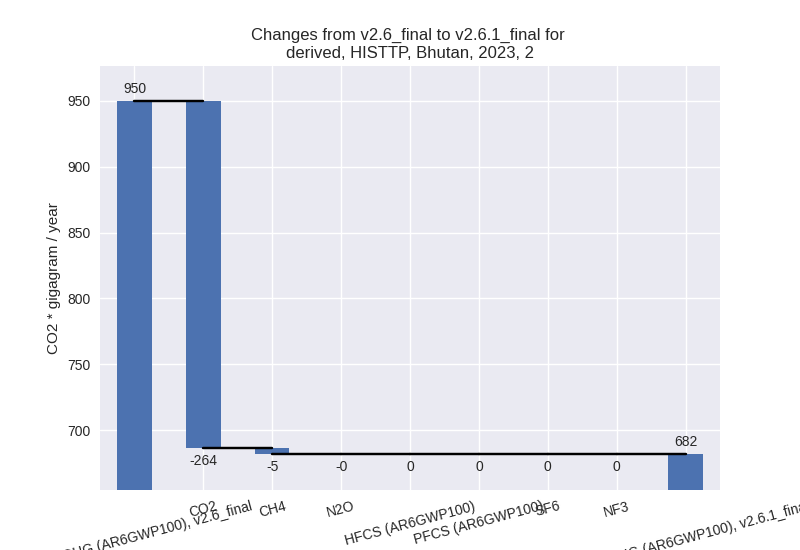
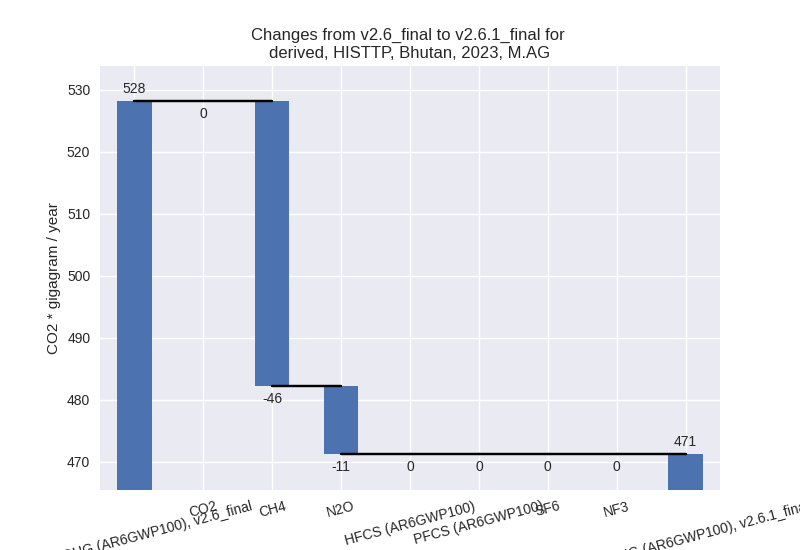
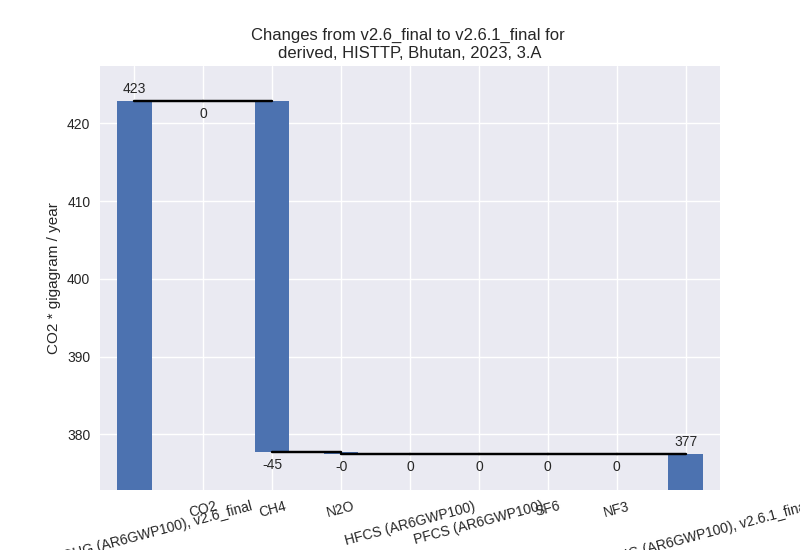
third party scenario (HISTTP):
Most important changes per time frame
For 2023 the following sector-gas combinations have the highest absolute impact on national total KyotoGHG (AR6GWP100) emissions in 2023 (top 5):
- 1: 2, CO2 with -263.52 Gg CO2 / year (-28.0%)
- 2: 1.A, CO2 with -204.26 Gg CO2 / year (-18.9%)
- 3: 1.B.1, CH4 with -117.46 Gg CO2 / year (-64.4%)
- 4: 4, CH4 with -74.43 Gg CO2 / year (-33.5%)
- 5: 3.A, CH4 with -45.13 Gg CO2 / year (-10.8%)
For 1990-2023 the following sector-gas combinations have the highest absolute impact on national total KyotoGHG (AR6GWP100) emissions in 1990-2023 (top 5):
- 1: 4, CH4 with -57.80 Gg CO2 / year (-42.3%)
- 2: 2, CO2 with -47.57 Gg CO2 / year (-11.3%)
- 3: 1.A, CO2 with -30.77 Gg CO2 / year (-6.6%)
- 4: 3.A, CH4 with -27.68 Gg CO2 / year (-6.7%)
- 5: 1.A, CH4 with 17.78 Gg CO2 / year (5.2%)
Changes in the main sectors for aggregate KyotoGHG (AR6GWP100) are
- 1: Total sectoral emissions in 2022 are 1181.44 Gg
CO2 / year which is 46.5% of M.0.EL emissions. 2023 Emissions have
changed by -18.5% (-338.79 Gg CO2 /
year). 1990-2023 Emissions have changed by -3.0% (-27.88 Gg CO2 / year). For 2023 the
changes per gas
are:
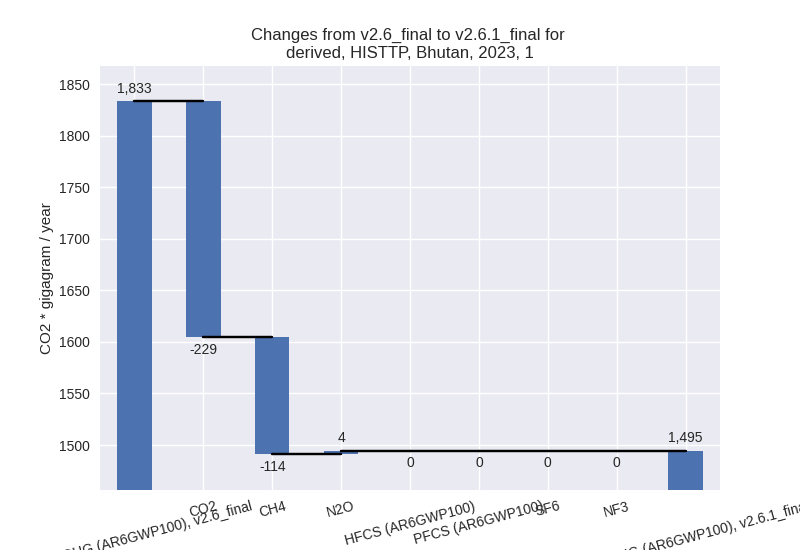
For 1990-2023 the changes per gas are: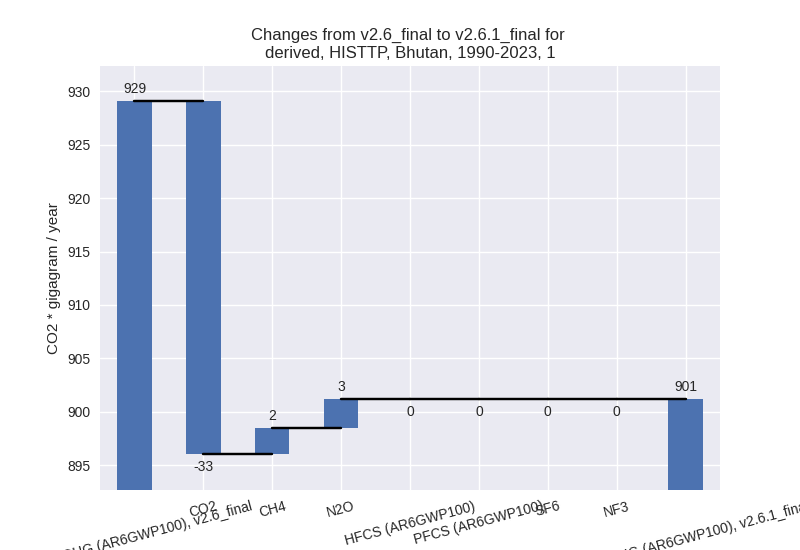
The changes come from the following subsectors:- 1.A: Total sectoral emissions in 2022 are 1110.44
Gg CO2 / year which is 94.0% of category 1 emissions. 2023 Emissions
have changed by -12.1% (-197.01 Gg
CO2 / year). 1990-2023 Emissions have changed by -1.2% (-10.36 Gg CO2 / year). For 2023 the
changes per gas
are:
There is no subsector information available in PRIMAP-hist. - 1.B.1: Total sectoral emissions in 2022 are 70.99
Gg CO2 / year which is 6.0% of category 1 emissions. 2023 Emissions have
changed by -67.8% (-141.77 Gg CO2 /
year). 1990-2023 Emissions have changed by -25.8% (-17.52 Gg CO2 / year). For 2023
the changes per gas
are:
For 1990-2023 the changes per gas are: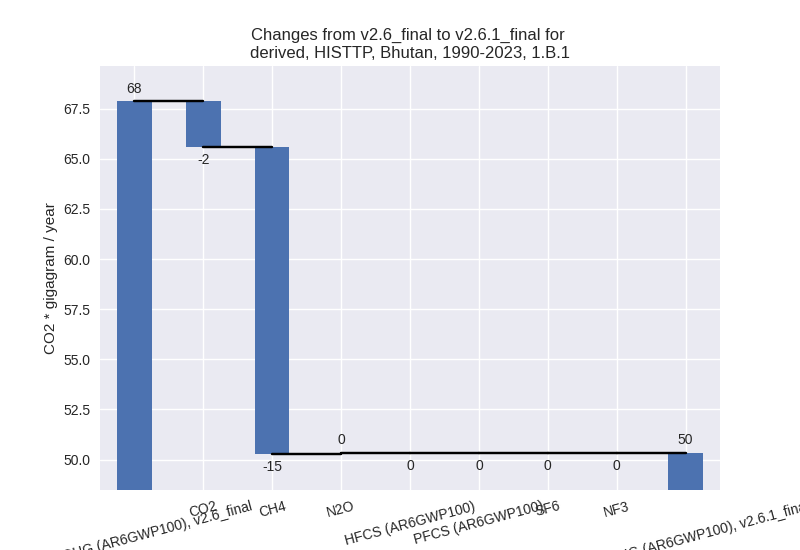
There is no subsector information available in PRIMAP-hist. - 1.B.2: Total sectoral emissions in 2022 are 0.01 Gg
CO2 / year which is 0.0% of category 1 emissions. 2023 Emissions have
changed by -23.5% (-0.00 Gg CO2 /
year). 1990-2023 Emissions have changed by -7.7% (-0.00 Gg CO2 / year). For 2023 the
changes per gas
are:

For 1990-2023 the changes per gas are:
There is no subsector information available in PRIMAP-hist.
- 1.A: Total sectoral emissions in 2022 are 1110.44
Gg CO2 / year which is 94.0% of category 1 emissions. 2023 Emissions
have changed by -12.1% (-197.01 Gg
CO2 / year). 1990-2023 Emissions have changed by -1.2% (-10.36 Gg CO2 / year). For 2023 the
changes per gas
are:
- 2: Total sectoral emissions in 2022 are 681.86 Gg
CO2 / year which is 26.8% of M.0.EL emissions. 2023 Emissions have
changed by -28.2% (-268.07 Gg CO2 /
year). 1990-2023 Emissions have changed by -11.7% (-49.74 Gg CO2 / year). For 2023
the changes per gas
are:
For 1990-2023 the changes per gas are:
- M.AG: Total sectoral emissions in 2022 are 489.23
Gg CO2 / year which is 19.2% of M.0.EL emissions. 2023 Emissions have
changed by -10.8% (-56.90 Gg CO2 /
year). 1990-2023 Emissions have changed by -6.7% (-38.44 Gg CO2 / year). For 2023 the
changes per gas
are:
For 1990-2023 the changes per gas are: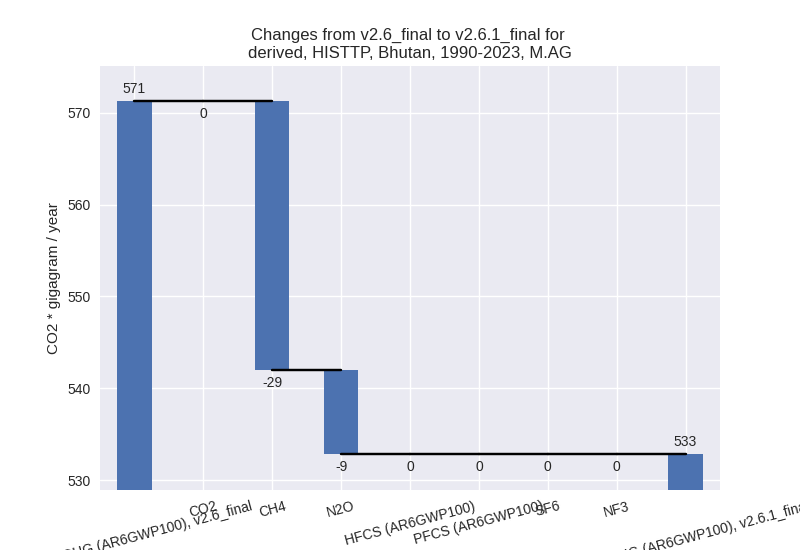
The changes come from the following subsectors:- 3.A: Total sectoral emissions in 2022 are 386.05 Gg
CO2 / year which is 78.9% of category M.AG emissions. 2023 Emissions
have changed by -10.7% (-45.35 Gg
CO2 / year). 1990-2023 Emissions have changed by -6.6% (-27.55 Gg CO2 / year). For 2023 the
changes per gas
are:
For 1990-2023 the changes per gas are:
There is no subsector information available in PRIMAP-hist. - M.AG.ELV: Total sectoral emissions in 2022 are
103.18 Gg CO2 / year which is 21.1% of category M.AG emissions. 2023
Emissions have changed by -11.0%
(-11.54 Gg CO2 / year). 1990-2023 Emissions have changed by -6.9% (-10.89 Gg CO2 / year). For 2023 the
changes per gas
are:
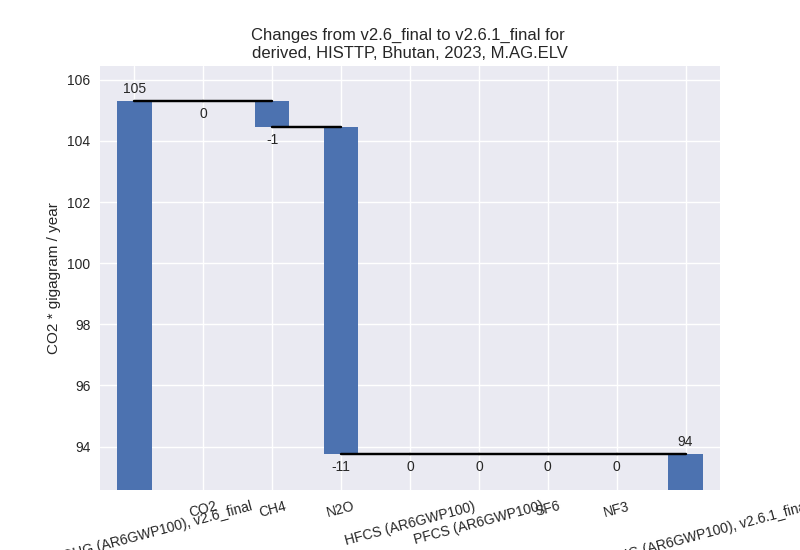
For 1990-2023 the changes per gas are: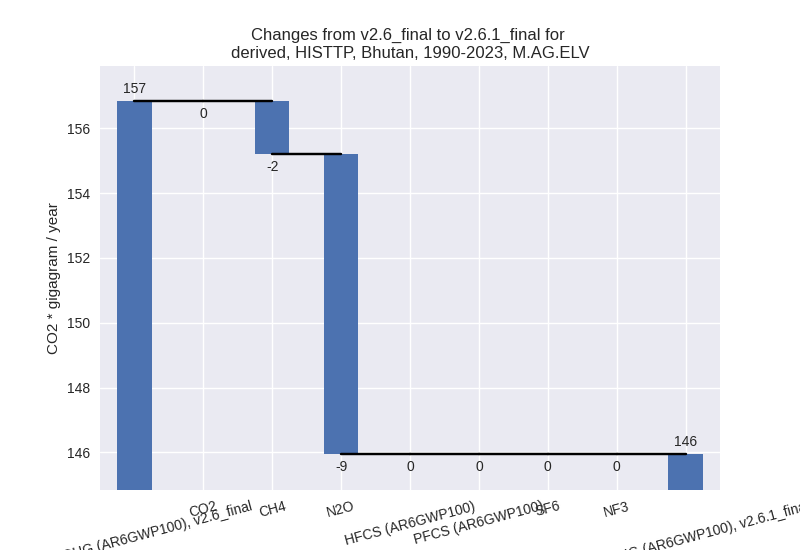
There is no subsector information available in PRIMAP-hist.
- 3.A: Total sectoral emissions in 2022 are 386.05 Gg
CO2 / year which is 78.9% of category M.AG emissions. 2023 Emissions
have changed by -10.7% (-45.35 Gg
CO2 / year). 1990-2023 Emissions have changed by -6.6% (-27.55 Gg CO2 / year). For 2023 the
changes per gas
are:
- 4: Total sectoral emissions in 2022 are 148.10 Gg
CO2 / year which is 5.8% of M.0.EL emissions. 2023 Emissions have
changed by -34.5% (-80.07 Gg CO2 /
year). 1990-2023 Emissions have changed by -43.9% (-62.33 Gg CO2 / year). For 2023
the changes per gas
are:

For 1990-2023 the changes per gas are: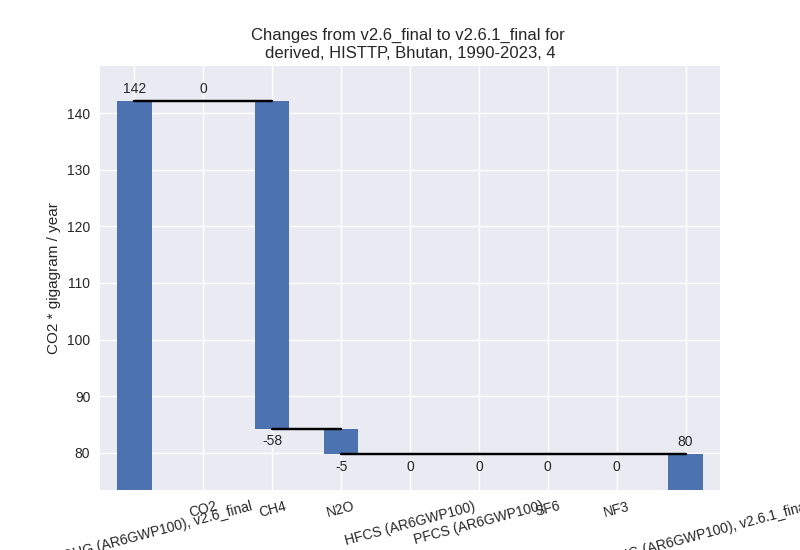
- 5: Total sectoral emissions in 2022 are 42.76 Gg
CO2 / year which is 1.7% of M.0.EL emissions. 2023 Emissions have
changed by 10.8% (4.25 Gg CO2 /
year). 1990-2023 Emissions have changed by 4.7% (1.42 Gg CO2 / year). For 2023 the
changes per gas
are:
For 1990-2023 the changes per gas are: