Changes in PRIMAP-hist v2.6.1_final compared to v2.6_final for Central African Republic
2025-03-19
Johannes Gütschow
Change analysis for Central African Republic for PRIMAP-hist v2.6.1_final compared to v2.6_final
Overview over emissions by sector and gas
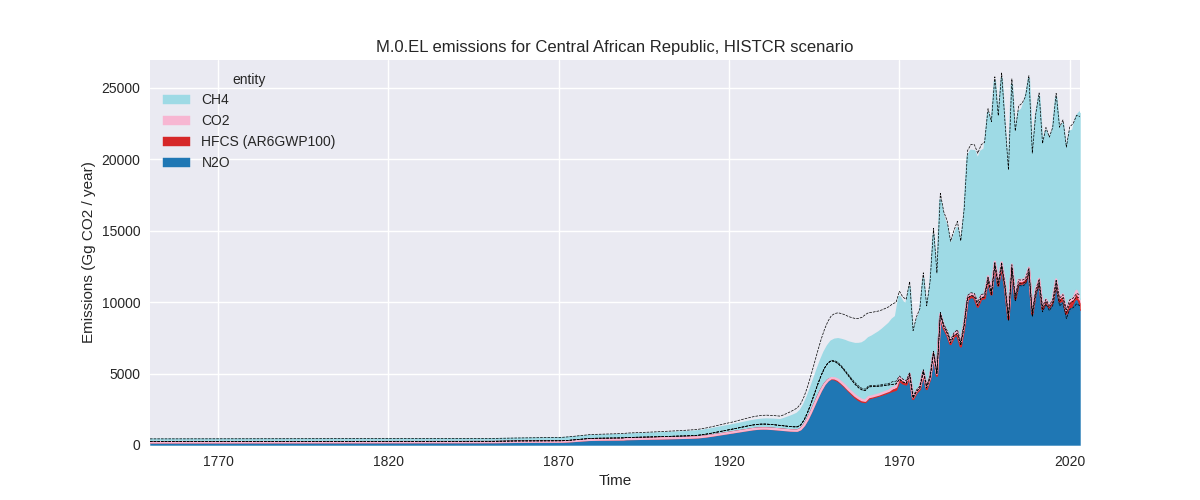
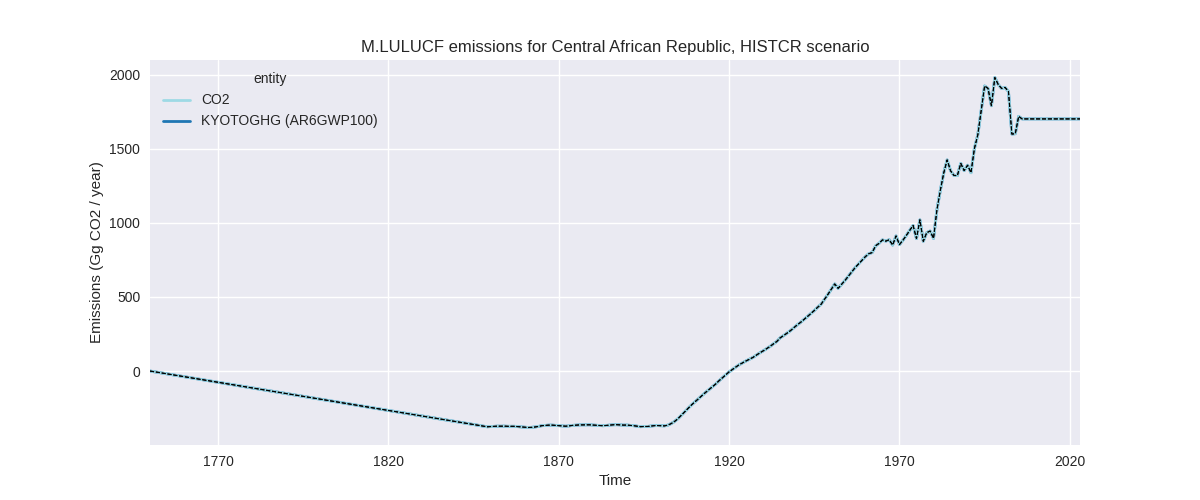
The following figures show the aggregate national total emissions excluding LULUCF AR6GWP100 for the country reported priority scenario. The dotted linesshow the v2.6_final data.

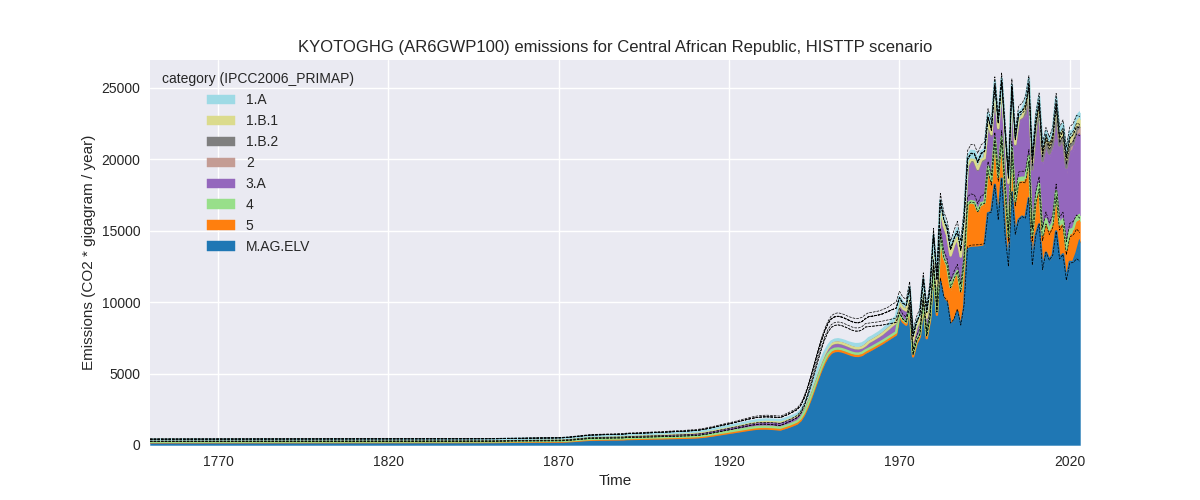
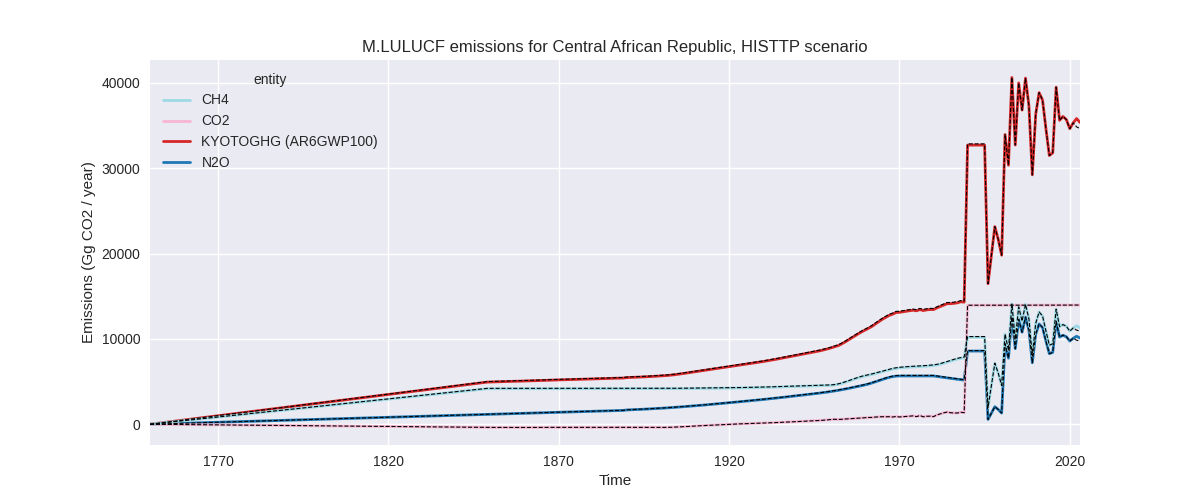
The following figures show the aggregate national total emissions excluding LULUCF AR6GWP100 for the third party priority scenario. The dotted linesshow the v2.6_final data.

Overview over changes
In the country reported priority scenario we have the following changes for aggregate Kyoto GHG and national total emissions excluding LULUCF (M.0.EL):
- Emissions in 2023 have changed by 1.2%% (285.58 Gg CO2 / year)
- Emissions in 1990-2023 have changed by -1.4%% (-319.47 Gg CO2 / year)
In the third party priority scenario we have the following changes for aggregate Kyoto GHG and national total emissions excluding LULUCF (M.0.EL):
- Emissions in 2023 have changed by 1.2%% (285.58 Gg CO2 / year)
- Emissions in 1990-2023 have changed by -1.4%% (-319.47 Gg CO2 / year)
Most important changes per scenario and time frame
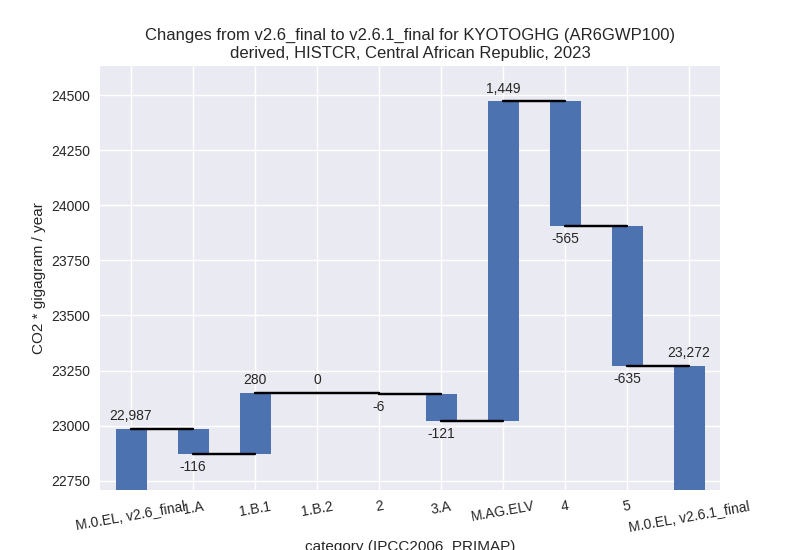
In the country reported priority scenario the following sector-gas combinations have the highest absolute impact on national total KyotoGHG (AR6GWP100) emissions in 2023 (top 5):
- 1: M.AG.ELV, CH4 with 1123.30 Gg CO2 / year (21.0%)
- 2: 5, N2O with -634.75 Gg CO2 / year (-31.9%)
- 3: 4, CH4 with -565.66 Gg CO2 / year (-59.0%)
- 4: M.AG.ELV, N2O with 325.84 Gg CO2 / year (4.3%)
- 5: 1.B.1, CH4 with 276.13 Gg CO2 / year (109.8%)
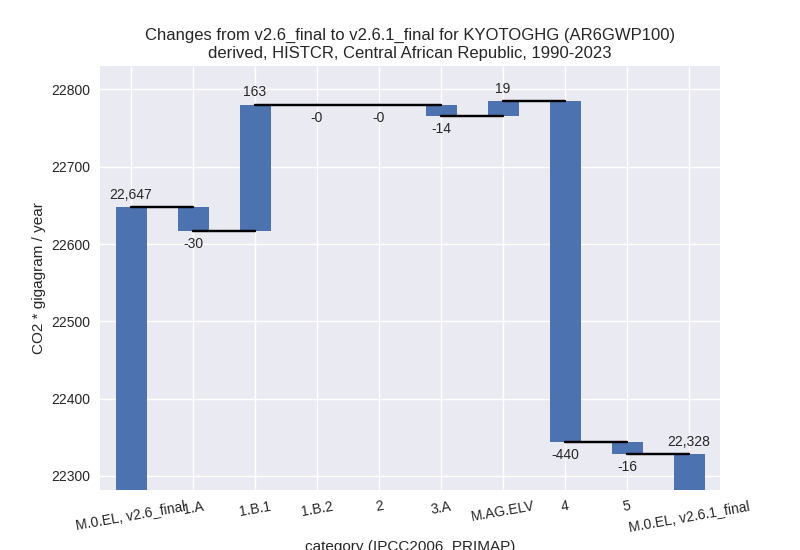
In the country reported priority scenario the following sector-gas combinations have the highest absolute impact on national total KyotoGHG (AR6GWP100) emissions in 1990-2023 (top 5):
- 1: 4, CH4 with -440.45 Gg CO2 / year (-59.6%)
- 2: 1.B.1, CH4 with 160.88 Gg CO2 / year (129.4%)
- 3: 1.A, CH4 with -27.17 Gg CO2 / year (-9.5%)
- 4: M.AG.ELV, CH4 with 24.36 Gg CO2 / year (0.4%)
- 5: 5, N2O with -16.30 Gg CO2 / year (-0.7%)
In the third party priority scenario the following sector-gas combinations have the highest absolute impact on national total KyotoGHG (AR6GWP100) emissions in 2023 (top 5):
- 1: M.AG.ELV, CH4 with 1123.30 Gg CO2 / year (21.0%)
- 2: 5, N2O with -634.75 Gg CO2 / year (-31.9%)
- 3: 4, CH4 with -565.66 Gg CO2 / year (-59.0%)
- 4: M.AG.ELV, N2O with 325.84 Gg CO2 / year (4.3%)
- 5: 1.B.1, CH4 with 276.13 Gg CO2 / year (109.8%)
In the third party priority scenario the following sector-gas combinations have the highest absolute impact on national total KyotoGHG (AR6GWP100) emissions in 1990-2023 (top 5):
- 1: 4, CH4 with -440.45 Gg CO2 / year (-59.6%)
- 2: 1.B.1, CH4 with 160.88 Gg CO2 / year (129.4%)
- 3: 1.A, CH4 with -27.17 Gg CO2 / year (-9.5%)
- 4: M.AG.ELV, CH4 with 24.36 Gg CO2 / year (0.4%)
- 5: 5, N2O with -16.30 Gg CO2 / year (-0.7%)
Notes on data changes
Here we list notes explaining important emissions changes for the country.
- There is no usable country reported data for Central African Republic, thus the CR and TP time-series are identical.
- While the total changes are small there are several changes for individual gas/ sector combinations which are high and cancel partly.
- For 2023 the upward trend in the new FAO data leads to higher emissions in M.AG.ELV, while the new EDGAR data leads to lower emissions in sectors 4 and 5.
- The changes in cumulative emissions are mostly due to lower waste emissions estimates and higher fugitive CH4 emissions estimates in EDGAR 2024.
Changes by sector and gas
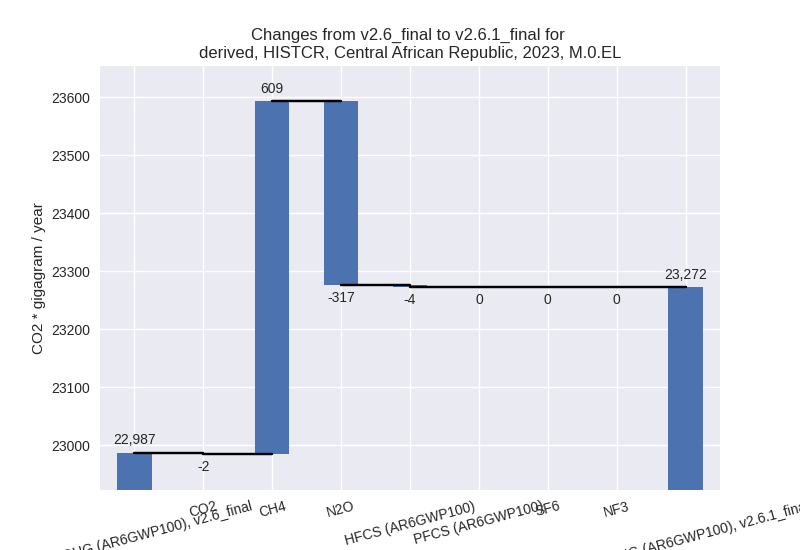
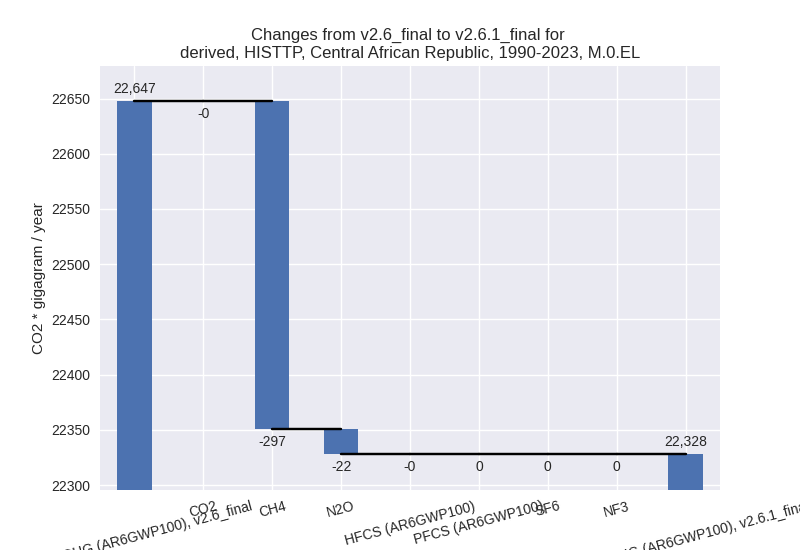
For each scenario and time frame the changes are displayed for all individual sectors and all individual gases. In the sector plot we use aggregate Kyoto GHGs in AR6GWP100. In the gas plot we usenational total emissions without LULUCF.
country reported scenario
2023
1990-2023

third party scenario
2023


1990-2023

Detailed changes for the scenarios:
country reported scenario (HISTCR):
Most important changes per time frame
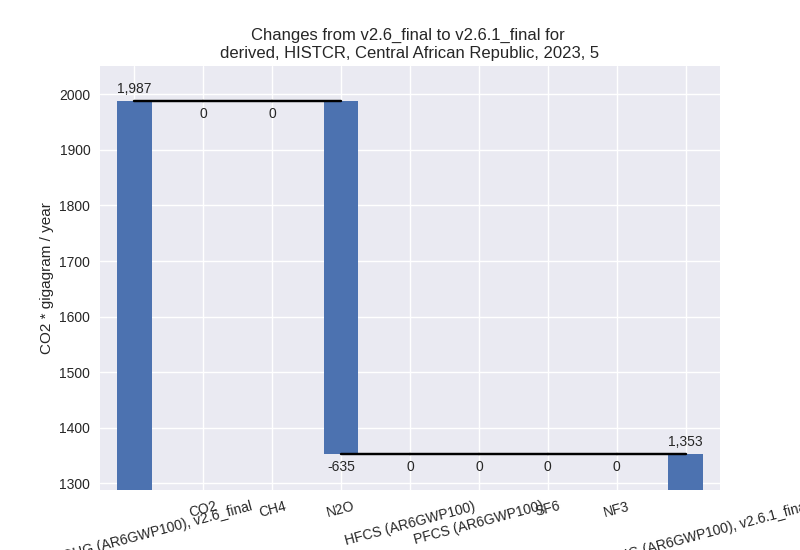
For 2023 the following sector-gas combinations have the highest absolute impact on national total KyotoGHG (AR6GWP100) emissions in 2023 (top 5):
- 1: M.AG.ELV, CH4 with 1123.30 Gg CO2 / year (21.0%)
- 2: 5, N2O with -634.75 Gg CO2 / year (-31.9%)
- 3: 4, CH4 with -565.66 Gg CO2 / year (-59.0%)
- 4: M.AG.ELV, N2O with 325.84 Gg CO2 / year (4.3%)
- 5: 1.B.1, CH4 with 276.13 Gg CO2 / year (109.8%)
For 1990-2023 the following sector-gas combinations have the highest absolute impact on national total KyotoGHG (AR6GWP100) emissions in 1990-2023 (top 5):
- 1: 4, CH4 with -440.45 Gg CO2 / year (-59.6%)
- 2: 1.B.1, CH4 with 160.88 Gg CO2 / year (129.4%)
- 3: 1.A, CH4 with -27.17 Gg CO2 / year (-9.5%)
- 4: M.AG.ELV, CH4 with 24.36 Gg CO2 / year (0.4%)
- 5: 5, N2O with -16.30 Gg CO2 / year (-0.7%)
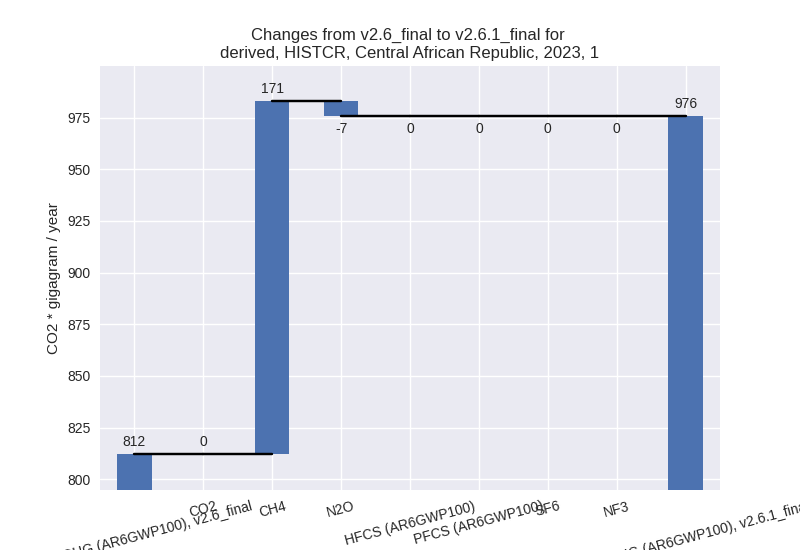
Changes in the main sectors for aggregate KyotoGHG (AR6GWP100) are
- 1: Total sectoral emissions in 2022 are 971.20 Gg
CO2 / year which is 4.2% of M.0.EL emissions. 2023 Emissions have
changed by 20.1% (163.48 Gg CO2 /
year). 1990-2023 Emissions have changed by 20.3% (132.93 Gg CO2 / year). For 2023 the
changes per gas
are:
For 1990-2023 the changes per gas are: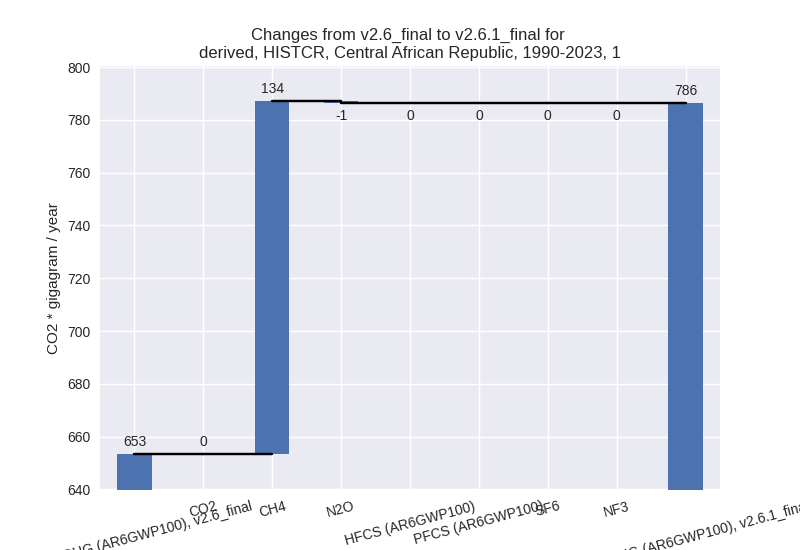
The changes come from the following subsectors:- 1.A: Total sectoral emissions in 2022 are 436.61 Gg
CO2 / year which is 45.0% of category 1 emissions. 2023 Emissions have
changed by -20.9% (-116.31 Gg CO2 /
year). 1990-2023 Emissions have changed by -5.7% (-30.08 Gg CO2 / year). For 2023 the
changes per gas
are:

For 1990-2023 the changes per gas are: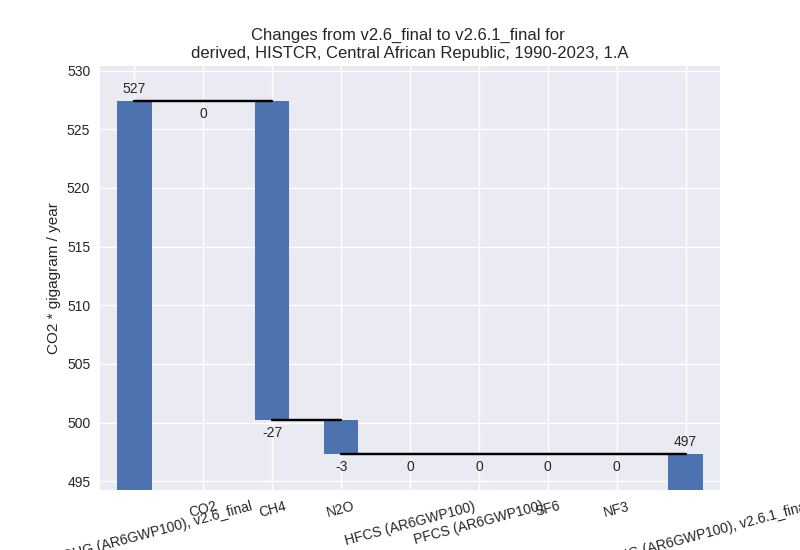
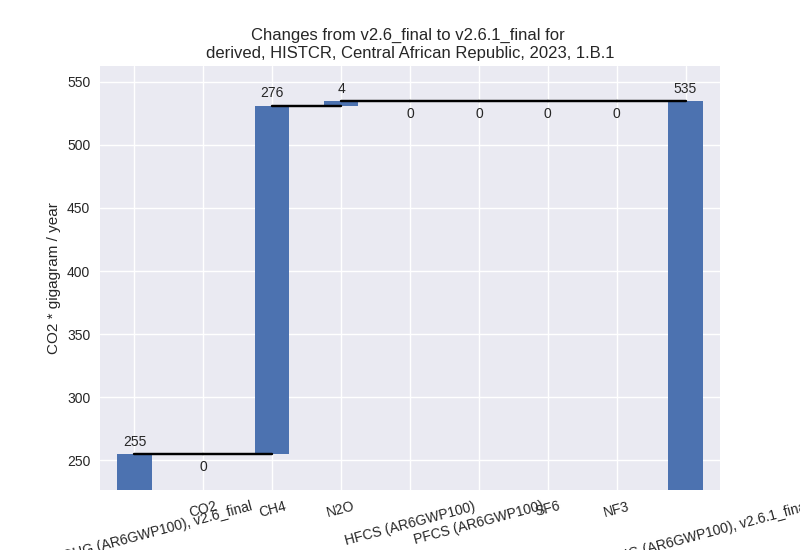
There is no subsector information available in PRIMAP-hist. - 1.B.1: Total sectoral emissions in 2022 are 534.59
Gg CO2 / year which is 55.0% of category 1 emissions. 2023 Emissions
have changed by 109.8% (279.79 Gg
CO2 / year). 1990-2023 Emissions have changed by 129.4% (163.01 Gg CO2 / year). For 2023
the changes per gas
are:
For 1990-2023 the changes per gas are:
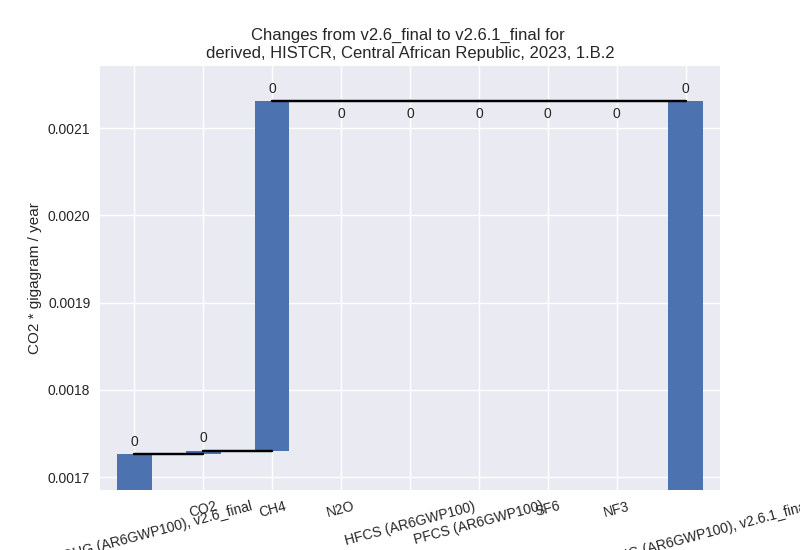
There is no subsector information available in PRIMAP-hist. - 1.B.2: Total sectoral emissions in 2022 are 0.00 Gg
CO2 / year which is 0.0% of category 1 emissions. 2023 Emissions have
changed by 23.4% (0.00 Gg CO2 /
year). 1990-2023 Emissions have changed by -4.6% (-0.00 Gg CO2 / year). For 2023 the
changes per gas
are:
For 1990-2023 the changes per gas are:
There is no subsector information available in PRIMAP-hist.
- 1.A: Total sectoral emissions in 2022 are 436.61 Gg
CO2 / year which is 45.0% of category 1 emissions. 2023 Emissions have
changed by -20.9% (-116.31 Gg CO2 /
year). 1990-2023 Emissions have changed by -5.7% (-30.08 Gg CO2 / year). For 2023 the
changes per gas
are:
- 2: Total sectoral emissions in 2022 are 502.83 Gg CO2 / year which is 2.2% of M.0.EL emissions. 2023 Emissions have changed by -1.1% (-6.28 Gg CO2 / year). 1990-2023 Emissions have changed by -0.2% (-0.34 Gg CO2 / year).
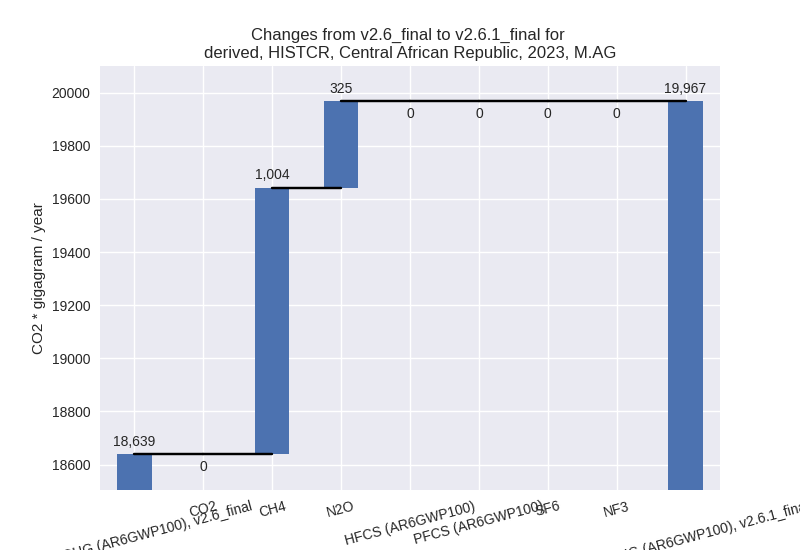
- M.AG: Total sectoral emissions in 2022 are 19018.41
Gg CO2 / year which is 82.7% of M.0.EL emissions. 2023 Emissions have
changed by 7.1% (1328.32 Gg CO2 /
year). 1990-2023 Emissions have changed by 0.0% (4.63 Gg CO2 / year). For 2023 the
changes per gas
are:
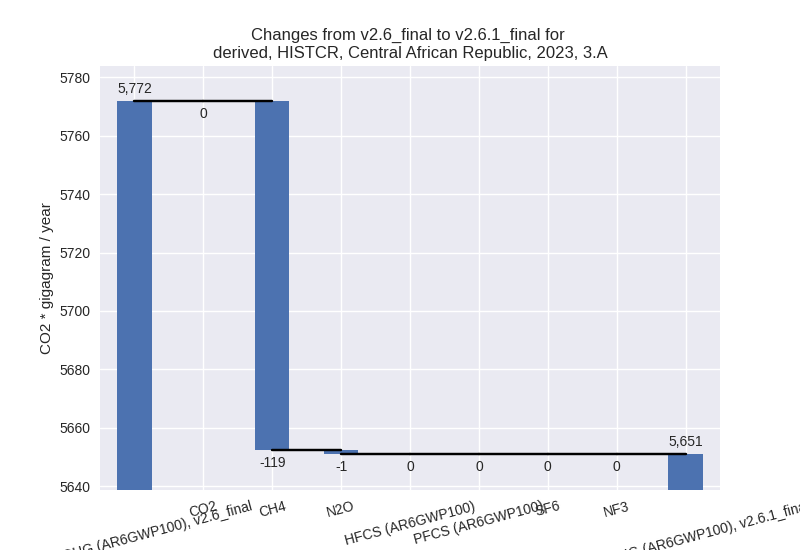
The changes come from the following subsectors:- 3.A: Total sectoral emissions in 2022 are 5580.42
Gg CO2 / year which is 29.3% of category M.AG emissions. 2023 Emissions
have changed by -2.1% (-120.82 Gg
CO2 / year). 1990-2023 Emissions have changed by -0.3% (-14.19 Gg CO2 / year). For 2023 the
changes per gas
are:
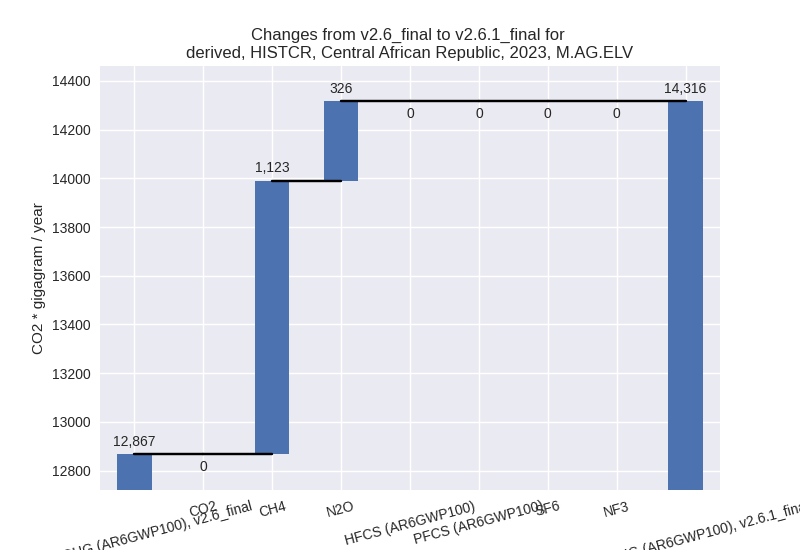
There is no subsector information available in PRIMAP-hist. - M.AG.ELV: Total sectoral emissions in 2022 are
13437.99 Gg CO2 / year which is 70.7% of category M.AG emissions. 2023
Emissions have changed by 11.3%
(1449.14 Gg CO2 / year). 1990-2023 Emissions have changed by 0.1% (18.82 Gg CO2 / year). For 2023 the
changes per gas
are:
There is no subsector information available in PRIMAP-hist.
- 3.A: Total sectoral emissions in 2022 are 5580.42
Gg CO2 / year which is 29.3% of category M.AG emissions. 2023 Emissions
have changed by -2.1% (-120.82 Gg
CO2 / year). 1990-2023 Emissions have changed by -0.3% (-14.19 Gg CO2 / year). For 2023 the
changes per gas
are:
- 4: Total sectoral emissions in 2022 are 425.37 Gg
CO2 / year which is 1.8% of M.0.EL emissions. 2023 Emissions have
changed by -56.4% (-565.19 Gg CO2 /
year). 1990-2023 Emissions have changed by -57.0% (-440.40 Gg CO2 / year). For 2023
the changes per gas
are:

For 1990-2023 the changes per gas are:
- 5: Total sectoral emissions in 2022 are 2086.20 Gg
CO2 / year which is 9.1% of M.0.EL emissions. 2023 Emissions have
changed by -31.9% (-634.75 Gg CO2 /
year). 1990-2023 Emissions have changed by -0.7% (-16.30 Gg CO2 / year). For 2023 the
changes per gas
are:
third party scenario (HISTTP):
Most important changes per time frame
For 2023 the following sector-gas combinations have the highest absolute impact on national total KyotoGHG (AR6GWP100) emissions in 2023 (top 5):
- 1: M.AG.ELV, CH4 with 1123.30 Gg CO2 / year (21.0%)
- 2: 5, N2O with -634.75 Gg CO2 / year (-31.9%)
- 3: 4, CH4 with -565.66 Gg CO2 / year (-59.0%)
- 4: M.AG.ELV, N2O with 325.84 Gg CO2 / year (4.3%)
- 5: 1.B.1, CH4 with 276.13 Gg CO2 / year (109.8%)
For 1990-2023 the following sector-gas combinations have the highest absolute impact on national total KyotoGHG (AR6GWP100) emissions in 1990-2023 (top 5):
- 1: 4, CH4 with -440.45 Gg CO2 / year (-59.6%)
- 2: 1.B.1, CH4 with 160.88 Gg CO2 / year (129.4%)
- 3: 1.A, CH4 with -27.17 Gg CO2 / year (-9.5%)
- 4: M.AG.ELV, CH4 with 24.36 Gg CO2 / year (0.4%)
- 5: 5, N2O with -16.30 Gg CO2 / year (-0.7%)
Changes in the main sectors for aggregate KyotoGHG (AR6GWP100) are
- 1: Total sectoral emissions in 2022 are 971.20 Gg
CO2 / year which is 4.2% of M.0.EL emissions. 2023 Emissions have
changed by 20.1% (163.48 Gg CO2 /
year). 1990-2023 Emissions have changed by 20.3% (132.93 Gg CO2 / year). For 2023 the
changes per gas
are:

For 1990-2023 the changes per gas are:
The changes come from the following subsectors:- 1.A: Total sectoral emissions in 2022 are 436.61 Gg
CO2 / year which is 45.0% of category 1 emissions. 2023 Emissions have
changed by -20.9% (-116.31 Gg CO2 /
year). 1990-2023 Emissions have changed by -5.7% (-30.08 Gg CO2 / year). For 2023 the
changes per gas
are:

For 1990-2023 the changes per gas are:
There is no subsector information available in PRIMAP-hist. - 1.B.1: Total sectoral emissions in 2022 are 534.59
Gg CO2 / year which is 55.0% of category 1 emissions. 2023 Emissions
have changed by 109.8% (279.79 Gg
CO2 / year). 1990-2023 Emissions have changed by 129.4% (163.01 Gg CO2 / year). For 2023
the changes per gas
are:

For 1990-2023 the changes per gas are: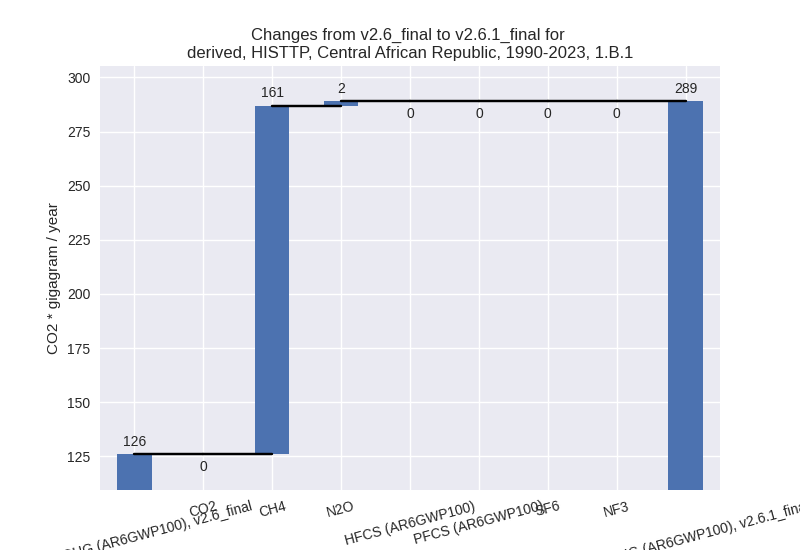
There is no subsector information available in PRIMAP-hist. - 1.B.2: Total sectoral emissions in 2022 are 0.00 Gg
CO2 / year which is 0.0% of category 1 emissions. 2023 Emissions have
changed by 23.4% (0.00 Gg CO2 /
year). 1990-2023 Emissions have changed by -4.6% (-0.00 Gg CO2 / year). For 2023 the
changes per gas
are:

For 1990-2023 the changes per gas are: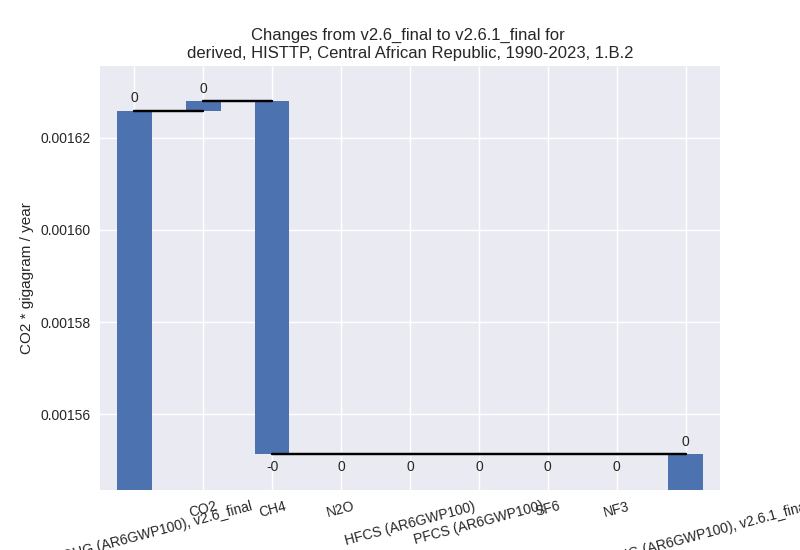
There is no subsector information available in PRIMAP-hist.
- 1.A: Total sectoral emissions in 2022 are 436.61 Gg
CO2 / year which is 45.0% of category 1 emissions. 2023 Emissions have
changed by -20.9% (-116.31 Gg CO2 /
year). 1990-2023 Emissions have changed by -5.7% (-30.08 Gg CO2 / year). For 2023 the
changes per gas
are:
- 2: Total sectoral emissions in 2022 are 502.83 Gg CO2 / year which is 2.2% of M.0.EL emissions. 2023 Emissions have changed by -1.1% (-6.28 Gg CO2 / year). 1990-2023 Emissions have changed by -0.2% (-0.34 Gg CO2 / year).
- M.AG: Total sectoral emissions in 2022 are 19018.41
Gg CO2 / year which is 82.7% of M.0.EL emissions. 2023 Emissions have
changed by 7.1% (1328.32 Gg CO2 /
year). 1990-2023 Emissions have changed by 0.0% (4.63 Gg CO2 / year). For 2023 the
changes per gas
are:

The changes come from the following subsectors:- 3.A: Total sectoral emissions in 2022 are 5580.42
Gg CO2 / year which is 29.3% of category M.AG emissions. 2023 Emissions
have changed by -2.1% (-120.82 Gg
CO2 / year). 1990-2023 Emissions have changed by -0.3% (-14.19 Gg CO2 / year). For 2023 the
changes per gas
are:

There is no subsector information available in PRIMAP-hist. - M.AG.ELV: Total sectoral emissions in 2022 are
13437.99 Gg CO2 / year which is 70.7% of category M.AG emissions. 2023
Emissions have changed by 11.3%
(1449.14 Gg CO2 / year). 1990-2023 Emissions have changed by 0.1% (18.82 Gg CO2 / year). For 2023 the
changes per gas
are:

There is no subsector information available in PRIMAP-hist.
- 3.A: Total sectoral emissions in 2022 are 5580.42
Gg CO2 / year which is 29.3% of category M.AG emissions. 2023 Emissions
have changed by -2.1% (-120.82 Gg
CO2 / year). 1990-2023 Emissions have changed by -0.3% (-14.19 Gg CO2 / year). For 2023 the
changes per gas
are:
- 4: Total sectoral emissions in 2022 are 425.37 Gg
CO2 / year which is 1.8% of M.0.EL emissions. 2023 Emissions have
changed by -56.4% (-565.19 Gg CO2 /
year). 1990-2023 Emissions have changed by -57.0% (-440.40 Gg CO2 / year). For 2023
the changes per gas
are:

For 1990-2023 the changes per gas are:
- 5: Total sectoral emissions in 2022 are 2086.20 Gg
CO2 / year which is 9.1% of M.0.EL emissions. 2023 Emissions have
changed by -31.9% (-634.75 Gg CO2 /
year). 1990-2023 Emissions have changed by -0.7% (-16.30 Gg CO2 / year). For 2023 the
changes per gas
are:
