Changes in PRIMAP-hist v2.6.1_final compared to v2.6_final for Canada
2025-03-19
Johannes Gütschow
Change analysis for Canada for PRIMAP-hist v2.6.1_final compared to v2.6_final
Overview over emissions by sector and gas
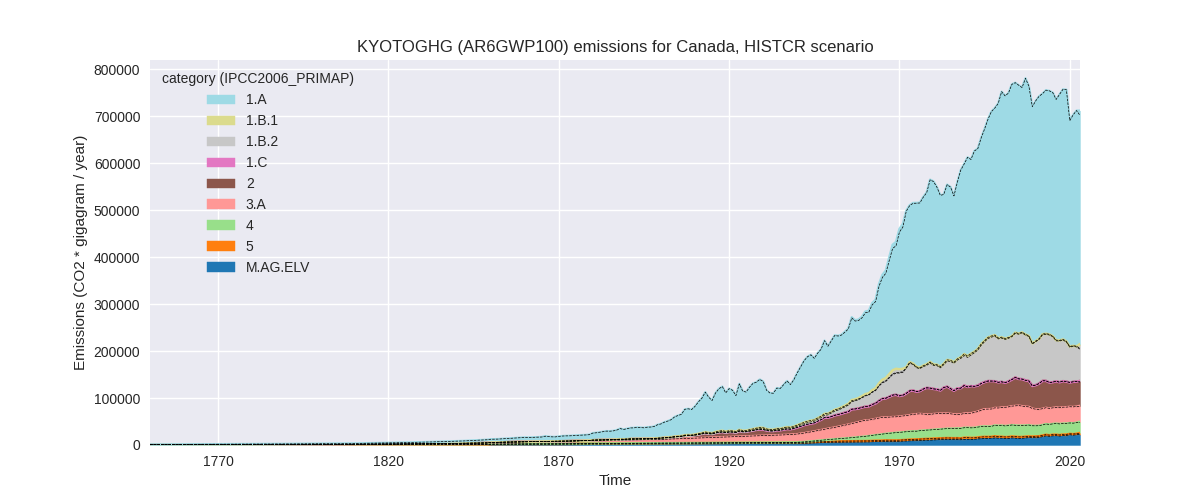
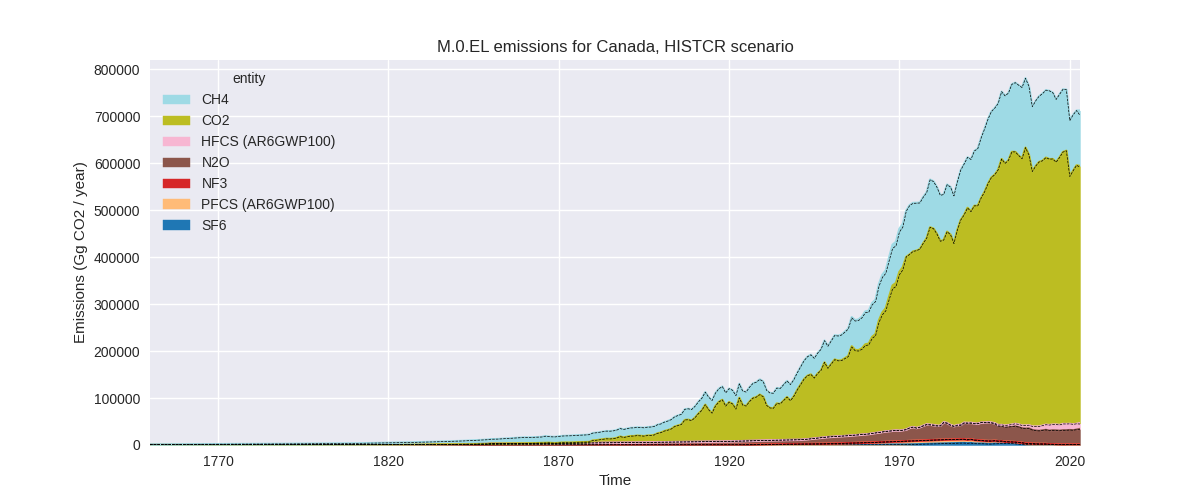
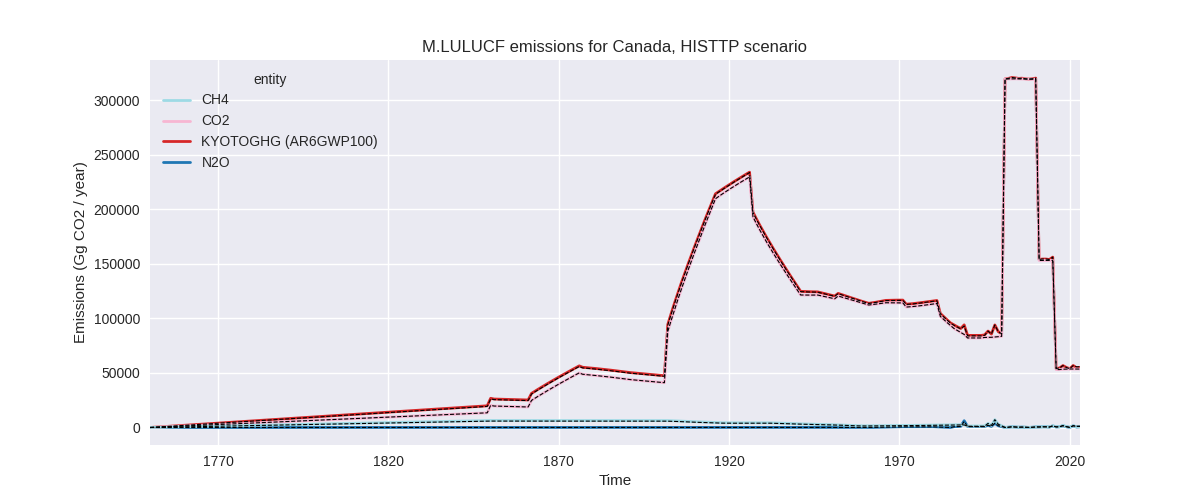
The following figures show the aggregate national total emissions excluding LULUCF AR6GWP100 for the country reported priority scenario. The dotted linesshow the v2.6_final data.
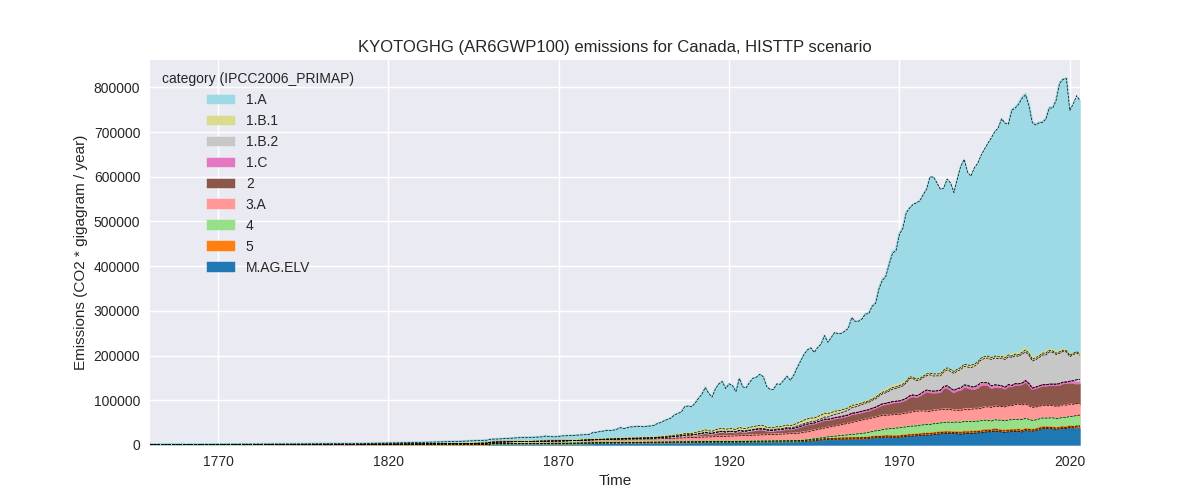
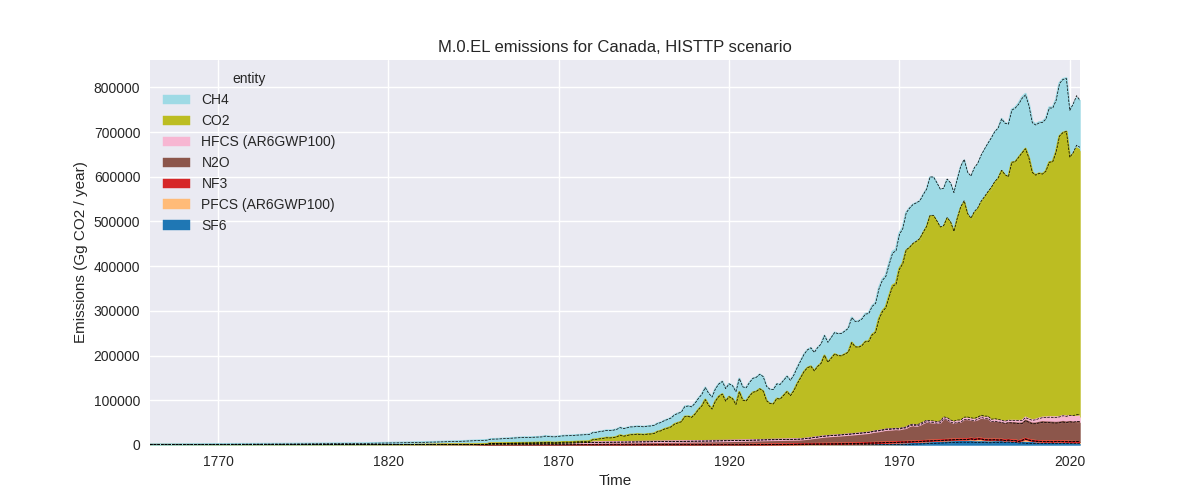
The following figures show the aggregate national total emissions excluding LULUCF AR6GWP100 for the third party priority scenario. The dotted linesshow the v2.6_final data.
Overview over changes
In the country reported priority scenario we have the following changes for aggregate Kyoto GHG and national total emissions excluding LULUCF (M.0.EL):
- Emissions in 2023 have changed by 1.5%% (10226.93 Gg CO2 / year)
- Emissions in 1990-2023 have changed by 0.0%% (134.66 Gg CO2 / year)
In the third party priority scenario we have the following changes for aggregate Kyoto GHG and national total emissions excluding LULUCF (M.0.EL):
- Emissions in 2023 have changed by 0.2%% (1512.90 Gg CO2 / year)
- Emissions in 1990-2023 have changed by -0.1%% (-438.50 Gg CO2 / year)
Most important changes per scenario and time frame
In the country reported priority scenario the following sector-gas combinations have the highest absolute impact on national total KyotoGHG (AR6GWP100) emissions in 2023 (top 5):
- 1: 1.B.2, CH4 with 7232.03 Gg CO2 / year (14.5%)
- 2: 5, N2O with 1455.07 Gg CO2 / year (64.7%)
- 3: 2, CO2 with 1066.20 Gg CO2 / year (2.8%)
- 4: 4, CH4 with 684.35 Gg CO2 / year (3.2%)
- 5: 3.A, CH4 with -563.66 Gg CO2 / year (-1.8%)
In the country reported priority scenario the following sector-gas combinations have the highest absolute impact on national total KyotoGHG (AR6GWP100) emissions in 1990-2023 (top 5):
- 1: 1.B.2, CH4 with 212.71 Gg CO2 / year (0.3%)
- 2: 5, N2O with -123.33 Gg CO2 / year (-4.2%)
- 3: 2, CO2 with 31.36 Gg CO2 / year (0.1%)
- 4: 4, CH4 with 20.13 Gg CO2 / year (0.1%)
- 5: 3.A, CH4 with -16.58 Gg CO2 / year (-0.1%)
In the third party priority scenario the following sector-gas combinations have the highest absolute impact on national total KyotoGHG (AR6GWP100) emissions in 2023 (top 5):
- 1: 1.B.2, CH4 with 10005.93 Gg CO2 / year (19.5%)
- 2: 2, HFCS (AR6GWP100) with -2947.98 Gg CO2 / year (-19.2%)
- 3: 2, CO2 with -1880.26 Gg CO2 / year (-6.3%)
- 4: 4, CH4 with -1697.57 Gg CO2 / year (-7.4%)
- 5: 5, N2O with 1455.07 Gg CO2 / year (64.7%)
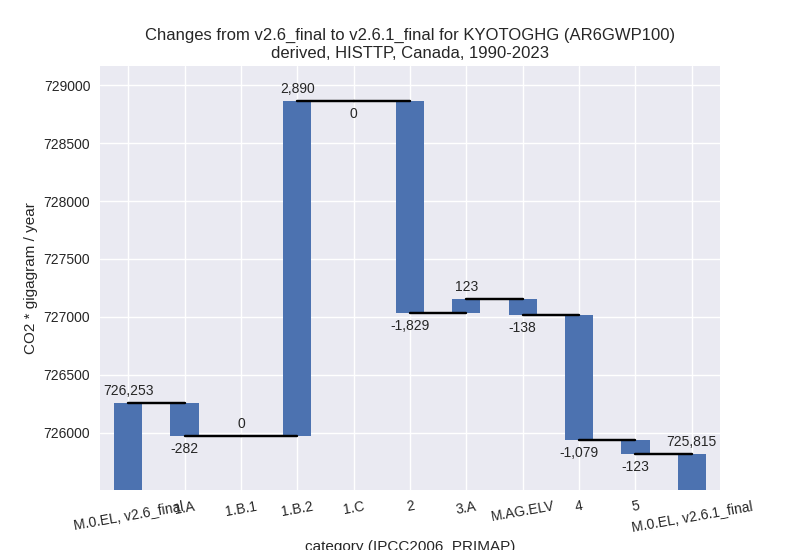
In the third party priority scenario the following sector-gas combinations have the highest absolute impact on national total KyotoGHG (AR6GWP100) emissions in 1990-2023 (top 5):
- 1: 1.B.2, CH4 with 2886.78 Gg CO2 / year (5.1%)
- 2: 2, HFCS (AR6GWP100) with -1795.76 Gg CO2 / year (-21.0%)
- 3: 4, CH4 with -1074.48 Gg CO2 / year (-5.0%)
- 4: 2, SF6 with 162.66 Gg CO2 / year (3.5%)
- 5: 1.A, N2O with -159.30 Gg CO2 / year (-3.8%)
Notes on data changes
Here we list notes explaining important emissions changes for the country.
- CRT data has been added but it replaces official data from the same year and does not introduce any noteworthy changes. Changes in the CR time-series are small and come from updated third party data (EDGAR, FAO) which is used to extrapolate the country reported data,
- Changes in the TP scenario come from updated EDGAR and FAO data
Changes by sector and gas
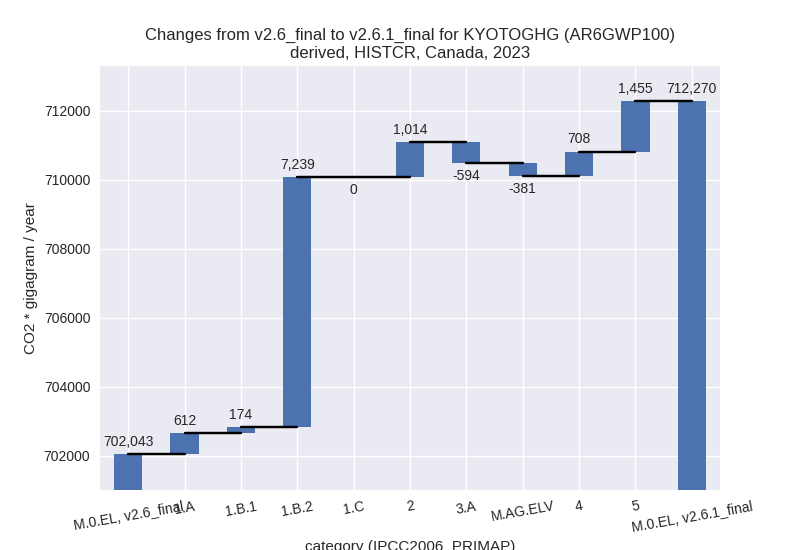
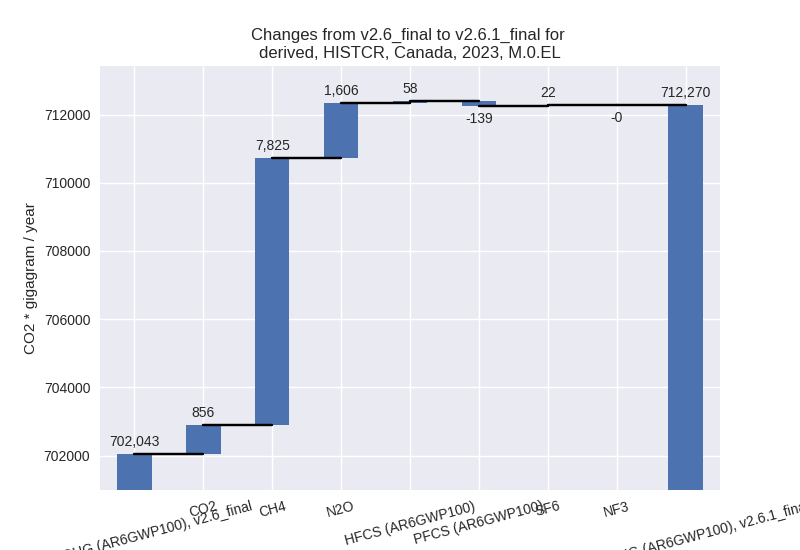
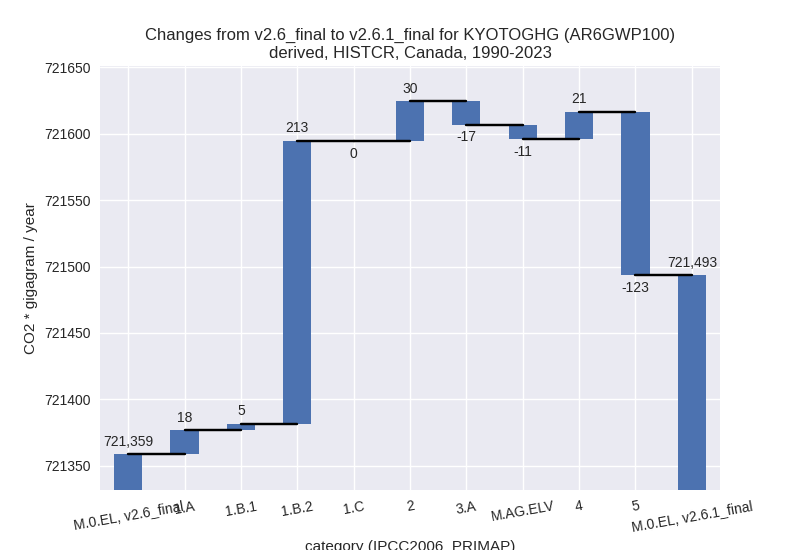
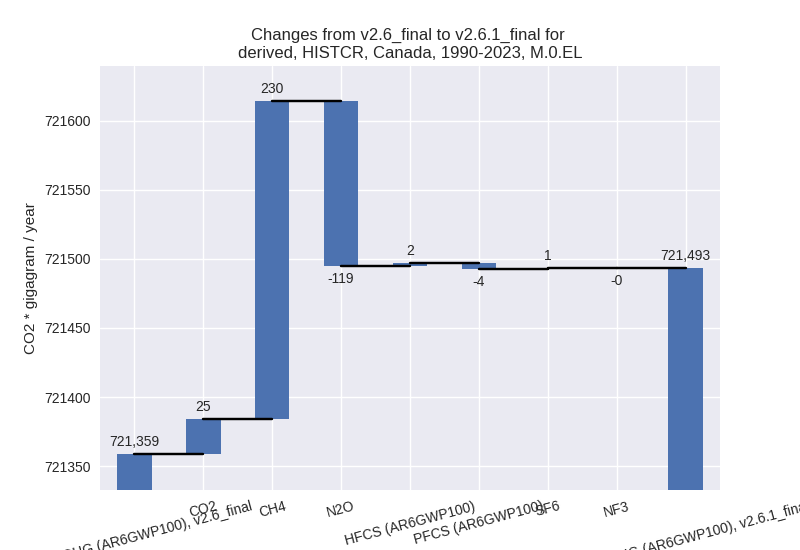
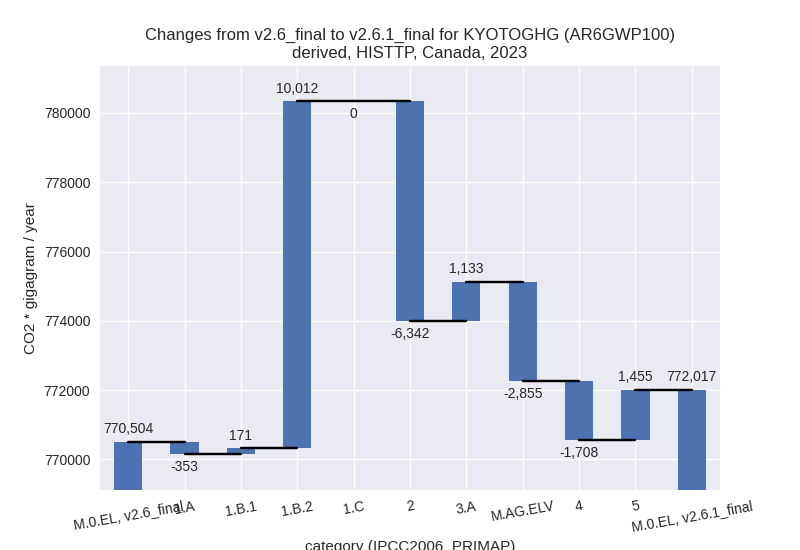
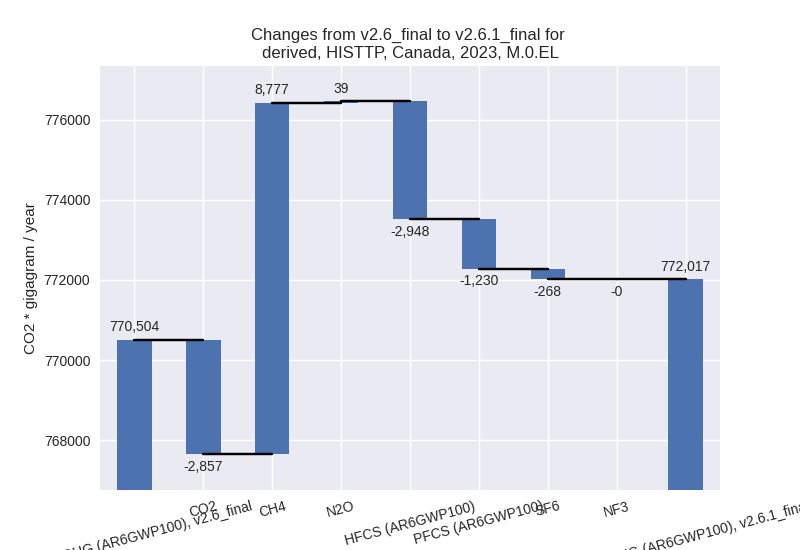
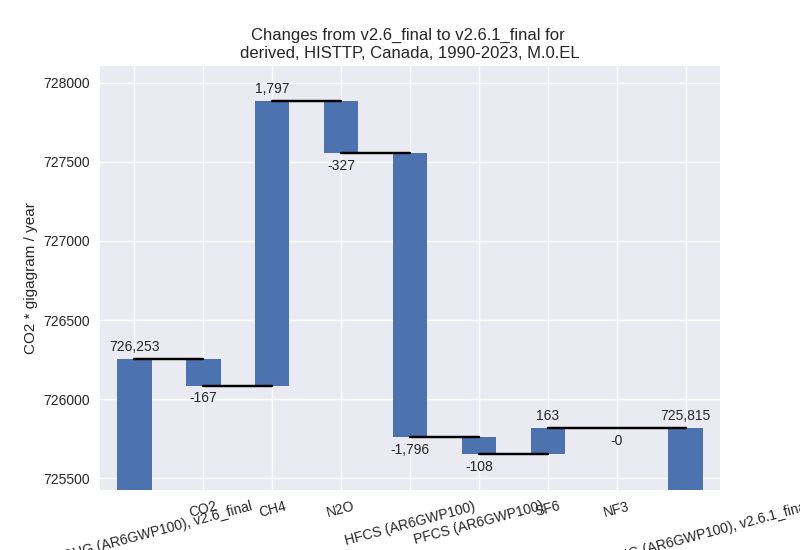
For each scenario and time frame the changes are displayed for all individual sectors and all individual gases. In the sector plot we use aggregate Kyoto GHGs in AR6GWP100. In the gas plot we usenational total emissions without LULUCF.
country reported scenario
2023
1990-2023
third party scenario
2023
1990-2023
Detailed changes for the scenarios:
country reported scenario (HISTCR):
Most important changes per time frame
For 2023 the following sector-gas combinations have the highest absolute impact on national total KyotoGHG (AR6GWP100) emissions in 2023 (top 5):
- 1: 1.B.2, CH4 with 7232.03 Gg CO2 / year (14.5%)
- 2: 5, N2O with 1455.07 Gg CO2 / year (64.7%)
- 3: 2, CO2 with 1066.20 Gg CO2 / year (2.8%)
- 4: 4, CH4 with 684.35 Gg CO2 / year (3.2%)
- 5: 3.A, CH4 with -563.66 Gg CO2 / year (-1.8%)
For 1990-2023 the following sector-gas combinations have the highest absolute impact on national total KyotoGHG (AR6GWP100) emissions in 1990-2023 (top 5):
- 1: 1.B.2, CH4 with 212.71 Gg CO2 / year (0.3%)
- 2: 5, N2O with -123.33 Gg CO2 / year (-4.2%)
- 3: 2, CO2 with 31.36 Gg CO2 / year (0.1%)
- 4: 4, CH4 with 20.13 Gg CO2 / year (0.1%)
- 5: 3.A, CH4 with -16.58 Gg CO2 / year (-0.1%)
Changes in the main sectors for aggregate KyotoGHG (AR6GWP100) are
- 1: Total sectoral emissions in 2022 are 577055.50 Gg CO2 / year which is 81.0% of M.0.EL emissions. 2023 Emissions have changed by 1.4% (8025.29 Gg CO2 / year). 1990-2023 Emissions have changed by 0.0% (236.04 Gg CO2 / year).
- 2: Total sectoral emissions in 2022 are 53302.61 Gg CO2 / year which is 7.5% of M.0.EL emissions. 2023 Emissions have changed by 2.0% (1013.62 Gg CO2 / year). 1990-2023 Emissions have changed by 0.1% (29.81 Gg CO2 / year).
- M.AG: Total sectoral emissions in 2022 are 56487.71 Gg CO2 / year which is 7.9% of M.0.EL emissions. 2023 Emissions have changed by -1.7% (-975.15 Gg CO2 / year). 1990-2023 Emissions have changed by -0.1% (-28.68 Gg CO2 / year).
- 4: Total sectoral emissions in 2022 are 23328.97 Gg
CO2 / year which is 3.3% of M.0.EL emissions. 2023 Emissions have
changed by 3.1% (708.10 Gg CO2 /
year). 1990-2023 Emissions have changed by 0.1% (20.83 Gg CO2 / year). For 2023 the
changes per gas
are:
- 5: Total sectoral emissions in 2022 are 2012.57 Gg
CO2 / year which is 0.3% of M.0.EL emissions. 2023 Emissions have
changed by 64.7% (1455.07 Gg CO2 /
year). 1990-2023 Emissions have changed by -4.2% (-123.33 Gg CO2 / year). For 2023
the changes per gas
are:

For 1990-2023 the changes per gas are: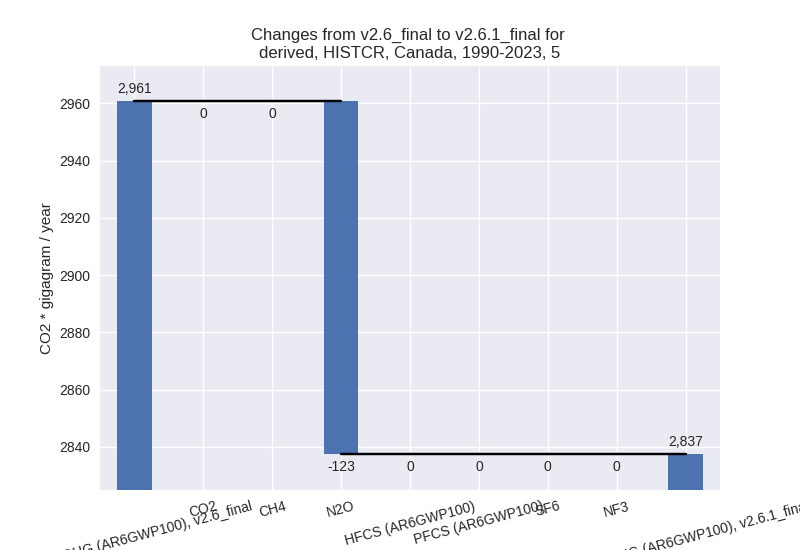
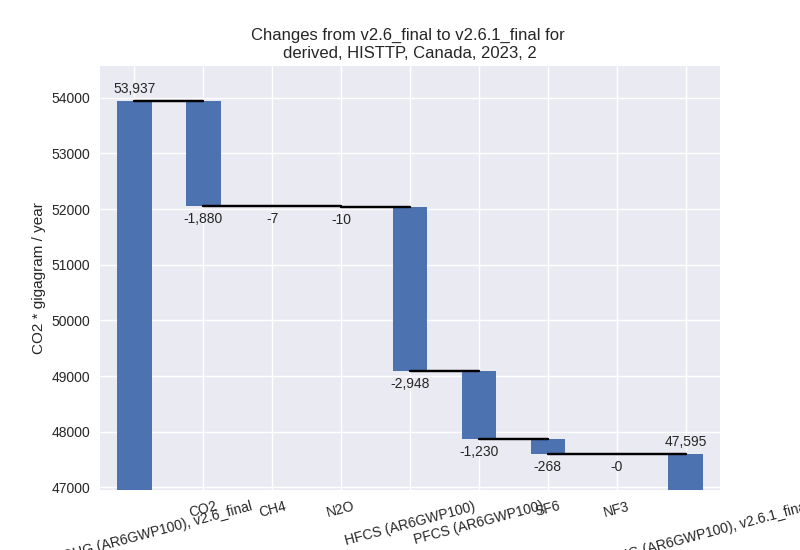
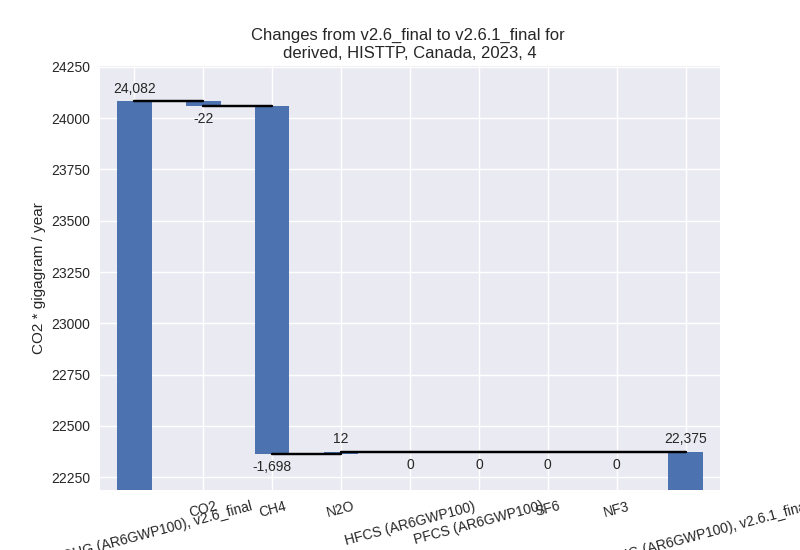
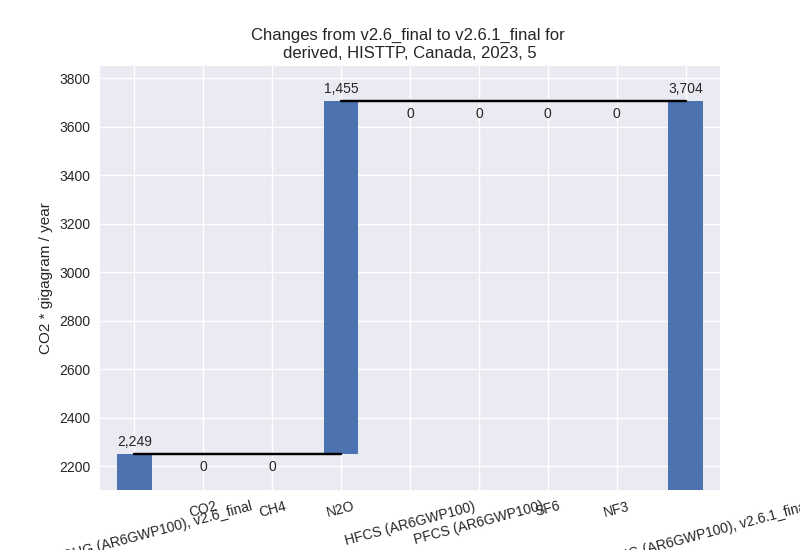
third party scenario (HISTTP):
Most important changes per time frame
For 2023 the following sector-gas combinations have the highest absolute impact on national total KyotoGHG (AR6GWP100) emissions in 2023 (top 5):
- 1: 1.B.2, CH4 with 10005.93 Gg CO2 / year (19.5%)
- 2: 2, HFCS (AR6GWP100) with -2947.98 Gg CO2 / year (-19.2%)
- 3: 2, CO2 with -1880.26 Gg CO2 / year (-6.3%)
- 4: 4, CH4 with -1697.57 Gg CO2 / year (-7.4%)
- 5: 5, N2O with 1455.07 Gg CO2 / year (64.7%)
For 1990-2023 the following sector-gas combinations have the highest absolute impact on national total KyotoGHG (AR6GWP100) emissions in 1990-2023 (top 5):
- 1: 1.B.2, CH4 with 2886.78 Gg CO2 / year (5.1%)
- 2: 2, HFCS (AR6GWP100) with -1795.76 Gg CO2 / year (-21.0%)
- 3: 4, CH4 with -1074.48 Gg CO2 / year (-5.0%)
- 4: 2, SF6 with 162.66 Gg CO2 / year (3.5%)
- 5: 1.A, N2O with -159.30 Gg CO2 / year (-3.8%)
Changes in the main sectors for aggregate KyotoGHG (AR6GWP100) are
- 1: Total sectoral emissions in 2022 are 637151.55 Gg CO2 / year which is 82.2% of M.0.EL emissions. 2023 Emissions have changed by 1.6% (9829.88 Gg CO2 / year). 1990-2023 Emissions have changed by 0.4% (2608.13 Gg CO2 / year).
- 2: Total sectoral emissions in 2022 are 48499.28 Gg
CO2 / year which is 6.3% of M.0.EL emissions. 2023 Emissions have
changed by -11.8% (-6342.50 Gg CO2 /
year). 1990-2023 Emissions have changed by -3.7% (-1829.45 Gg CO2 / year). For 2023
the changes per gas
are:
For 1990-2023 the changes per gas are: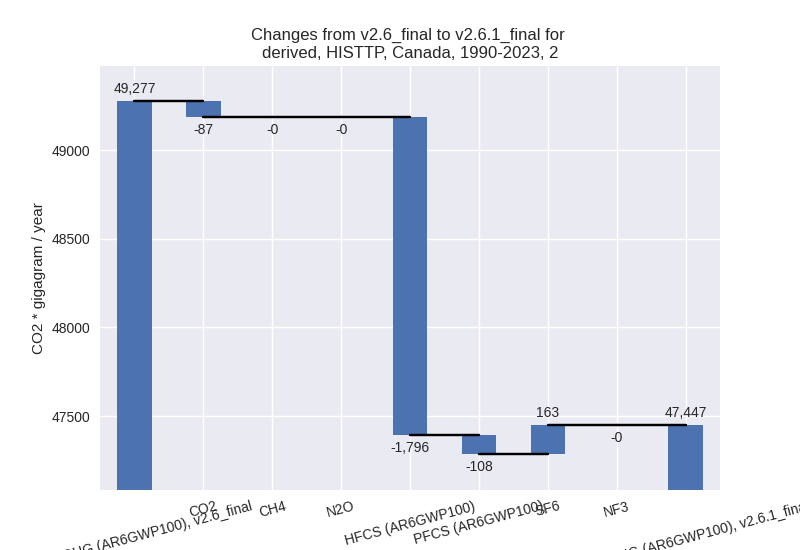
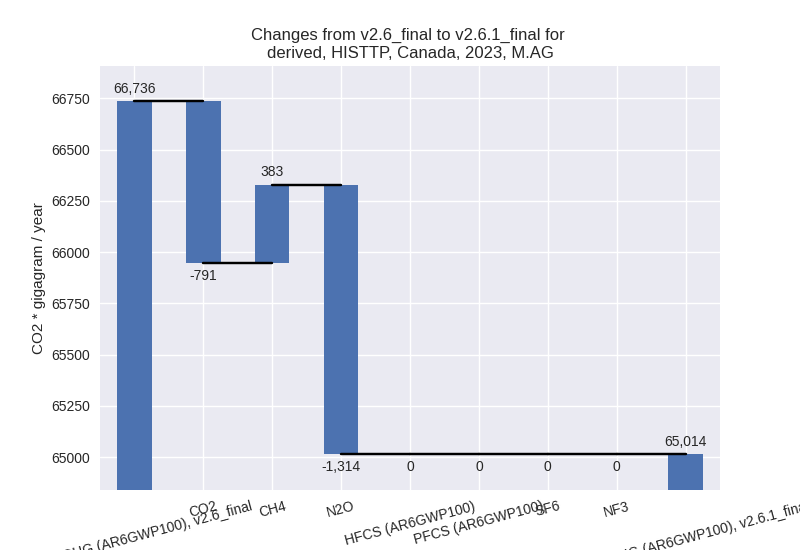
- M.AG: Total sectoral emissions in 2022 are 65495.38
Gg CO2 / year which is 8.4% of M.0.EL emissions. 2023 Emissions have
changed by -2.6% (-1722.05 Gg CO2 /
year). 1990-2023 Emissions have changed by -0.0% (-14.70 Gg CO2 / year). For 2023 the
changes per gas
are:
The changes come from the following subsectors:- 3.A: Total sectoral emissions in 2022 are 27757.94
Gg CO2 / year which is 42.4% of category M.AG emissions. 2023 Emissions
have changed by 4.3% (1132.85 Gg CO2
/ year). 1990-2023 Emissions have changed by 0.4% (122.94 Gg CO2 / year). For 2023 the
changes per gas
are:

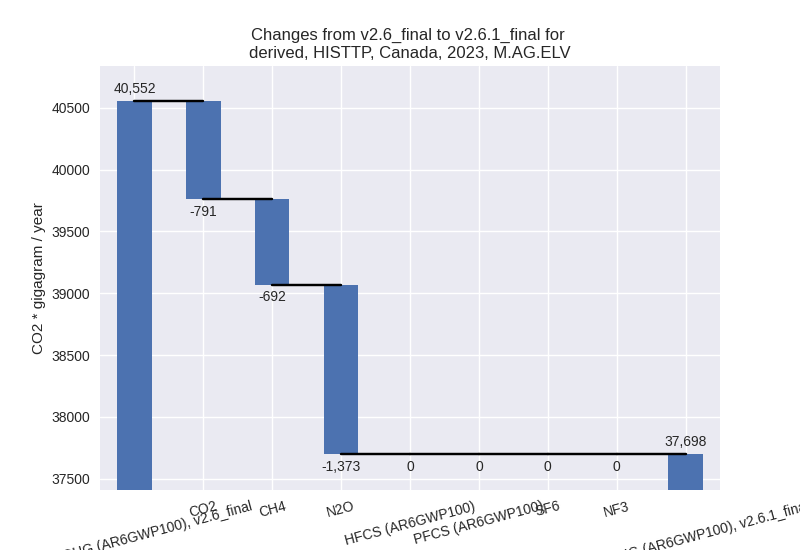
There is no subsector information available in PRIMAP-hist. - M.AG.ELV: Total sectoral emissions in 2022 are
37737.44 Gg CO2 / year which is 57.6% of category M.AG emissions. 2023
Emissions have changed by -7.0%
(-2854.90 Gg CO2 / year). 1990-2023 Emissions have changed by -0.4% (-137.64 Gg CO2 / year). For 2023
the changes per gas
are:
There is no subsector information available in PRIMAP-hist.
- 3.A: Total sectoral emissions in 2022 are 27757.94
Gg CO2 / year which is 42.4% of category M.AG emissions. 2023 Emissions
have changed by 4.3% (1132.85 Gg CO2
/ year). 1990-2023 Emissions have changed by 0.4% (122.94 Gg CO2 / year). For 2023 the
changes per gas
are:
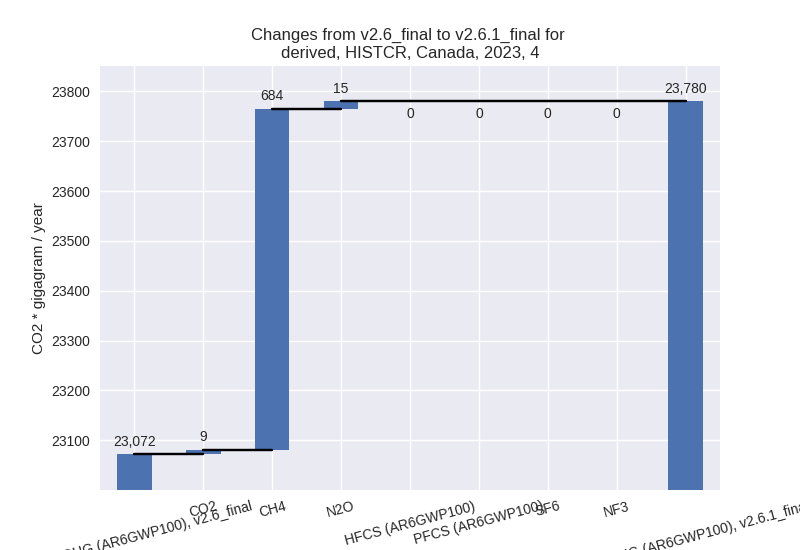
- 4: Total sectoral emissions in 2022 are 21951.58 Gg
CO2 / year which is 2.8% of M.0.EL emissions. 2023 Emissions have
changed by -7.1% (-1707.50 Gg CO2 /
year). 1990-2023 Emissions have changed by -4.8% (-1079.15 Gg CO2 / year). For 2023
the changes per gas
are:
For 1990-2023 the changes per gas are: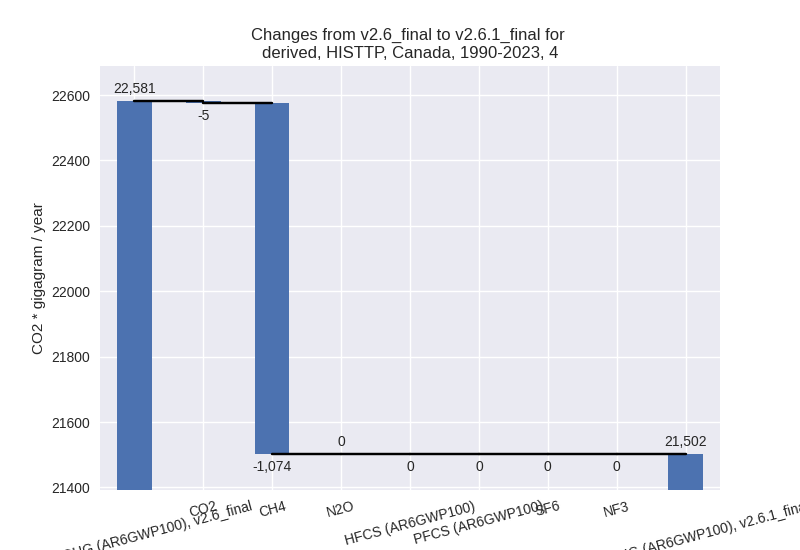
- 5: Total sectoral emissions in 2022 are 2012.57 Gg
CO2 / year which is 0.3% of M.0.EL emissions. 2023 Emissions have
changed by 64.7% (1455.07 Gg CO2 /
year). 1990-2023 Emissions have changed by -4.2% (-123.33 Gg CO2 / year). For 2023
the changes per gas
are:
For 1990-2023 the changes per gas are: