Changes in PRIMAP-hist v2.6.1_final compared to v2.6_final for Switzerland
2025-03-19
Johannes Gütschow
Change analysis for Switzerland for PRIMAP-hist v2.6.1_final compared to v2.6_final
Overview over emissions by sector and gas
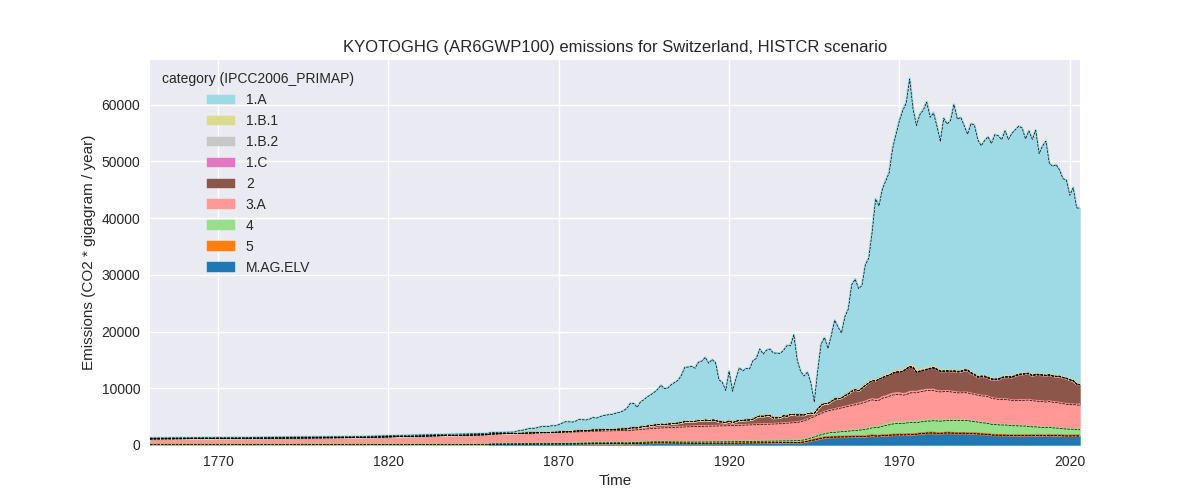
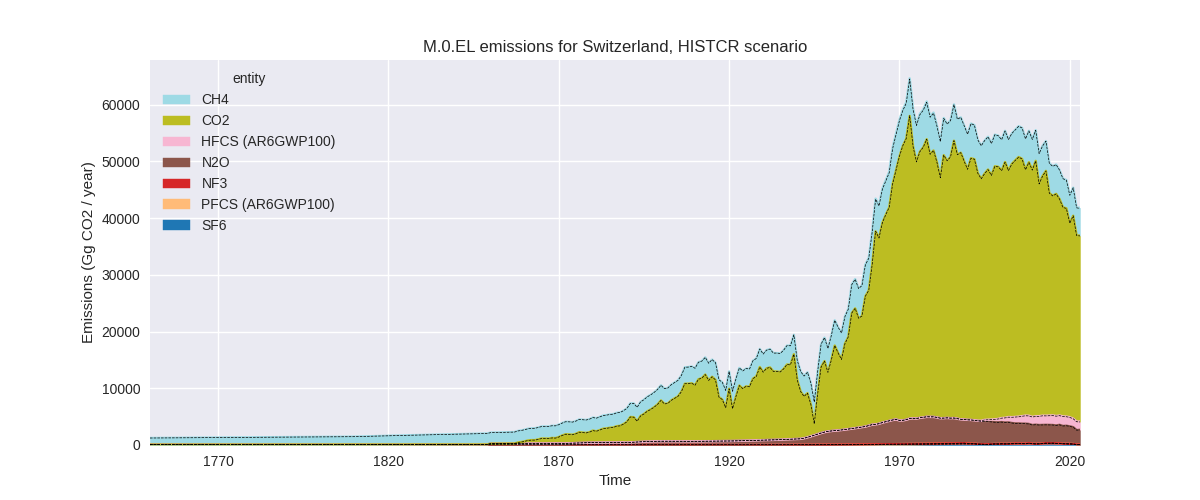
The following figures show the aggregate national total emissions excluding LULUCF AR6GWP100 for the country reported priority scenario. The dotted linesshow the v2.6_final data.
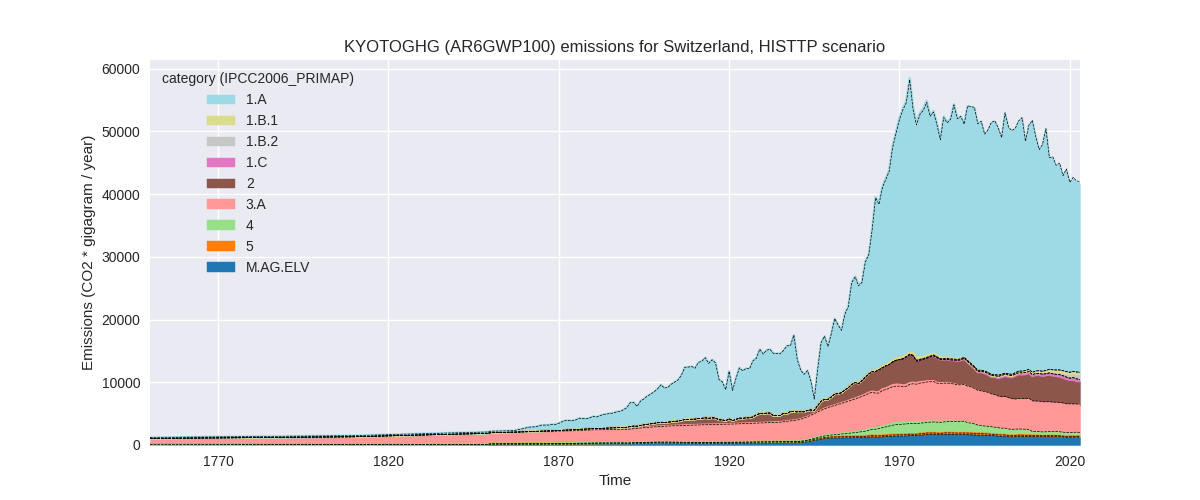
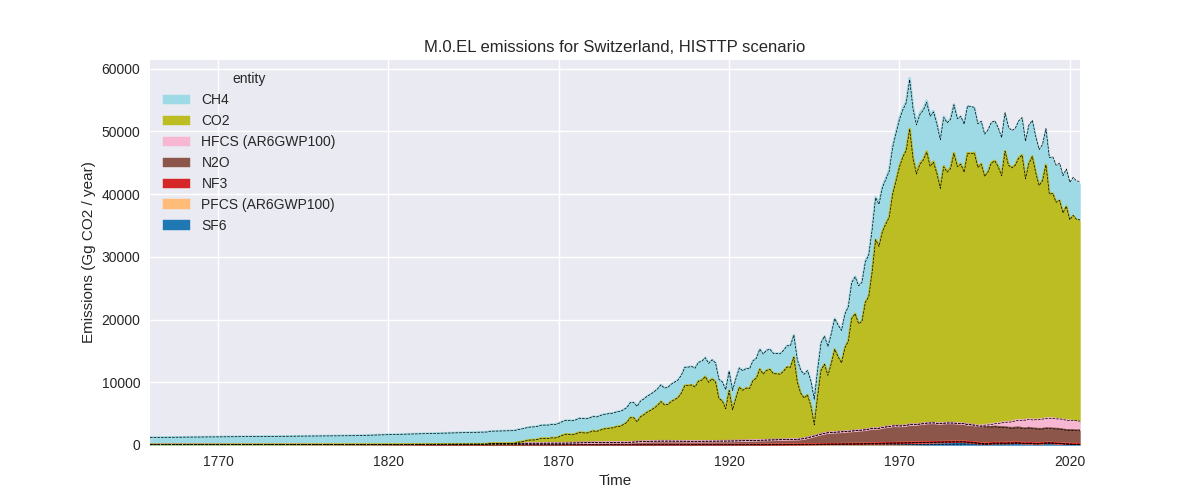
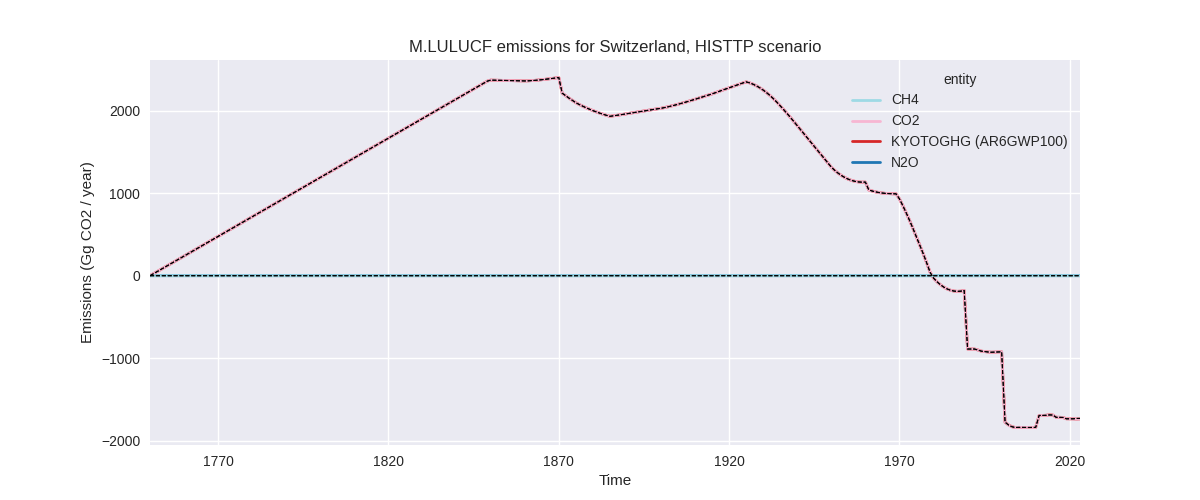
The following figures show the aggregate national total emissions excluding LULUCF AR6GWP100 for the third party priority scenario. The dotted linesshow the v2.6_final data.
Overview over changes
In the country reported priority scenario we have the following changes for aggregate Kyoto GHG and national total emissions excluding LULUCF (M.0.EL):
- Emissions in 2023 have changed by 0.3%% (111.47 Gg CO2 / year)
- Emissions in 1990-2023 have changed by 0.0%% (16.68 Gg CO2 / year)
In the third party priority scenario we have the following changes for aggregate Kyoto GHG and national total emissions excluding LULUCF (M.0.EL):
- Emissions in 2023 have changed by -0.7%% (-311.19 Gg CO2 / year)
- Emissions in 1990-2023 have changed by -0.4%% (-209.36 Gg CO2 / year)
Most important changes per scenario and time frame
In the country reported priority scenario the following sector-gas combinations have the highest absolute impact on national total KyotoGHG (AR6GWP100) emissions in 2023 (top 5):
- 1: M.AG.ELV, N2O with 46.90 Gg CO2 / year (3.0%)
- 2: 2, N2O with -41.10 Gg CO2 / year (-51.4%)
- 3: 3.A, CH4 with 40.55 Gg CO2 / year (1.0%)
- 4: 2, HFCS (AR6GWP100) with 27.76 Gg CO2 / year (2.0%)
- 5: 4, N2O with 20.72 Gg CO2 / year (3.6%)
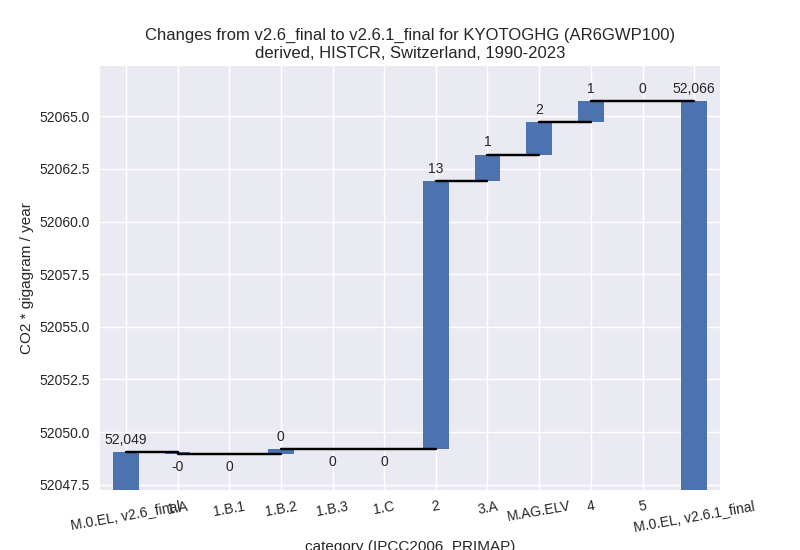
In the country reported priority scenario the following sector-gas combinations have the highest absolute impact on national total KyotoGHG (AR6GWP100) emissions in 1990-2023 (top 5):
- 1: 2, HFCS (AR6GWP100) with 13.74 Gg CO2 / year (1.3%)
- 2: M.AG.ELV, N2O with 1.38 Gg CO2 / year (0.1%)
- 3: 2, N2O with -1.21 Gg CO2 / year (-0.2%)
- 4: 3.A, CH4 with 1.19 Gg CO2 / year (0.0%)
- 5: 4, N2O with 0.61 Gg CO2 / year (0.1%)
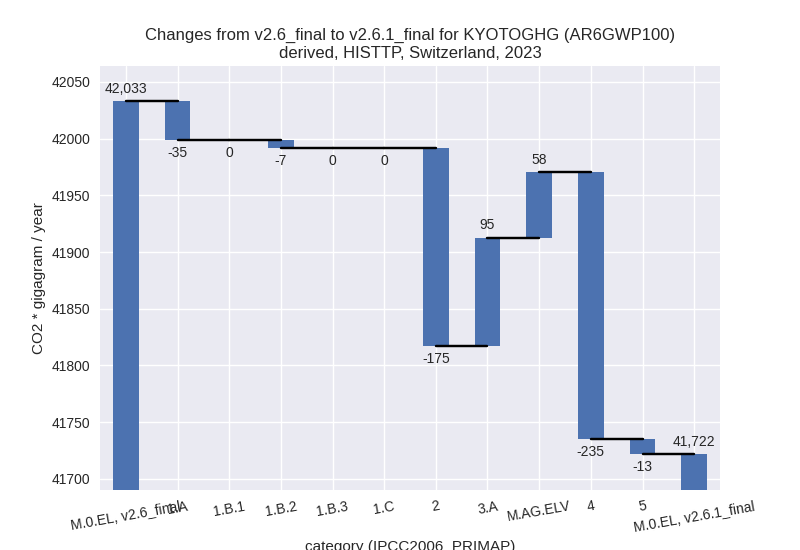
In the third party priority scenario the following sector-gas combinations have the highest absolute impact on national total KyotoGHG (AR6GWP100) emissions in 2023 (top 5):
- 1: 4, CH4 with -235.41 Gg CO2 / year (-50.9%)
- 2: 2, HFCS (AR6GWP100) with -206.03 Gg CO2 / year (-13.2%)
- 3: 2, SF6 with 106.91 Gg CO2 / year (663.2%)
- 4: 3.A, CH4 with 88.42 Gg CO2 / year (2.1%)
- 5: 2, CO2 with -61.32 Gg CO2 / year (-2.7%)
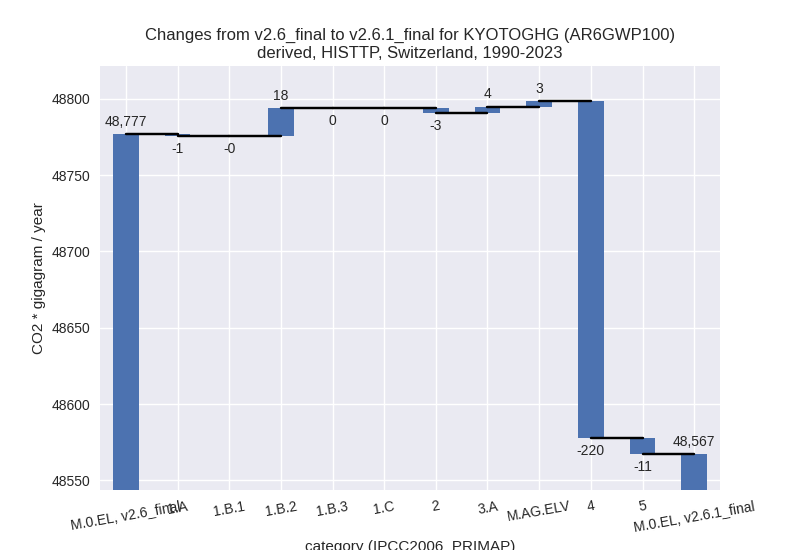
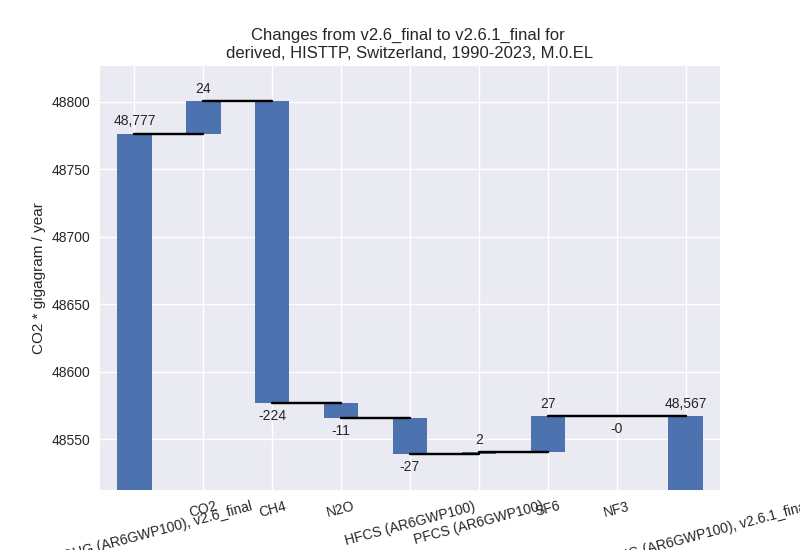
In the third party priority scenario the following sector-gas combinations have the highest absolute impact on national total KyotoGHG (AR6GWP100) emissions in 1990-2023 (top 5):
- 1: 4, CH4 with -220.48 Gg CO2 / year (-28.4%)
- 2: 2, HFCS (AR6GWP100) with -26.87 Gg CO2 / year (-2.5%)
- 3: 2, SF6 with 26.75 Gg CO2 / year (15.5%)
- 4: 1.B.2, CO2 with 24.22 Gg CO2 / year (443.4%)
- 5: 5, N2O with -10.62 Gg CO2 / year (-6.6%)
Notes on data changes
Here we list notes explaining important emissions changes for the country.
- CRT data has been included but replaces official data reported to the EU which does not show noteworthy differences. Changes in the CR time-series are small and come from updated third party data (EDGAR, FAO) which is used to extrapolate the country reported data.
- Changes in the TP scenario are small in terms of total emissions as well and due to input data updates (EDGAR,)
Changes by sector and gas
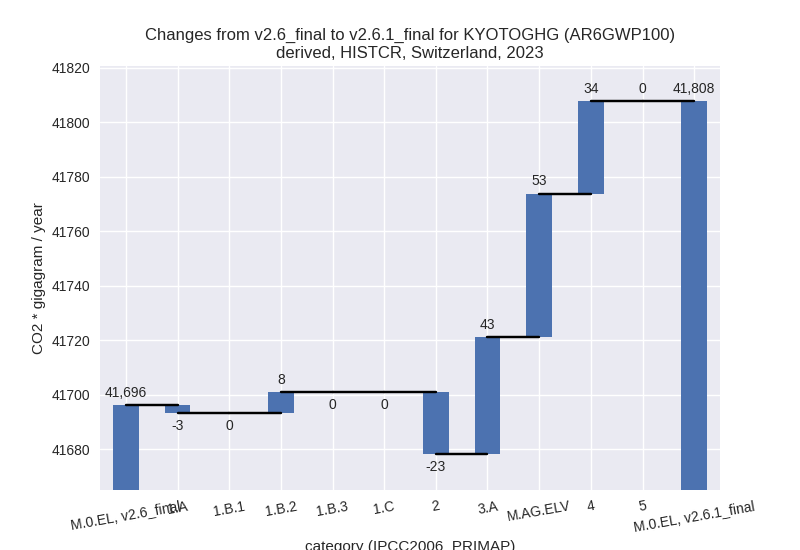
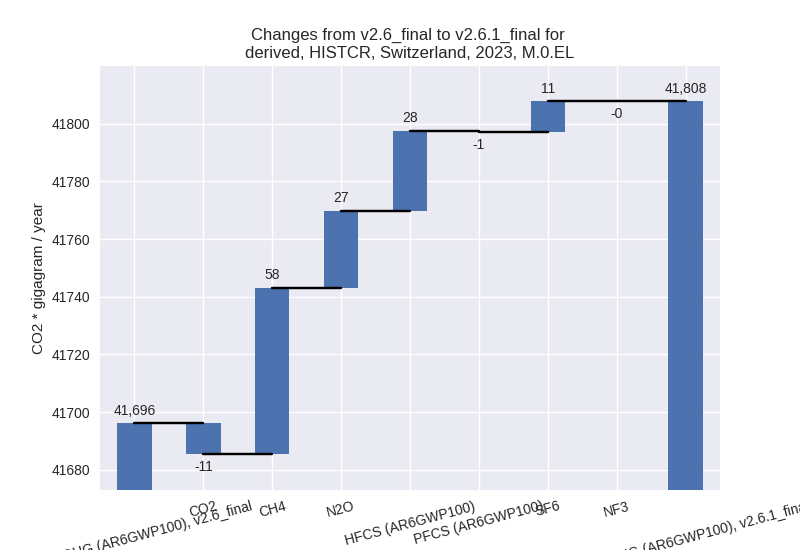
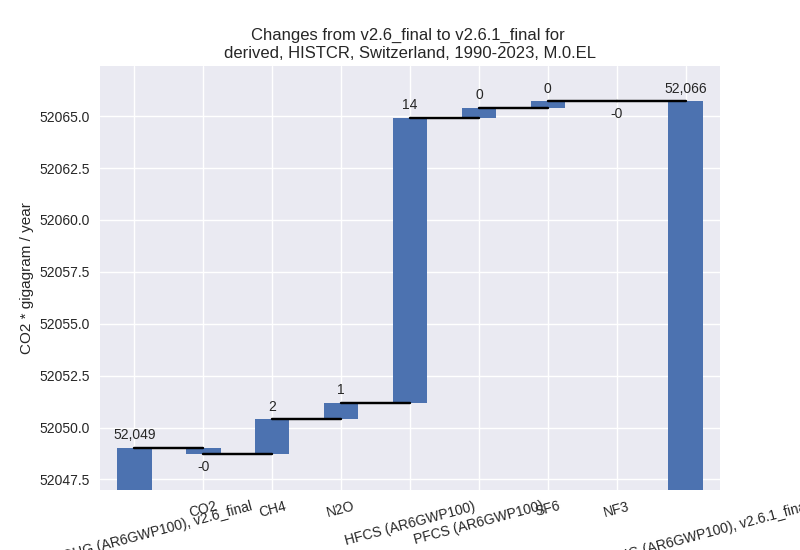
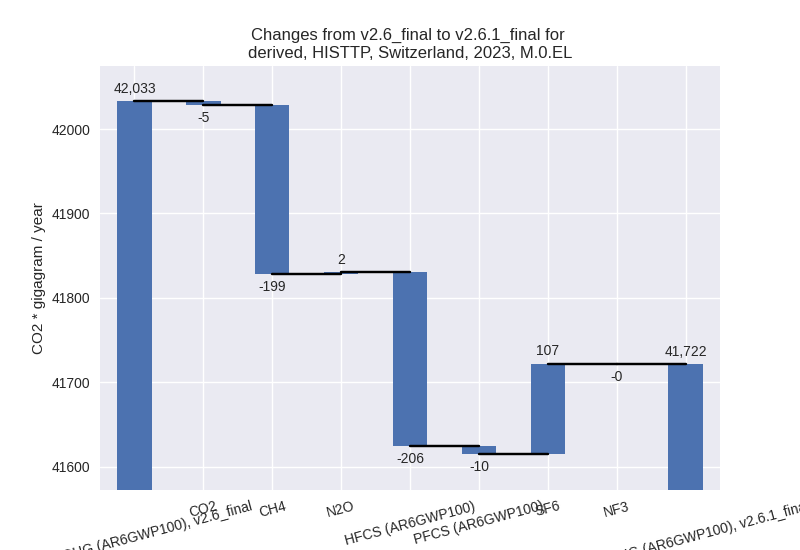
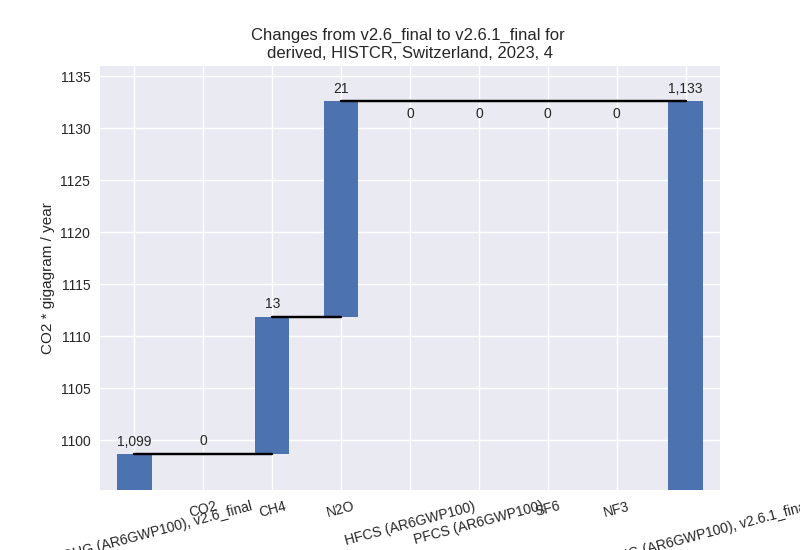
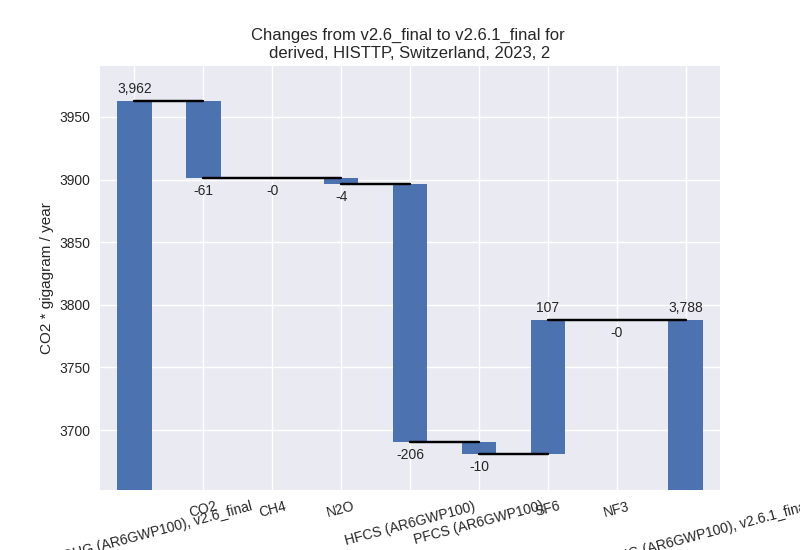
For each scenario and time frame the changes are displayed for all individual sectors and all individual gases. In the sector plot we use aggregate Kyoto GHGs in AR6GWP100. In the gas plot we usenational total emissions without LULUCF.
country reported scenario
2023
1990-2023
third party scenario
2023
1990-2023
Detailed changes for the scenarios:
country reported scenario (HISTCR):
Most important changes per time frame
For 2023 the following sector-gas combinations have the highest absolute impact on national total KyotoGHG (AR6GWP100) emissions in 2023 (top 5):
- 1: M.AG.ELV, N2O with 46.90 Gg CO2 / year (3.0%)
- 2: 2, N2O with -41.10 Gg CO2 / year (-51.4%)
- 3: 3.A, CH4 with 40.55 Gg CO2 / year (1.0%)
- 4: 2, HFCS (AR6GWP100) with 27.76 Gg CO2 / year (2.0%)
- 5: 4, N2O with 20.72 Gg CO2 / year (3.6%)
For 1990-2023 the following sector-gas combinations have the highest absolute impact on national total KyotoGHG (AR6GWP100) emissions in 1990-2023 (top 5):
- 1: 2, HFCS (AR6GWP100) with 13.74 Gg CO2 / year (1.3%)
- 2: M.AG.ELV, N2O with 1.38 Gg CO2 / year (0.1%)
- 3: 2, N2O with -1.21 Gg CO2 / year (-0.2%)
- 4: 3.A, CH4 with 1.19 Gg CO2 / year (0.0%)
- 5: 4, N2O with 0.61 Gg CO2 / year (0.1%)
Changes in the main sectors for aggregate KyotoGHG (AR6GWP100) are
- 1: Total sectoral emissions in 2022 are 31107.88 Gg CO2 / year which is 74.4% of M.0.EL emissions. 2023 Emissions have changed by 0.0% (4.79 Gg CO2 / year). 1990-2023 Emissions have changed by 0.0% (0.14 Gg CO2 / year).
- 2: Total sectoral emissions in 2022 are 3668.87 Gg CO2 / year which is 8.8% of M.0.EL emissions. 2023 Emissions have changed by -0.6% (-22.78 Gg CO2 / year). 1990-2023 Emissions have changed by 0.3% (12.73 Gg CO2 / year).
- M.AG: Total sectoral emissions in 2022 are 5921.12 Gg CO2 / year which is 14.2% of M.0.EL emissions. 2023 Emissions have changed by 1.6% (95.51 Gg CO2 / year). 1990-2023 Emissions have changed by 0.0% (2.81 Gg CO2 / year).
- 4: Total sectoral emissions in 2022 are 1125.47 Gg
CO2 / year which is 2.7% of M.0.EL emissions. 2023 Emissions have
changed by 3.1% (33.95 Gg CO2 /
year). 1990-2023 Emissions have changed by 0.1% (1.00 Gg CO2 / year). For 2023 the
changes per gas
are:
- 5: Total sectoral emissions in 2022 are 9.10 Gg CO2 / year which is 0.0% of M.0.EL emissions. 2023 Emissions have changed by 0.1% (0.01 Gg CO2 / year). 1990-2023 Emissions have changed by 0.0% (0.00 Gg CO2 / year).
third party scenario (HISTTP):
Most important changes per time frame
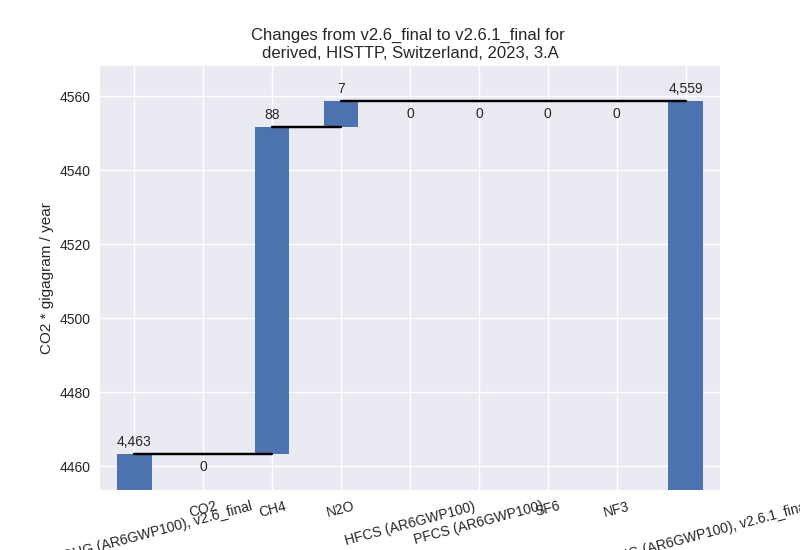
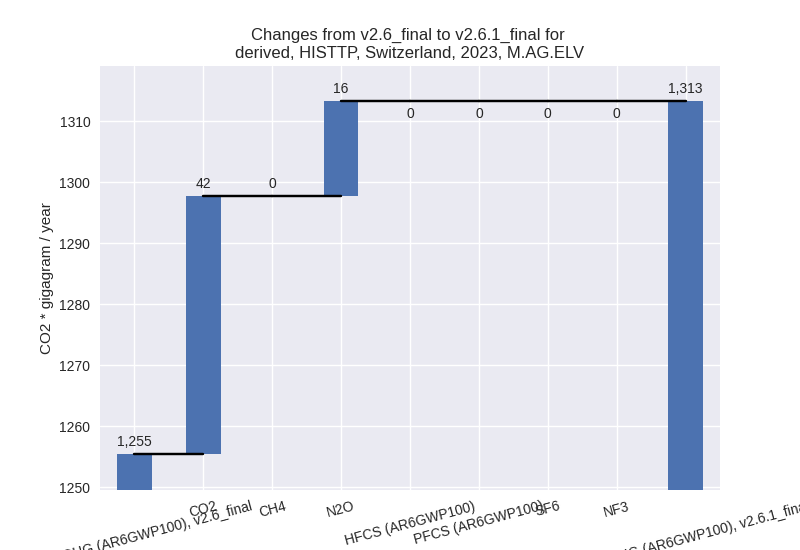
For 2023 the following sector-gas combinations have the highest absolute impact on national total KyotoGHG (AR6GWP100) emissions in 2023 (top 5):
- 1: 4, CH4 with -235.41 Gg CO2 / year (-50.9%)
- 2: 2, HFCS (AR6GWP100) with -206.03 Gg CO2 / year (-13.2%)
- 3: 2, SF6 with 106.91 Gg CO2 / year (663.2%)
- 4: 3.A, CH4 with 88.42 Gg CO2 / year (2.1%)
- 5: 2, CO2 with -61.32 Gg CO2 / year (-2.7%)
For 1990-2023 the following sector-gas combinations have the highest absolute impact on national total KyotoGHG (AR6GWP100) emissions in 1990-2023 (top 5):
- 1: 4, CH4 with -220.48 Gg CO2 / year (-28.4%)
- 2: 2, HFCS (AR6GWP100) with -26.87 Gg CO2 / year (-2.5%)
- 3: 2, SF6 with 26.75 Gg CO2 / year (15.5%)
- 4: 1.B.2, CO2 with 24.22 Gg CO2 / year (443.4%)
- 5: 5, N2O with -10.62 Gg CO2 / year (-6.6%)
Changes in the main sectors for aggregate KyotoGHG (AR6GWP100) are
- 1: Total sectoral emissions in 2022 are 31500.82 Gg CO2 / year which is 75.5% of M.0.EL emissions. 2023 Emissions have changed by -0.1% (-41.08 Gg CO2 / year). 1990-2023 Emissions have changed by 0.0% (17.17 Gg CO2 / year).
- 2: Total sectoral emissions in 2022 are 3873.32 Gg
CO2 / year which is 9.3% of M.0.EL emissions. 2023 Emissions have
changed by -4.4% (-174.85 Gg CO2 /
year). 1990-2023 Emissions have changed by -0.1% (-3.09 Gg CO2 / year). For 2023 the
changes per gas
are:
- M.AG: Total sectoral emissions in 2022 are 5821.76
Gg CO2 / year which is 14.0% of M.0.EL emissions. 2023 Emissions have
changed by 2.7% (153.30 Gg CO2 /
year). 1990-2023 Emissions have changed by 0.1% (7.63 Gg CO2 / year). For 2023 the
changes per gas
are:

The changes come from the following subsectors:- 3.A: Total sectoral emissions in 2022 are 4554.50
Gg CO2 / year which is 78.2% of category M.AG emissions. 2023 Emissions
have changed by 2.1% (95.45 Gg CO2 /
year). 1990-2023 Emissions have changed by 0.1% (4.21 Gg CO2 / year). For 2023 the
changes per gas
are:
There is no subsector information available in PRIMAP-hist. - M.AG.ELV: Total sectoral emissions in 2022 are
1267.26 Gg CO2 / year which is 21.8% of category M.AG emissions. 2023
Emissions have changed by 4.6%
(57.85 Gg CO2 / year). 1990-2023 Emissions have changed by 0.2% (3.42 Gg CO2 / year). For 2023 the
changes per gas
are:
There is no subsector information available in PRIMAP-hist.
- 3.A: Total sectoral emissions in 2022 are 4554.50
Gg CO2 / year which is 78.2% of category M.AG emissions. 2023 Emissions
have changed by 2.1% (95.45 Gg CO2 /
year). 1990-2023 Emissions have changed by 0.1% (4.21 Gg CO2 / year). For 2023 the
changes per gas
are:
- 4: Total sectoral emissions in 2022 are 416.26 Gg
CO2 / year which is 1.0% of M.0.EL emissions. 2023 Emissions have
changed by -36.0% (-235.17 Gg CO2 /
year). 1990-2023 Emissions have changed by -23.3% (-220.45 Gg CO2 / year). For 2023
the changes per gas
are:

For 1990-2023 the changes per gas are: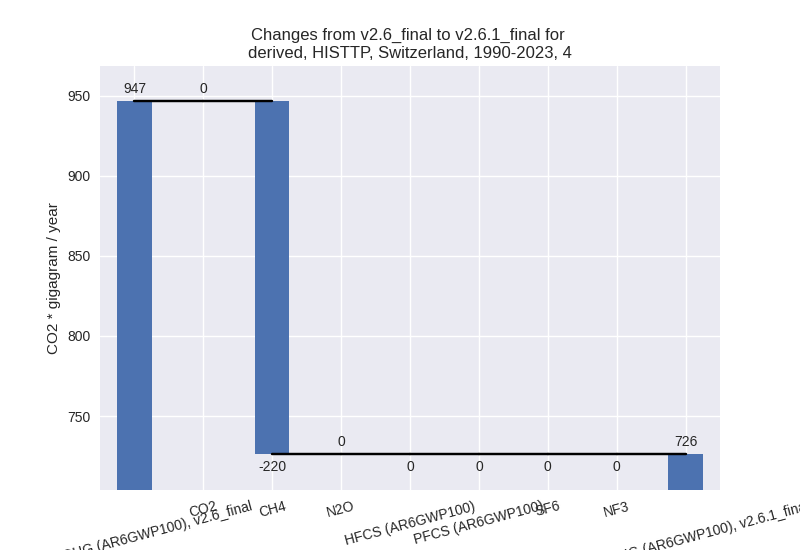
- 5: Total sectoral emissions in 2022 are 96.73 Gg
CO2 / year which is 0.2% of M.0.EL emissions. 2023 Emissions have
changed by -12.3% (-13.39 Gg CO2 /
year). 1990-2023 Emissions have changed by -6.1% (-10.62 Gg CO2 / year). For 2023 the
changes per gas
are:
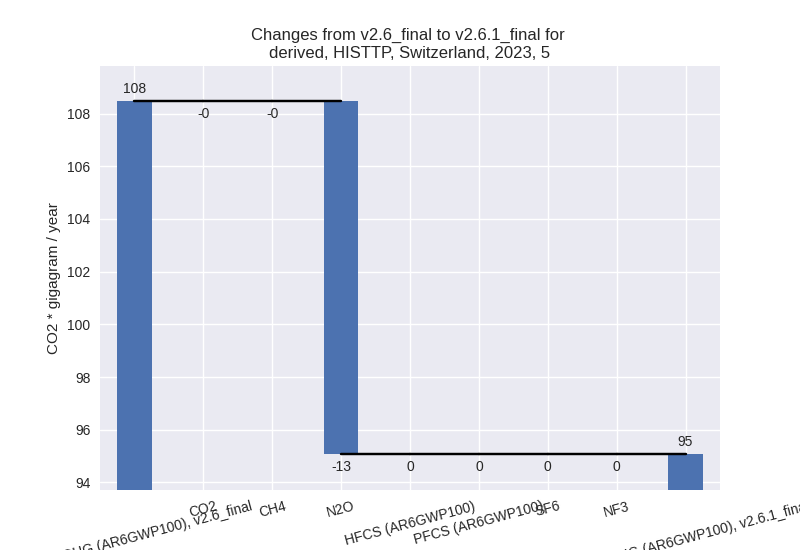
For 1990-2023 the changes per gas are: