Changes in PRIMAP-hist v2.6.1_final compared to v2.6_final for Côte d’Ivoire
2025-03-19
Johannes Gütschow
Change analysis for Côte d’Ivoire for PRIMAP-hist v2.6.1_final compared to v2.6_final
Overview over emissions by sector and gas
The following figures show the aggregate national total emissions excluding LULUCF AR6GWP100 for the country reported priority scenario. The dotted linesshow the v2.6_final data.
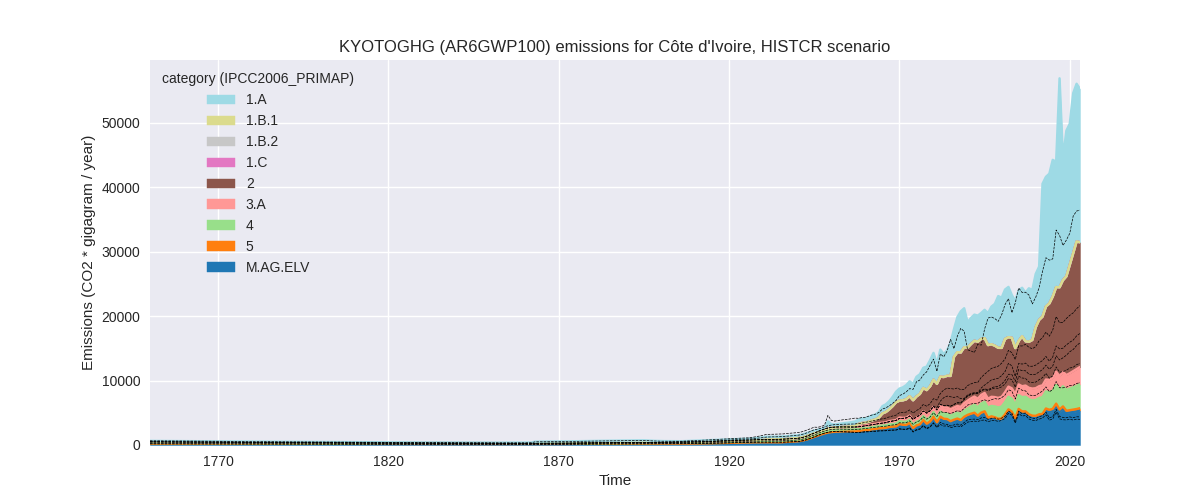
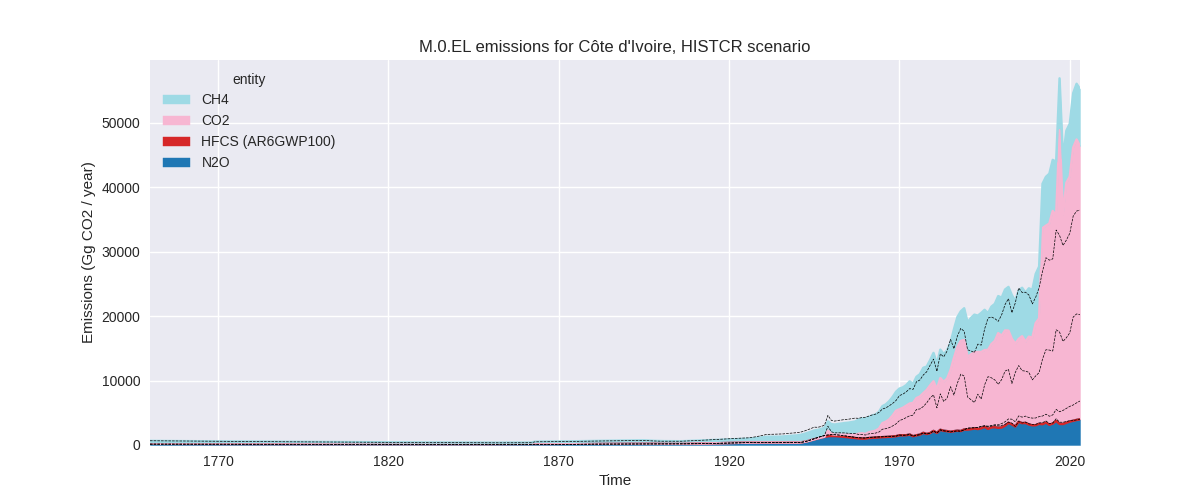
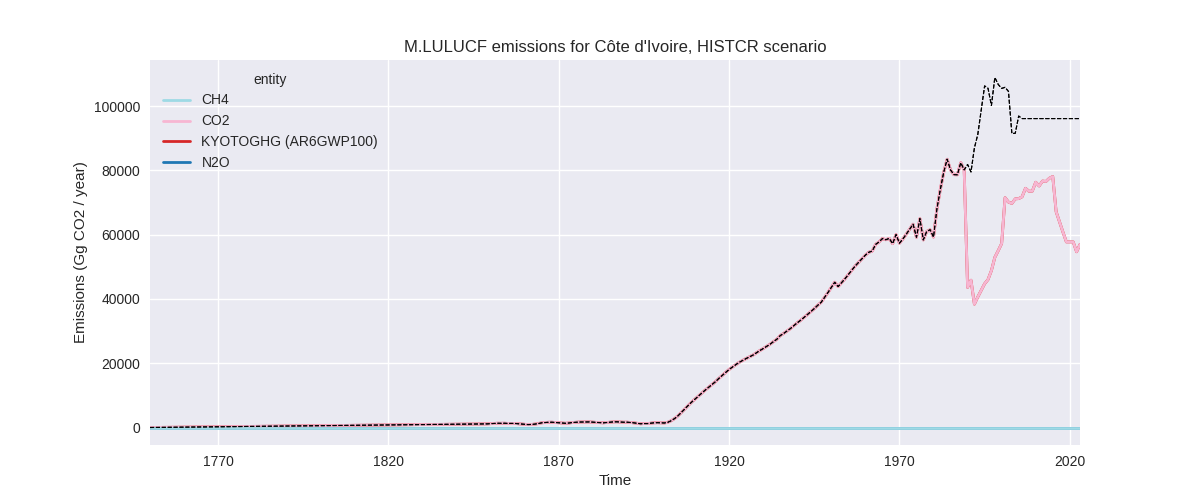
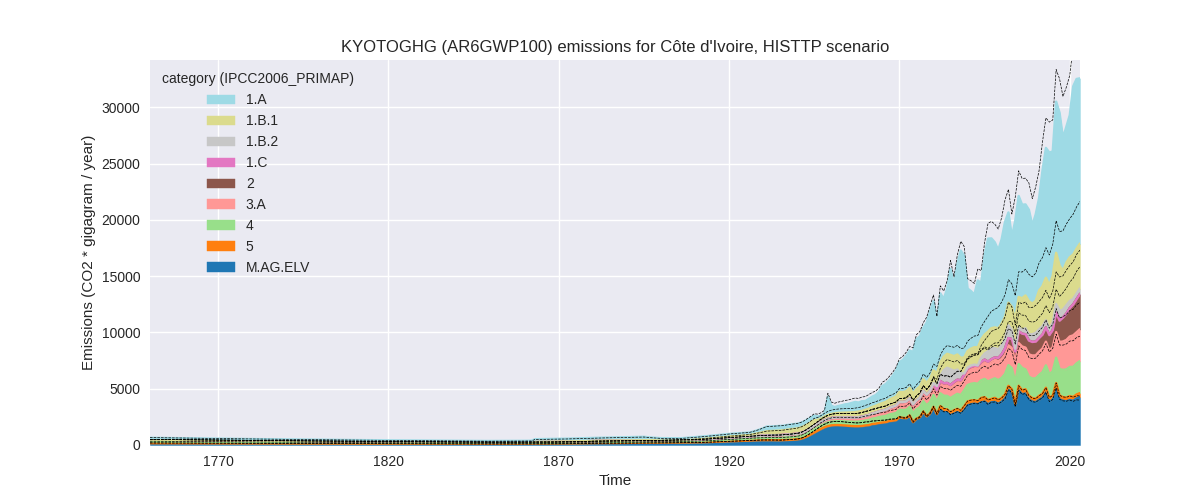
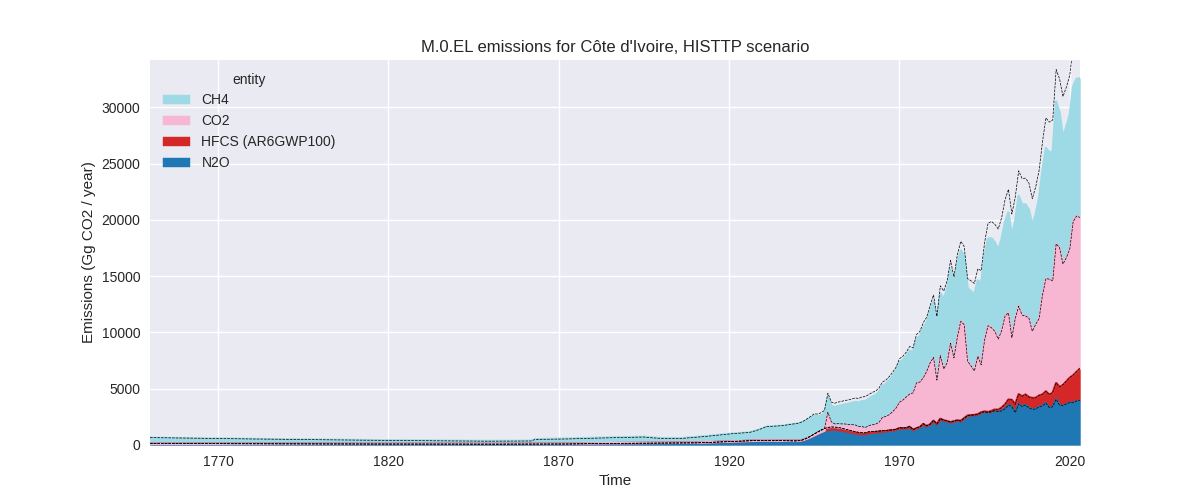
The following figures show the aggregate national total emissions excluding LULUCF AR6GWP100 for the third party priority scenario. The dotted linesshow the v2.6_final data.
Overview over changes
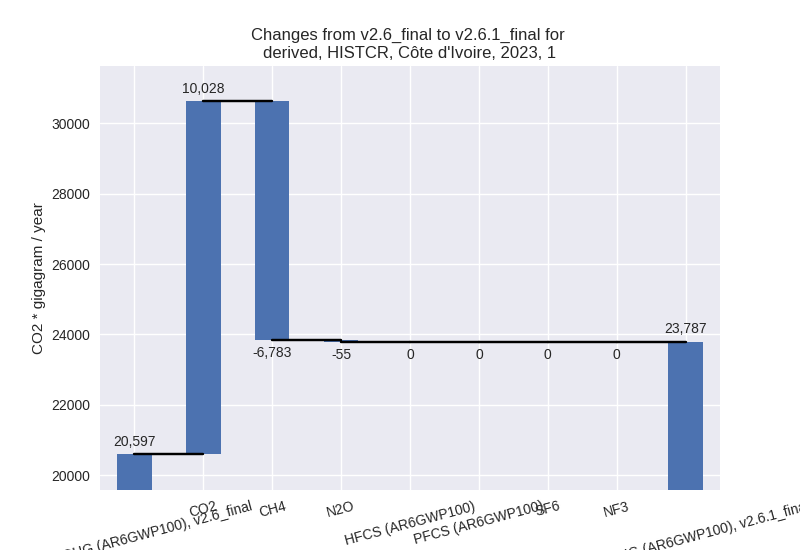
In the country reported priority scenario we have the following changes for aggregate Kyoto GHG and national total emissions excluding LULUCF (M.0.EL):
- Emissions in 2023 have changed by 51.6%% (18806.27 Gg CO2 / year)
- Emissions in 1990-2023 have changed by 30.4%% (7397.12 Gg CO2 / year)
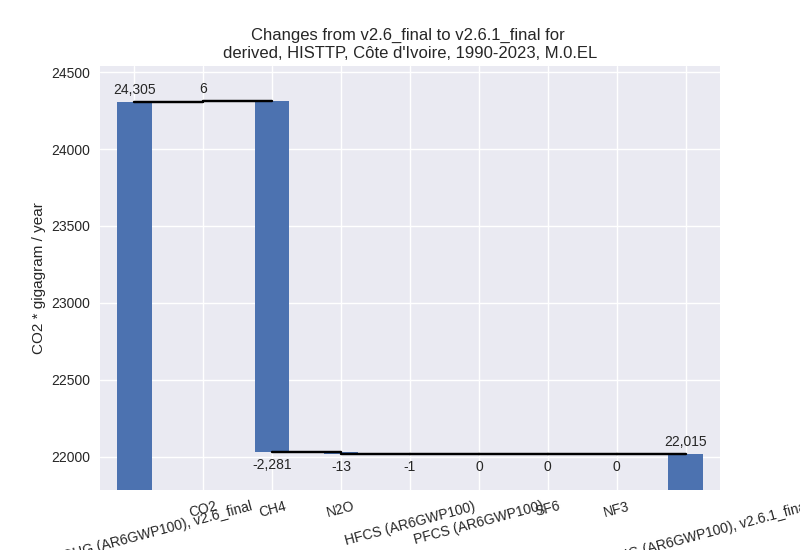
In the third party priority scenario we have the following changes for aggregate Kyoto GHG and national total emissions excluding LULUCF (M.0.EL):
- Emissions in 2023 have changed by -10.6%% (-3866.74 Gg CO2 / year)
- Emissions in 1990-2023 have changed by -9.4%% (-2289.53 Gg CO2 / year)
Most important changes per scenario and time frame
In the country reported priority scenario the following sector-gas combinations have the highest absolute impact on national total KyotoGHG (AR6GWP100) emissions in 2023 (top 5):
- 1: 2, CO2 with 19019.47 Gg CO2 / year (5578.3%)
- 2: 1.A, CO2 with 10054.02 Gg CO2 / year (77.7%)
- 3: 1.B.1, CH4 with -4258.85 Gg CO2 / year (-100.0%)
- 4: 2, HFCS (AR6GWP100) with -2837.02 Gg CO2 / year (-100.0%)
- 5: 4, CH4 with -1639.01 Gg CO2 / year (-32.7%)
In the country reported priority scenario the following sector-gas combinations have the highest absolute impact on national total KyotoGHG (AR6GWP100) emissions in 1990-2023 (top 5):
- 1: 2, CO2 with 10257.20 Gg CO2 / year (5363.2%)
- 2: 1.A, CO2 with 3178.04 Gg CO2 / year (40.7%)
- 3: 1.B.1, CH4 with -2806.09 Gg CO2 / year (-100.0%)
- 4: 4, CH4 with -1356.60 Gg CO2 / year (-39.6%)
- 5: 1.B.2, CH4 with -1011.67 Gg CO2 / year (-99.8%)
In the third party priority scenario the following sector-gas combinations have the highest absolute impact on national total KyotoGHG (AR6GWP100) emissions in 2023 (top 5):
- 1: 4, CH4 with -2479.23 Gg CO2 / year (-49.5%)
- 2: 1.B.2, CH4 with -1028.35 Gg CO2 / year (-71.3%)
- 3: 1.B.1, CH4 with -318.65 Gg CO2 / year (-7.5%)
- 4: M.AG.ELV, CH4 with 243.31 Gg CO2 / year (24.4%)
- 5: 3.A, CH4 with -171.67 Gg CO2 / year (-5.9%)
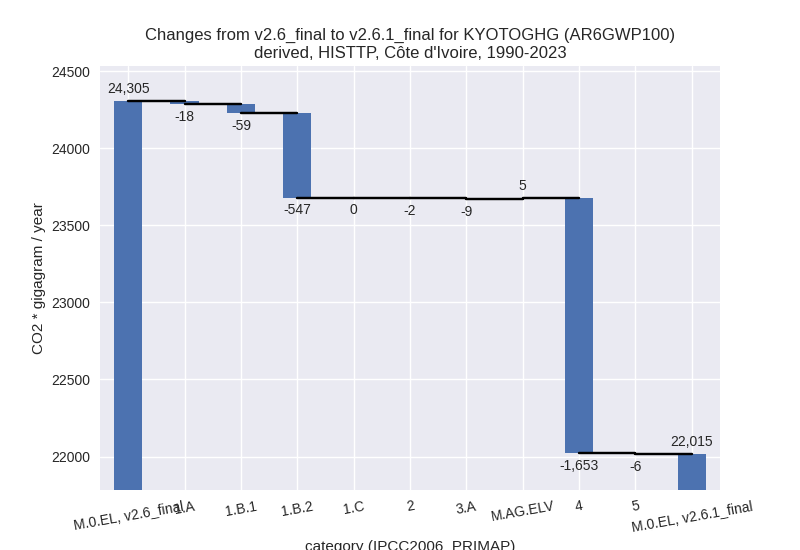
In the third party priority scenario the following sector-gas combinations have the highest absolute impact on national total KyotoGHG (AR6GWP100) emissions in 1990-2023 (top 5):
- 1: 4, CH4 with -1658.60 Gg CO2 / year (-48.5%)
- 2: 1.B.2, CH4 with -545.45 Gg CO2 / year (-53.8%)
- 3: 1.B.1, CH4 with -57.93 Gg CO2 / year (-2.1%)
- 4: 1.A, CH4 with -17.54 Gg CO2 / year (-1.5%)
- 5: 3.A, CH4 with -9.00 Gg CO2 / year (-0.5%)
Notes on data changes
Here we list notes explaining important emissions changes for the country.
- CRT data from BTR1 covering 1990-2022 replaces and extends BUR1
data.
- The high emissions increase in sector 1.A (CR) comes from a high emissions increase in petroleum refining (1.A.1.b) from 2011 to 2012
- The high emission increase in the IPPU sector is from lubricant use reported in 2.D. Some other countries report this in 1.A where Côte d’Ivoire reports no details in the CRT files. However, the reported emissions are almost as high as the total emissions in 1.A in 2022 and much higher than fuel related transport emissions which sheds doubt on their reliability.
- Changes in the TP time-series come from updated EDGAR and FAO data. FAO has adjusted data for the latest years while EDGAR has updated full time-series with the main change coming from the waste sector.
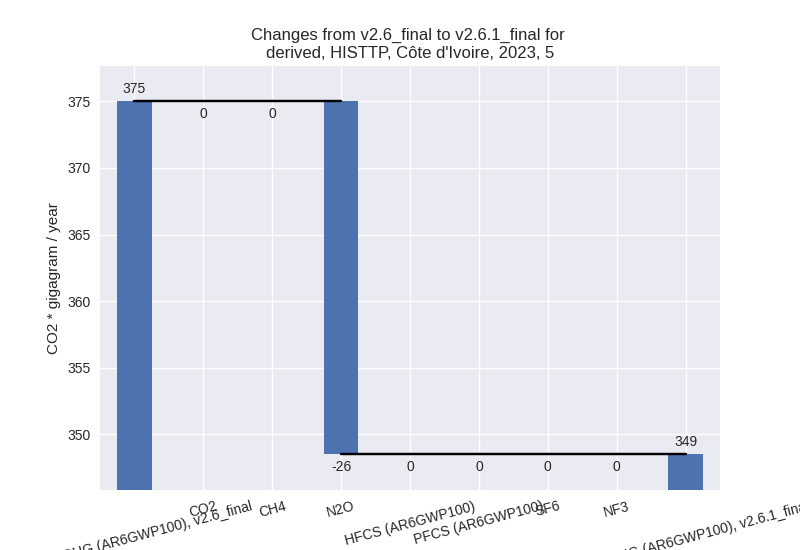
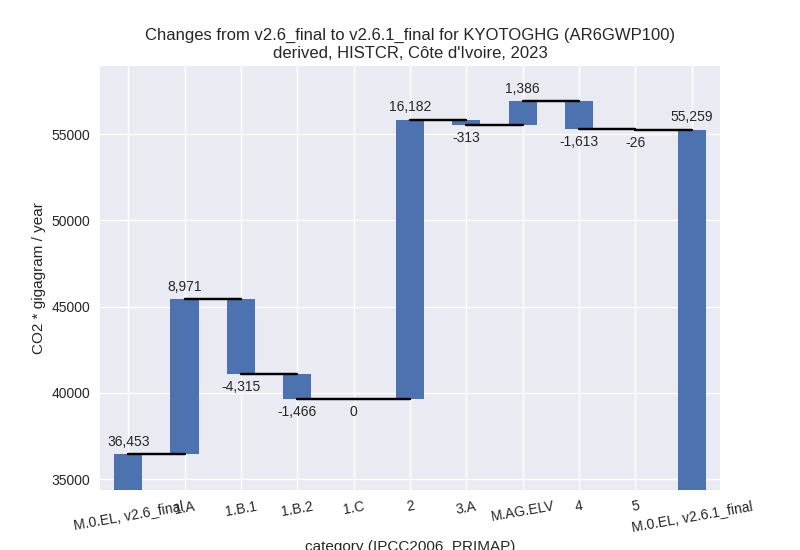
Changes by sector and gas
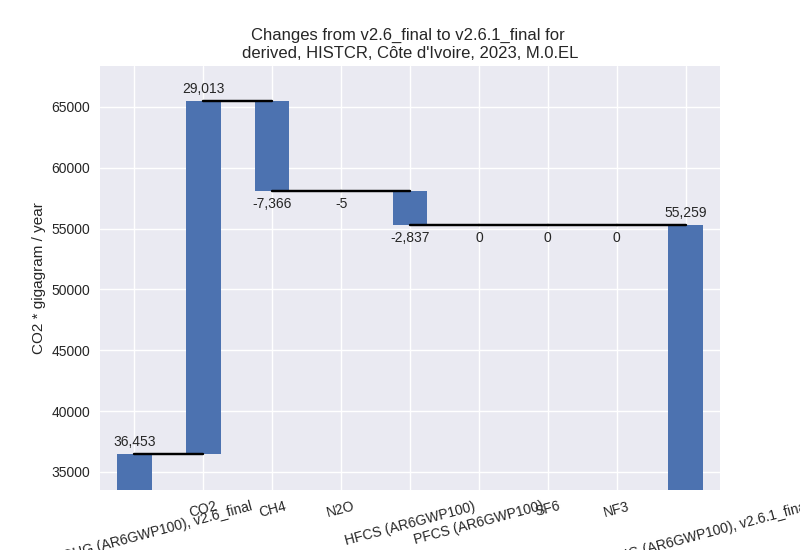
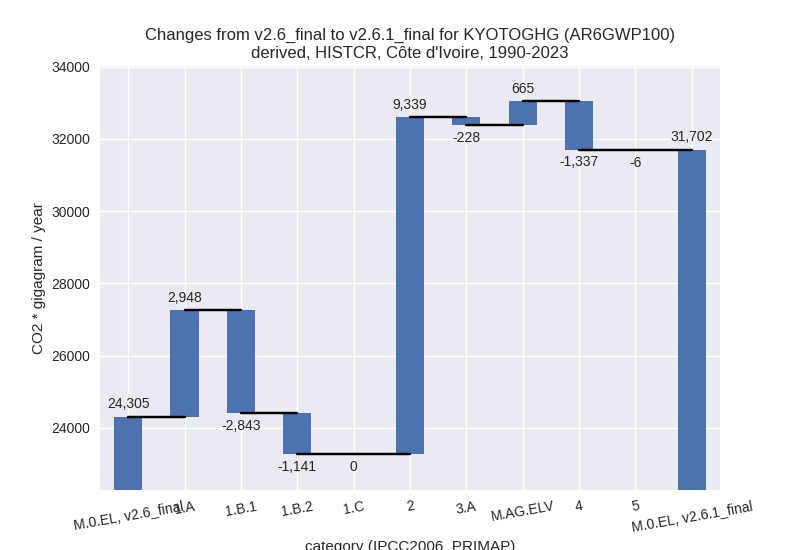
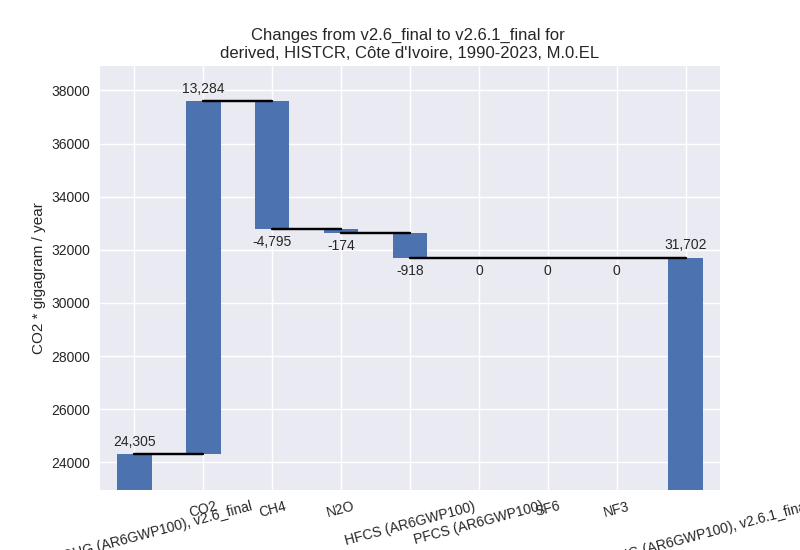
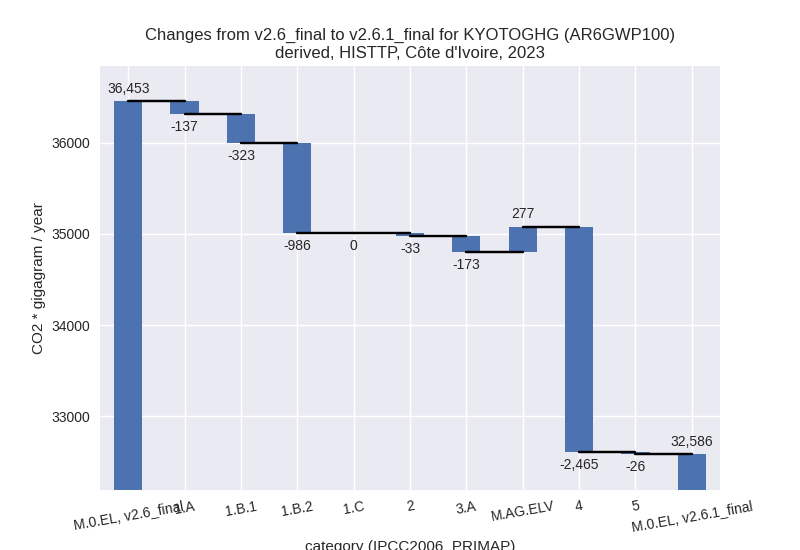
For each scenario and time frame the changes are displayed for all individual sectors and all individual gases. In the sector plot we use aggregate Kyoto GHGs in AR6GWP100. In the gas plot we usenational total emissions without LULUCF.
country reported scenario
2023
1990-2023
third party scenario
2023

1990-2023
Detailed changes for the scenarios:
country reported scenario (HISTCR):
Most important changes per time frame
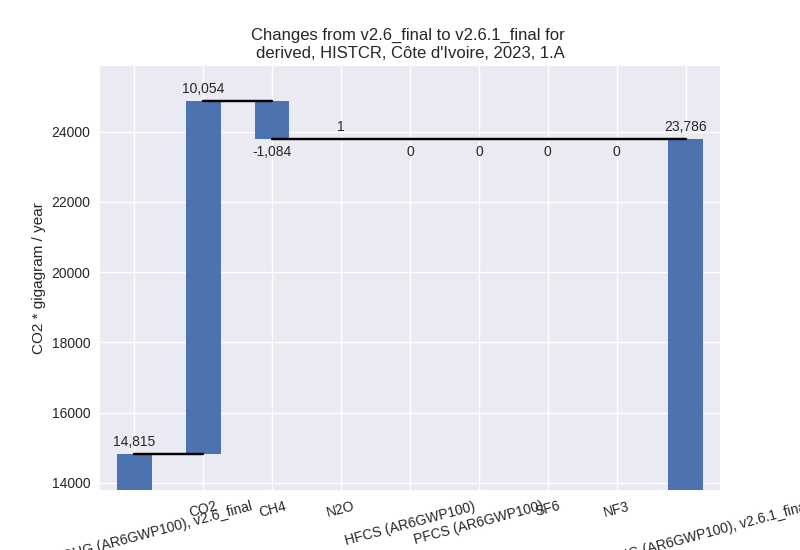
For 2023 the following sector-gas combinations have the highest absolute impact on national total KyotoGHG (AR6GWP100) emissions in 2023 (top 5):
- 1: 2, CO2 with 19019.47 Gg CO2 / year (5578.3%)
- 2: 1.A, CO2 with 10054.02 Gg CO2 / year (77.7%)
- 3: 1.B.1, CH4 with -4258.85 Gg CO2 / year (-100.0%)
- 4: 2, HFCS (AR6GWP100) with -2837.02 Gg CO2 / year (-100.0%)
- 5: 4, CH4 with -1639.01 Gg CO2 / year (-32.7%)
For 1990-2023 the following sector-gas combinations have the highest absolute impact on national total KyotoGHG (AR6GWP100) emissions in 1990-2023 (top 5):
- 1: 2, CO2 with 10257.20 Gg CO2 / year (5363.2%)
- 2: 1.A, CO2 with 3178.04 Gg CO2 / year (40.7%)
- 3: 1.B.1, CH4 with -2806.09 Gg CO2 / year (-100.0%)
- 4: 4, CH4 with -1356.60 Gg CO2 / year (-39.6%)
- 5: 1.B.2, CH4 with -1011.67 Gg CO2 / year (-99.8%)
Changes in the main sectors for aggregate KyotoGHG (AR6GWP100) are
- 1: Total sectoral emissions in 2022 are 24496.10 Gg
CO2 / year which is 43.7% of M.0.EL emissions. 2023 Emissions have
changed by 15.5% (3190.05 Gg CO2 /
year). 1990-2023 Emissions have changed by -7.9% (-1036.50 Gg CO2 / year). For 2023
the changes per gas
are:
For 1990-2023 the changes per gas are: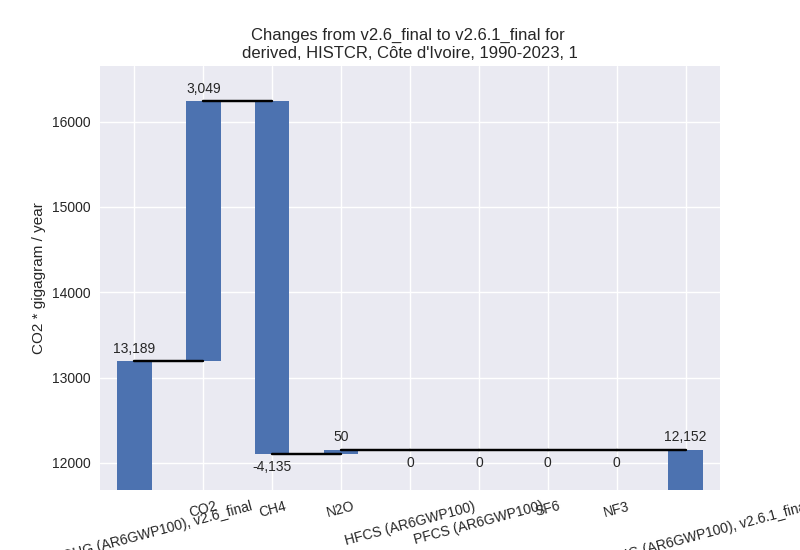
The changes come from the following subsectors:- 1.A: Total sectoral emissions in 2022 are 24494.68
Gg CO2 / year which is 100.0% of category 1 emissions. 2023 Emissions
have changed by 60.6% (8971.41 Gg
CO2 / year). 1990-2023 Emissions have changed by 32.0% (2948.25 Gg CO2 / year). For 2023
the changes per gas
are:
For 1990-2023 the changes per gas are: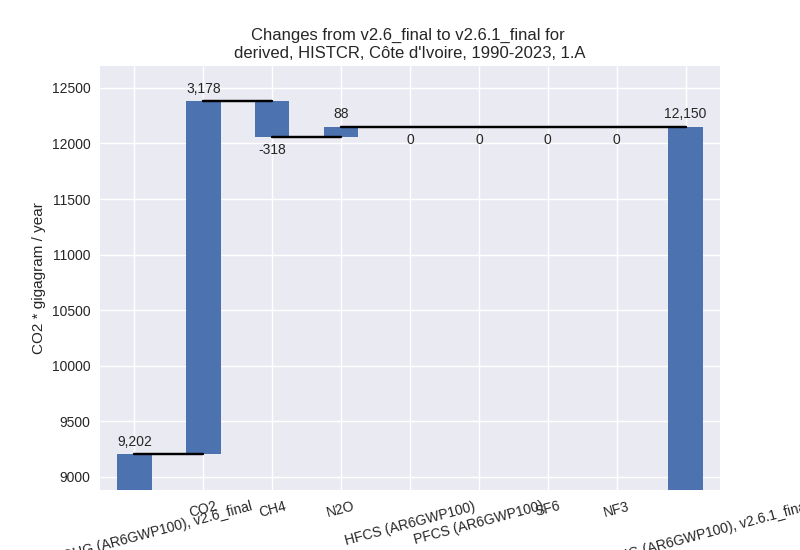
There is no subsector information available in PRIMAP-hist. - 1.B.1: Total sectoral emissions in 2022 are 0.00 Gg
CO2 / year which is 0.0% of category 1 emissions. 2023 Emissions have
changed by -100.0% (-4315.31 Gg CO2
/ year). 1990-2023 Emissions have changed by -100.0% (-2843.29 Gg CO2 / year). For 2023
the changes per gas
are:
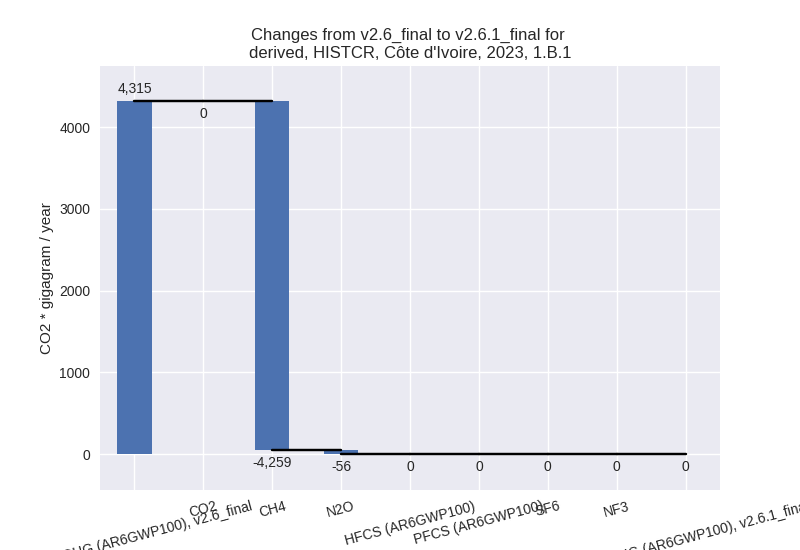
For 1990-2023 the changes per gas are: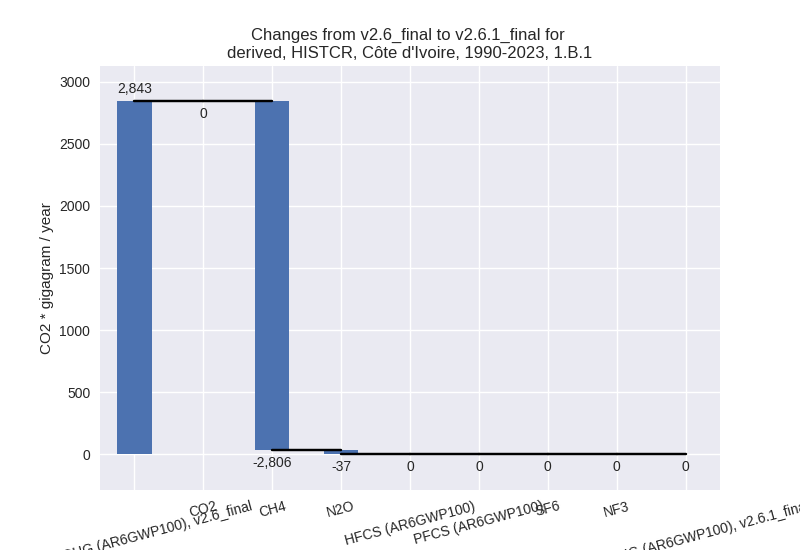
There is no subsector information available in PRIMAP-hist. - 1.B.2: Total sectoral emissions in 2022 are 1.42 Gg
CO2 / year which is 0.0% of category 1 emissions. 2023 Emissions have
changed by -99.9% (-1466.05 Gg CO2 /
year). 1990-2023 Emissions have changed by -99.8% (-1141.45 Gg CO2 / year). For 2023
the changes per gas
are:
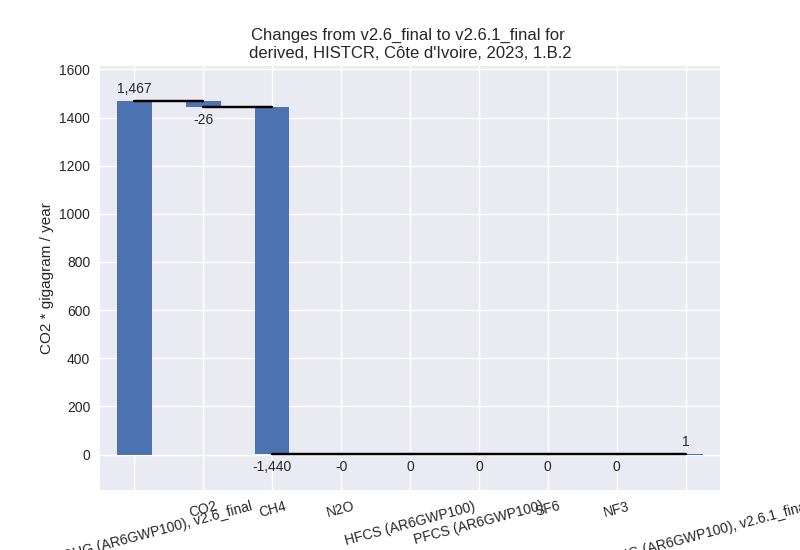
For 1990-2023 the changes per gas are: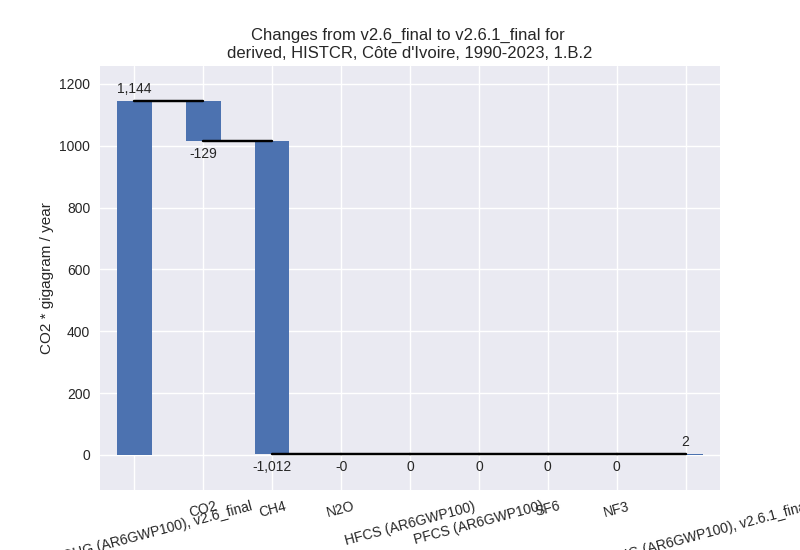
There is no subsector information available in PRIMAP-hist.
- 1.A: Total sectoral emissions in 2022 are 24494.68
Gg CO2 / year which is 100.0% of category 1 emissions. 2023 Emissions
have changed by 60.6% (8971.41 Gg
CO2 / year). 1990-2023 Emissions have changed by 32.0% (2948.25 Gg CO2 / year). For 2023
the changes per gas
are:
- 2: Total sectoral emissions in 2022 are 19781.79 Gg
CO2 / year which is 35.3% of M.0.EL emissions. 2023 Emissions have
changed by 509.2% (16182.37 Gg CO2 /
year). 1990-2023 Emissions have changed by 842.1% (9339.35 Gg CO2 / year). For 2023
the changes per gas
are:
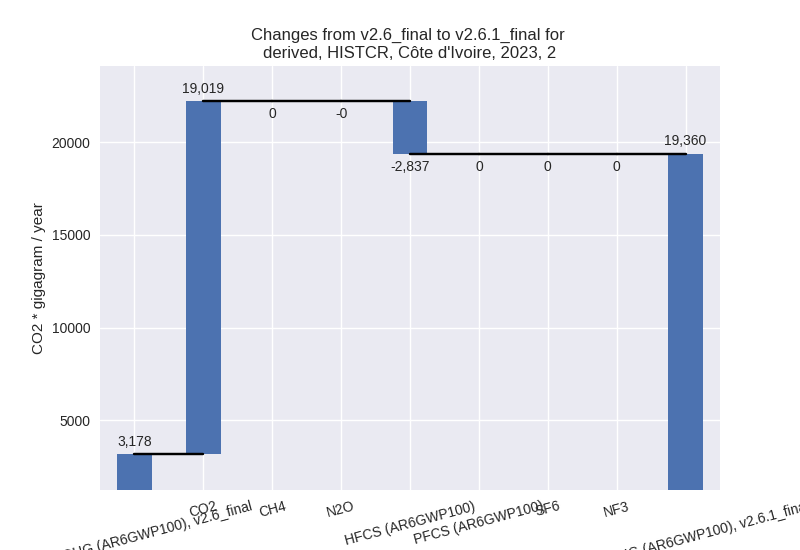
For 1990-2023 the changes per gas are: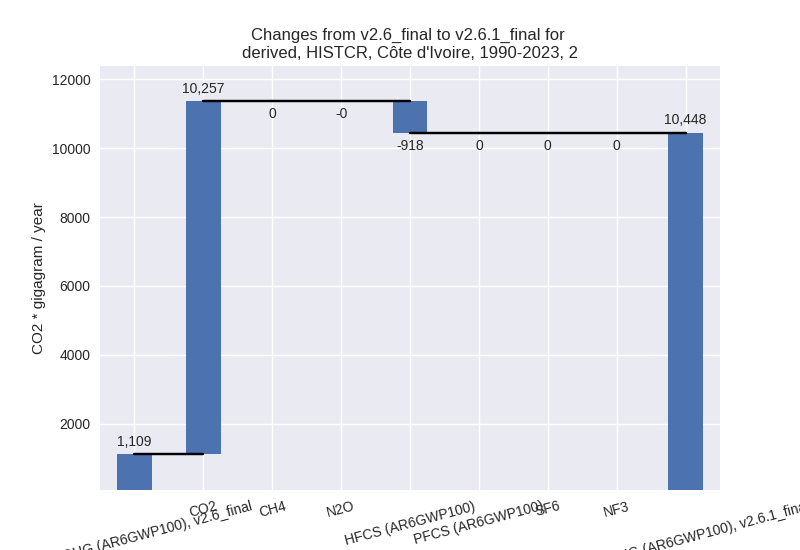
- M.AG: Total sectoral emissions in 2022 are 7850.32
Gg CO2 / year which is 14.0% of M.0.EL emissions. 2023 Emissions have
changed by 15.4% (1073.54 Gg CO2 /
year). 1990-2023 Emissions have changed by 7.2% (436.95 Gg CO2 / year). For 2023 the
changes per gas
are:
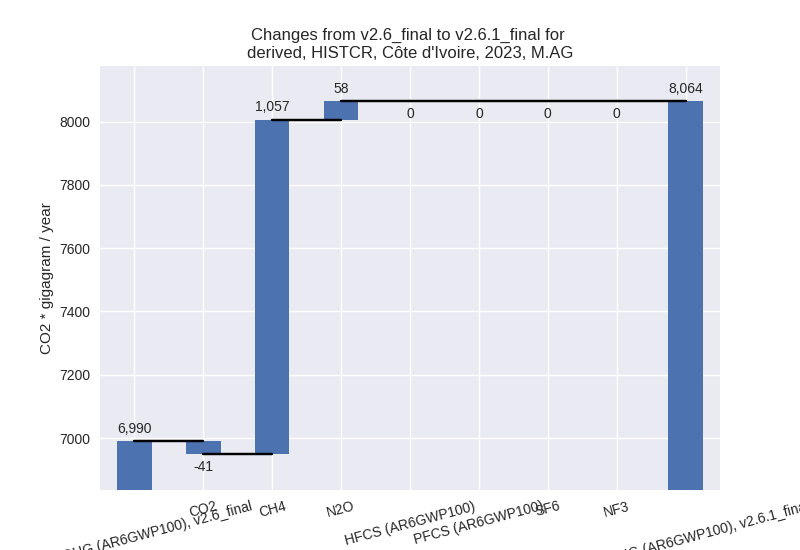
For 1990-2023 the changes per gas are: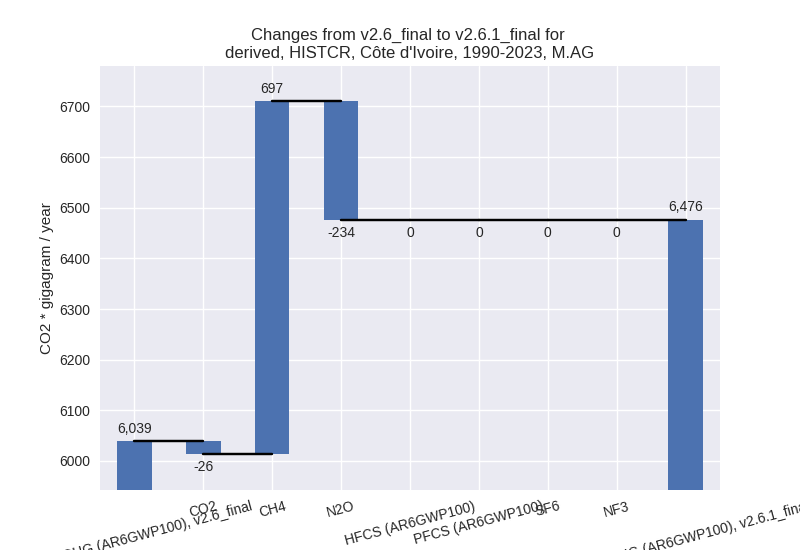
The changes come from the following subsectors:- 3.A: Total sectoral emissions in 2022 are 2625.40
Gg CO2 / year which is 33.4% of category M.AG emissions. 2023 Emissions
have changed by -10.4% (-312.69 Gg
CO2 / year). 1990-2023 Emissions have changed by -11.4% (-228.32 Gg CO2 / year). For 2023
the changes per gas
are:

For 1990-2023 the changes per gas are: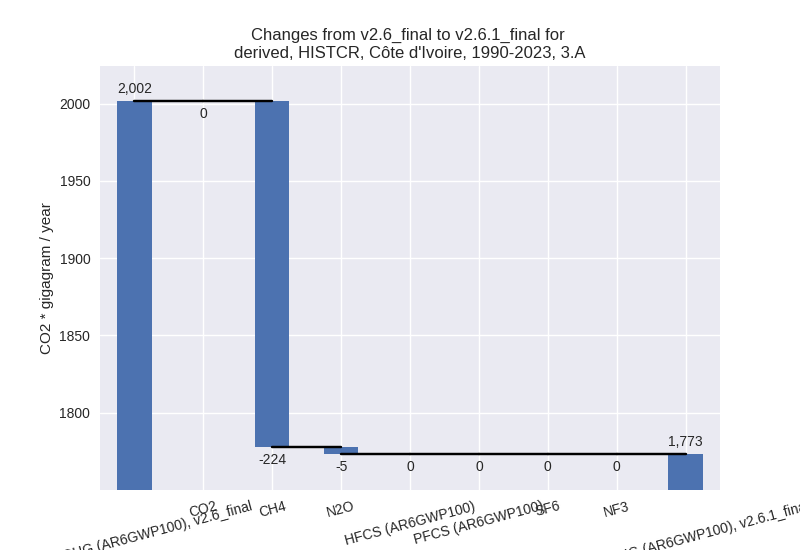
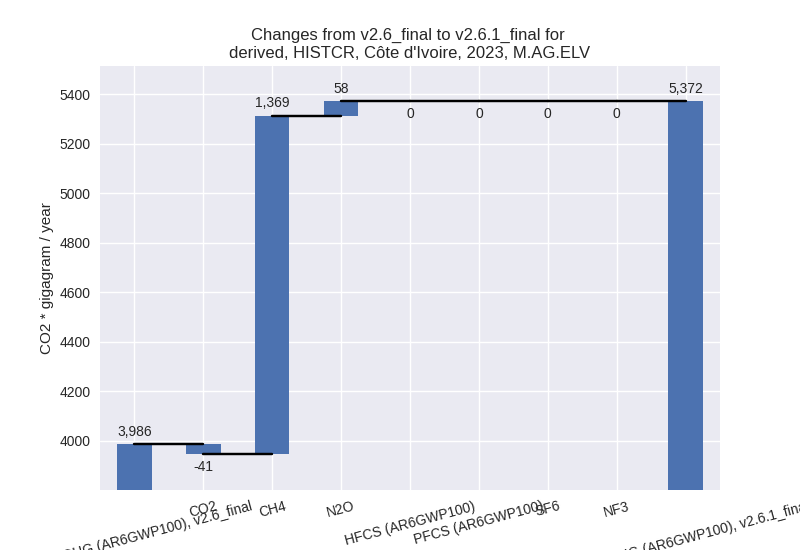
There is no subsector information available in PRIMAP-hist. - M.AG.ELV: Total sectoral emissions in 2022 are
5224.91 Gg CO2 / year which is 66.6% of category M.AG emissions. 2023
Emissions have changed by 34.8%
(1386.23 Gg CO2 / year). 1990-2023 Emissions have changed by 16.5% (665.27 Gg CO2 / year). For 2023 the
changes per gas
are:
For 1990-2023 the changes per gas are: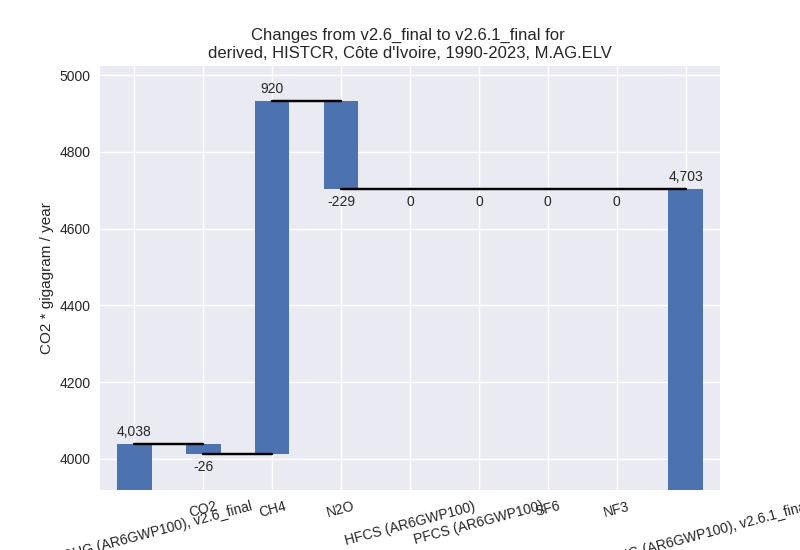
There is no subsector information available in PRIMAP-hist.
- 3.A: Total sectoral emissions in 2022 are 2625.40
Gg CO2 / year which is 33.4% of category M.AG emissions. 2023 Emissions
have changed by -10.4% (-312.69 Gg
CO2 / year). 1990-2023 Emissions have changed by -11.4% (-228.32 Gg CO2 / year). For 2023
the changes per gas
are:
- 4: Total sectoral emissions in 2022 are 3586.34 Gg
CO2 / year which is 6.4% of M.0.EL emissions. 2023 Emissions have
changed by -30.4% (-1613.20 Gg CO2 /
year). 1990-2023 Emissions have changed by -37.0% (-1336.60 Gg CO2 / year). For 2023
the changes per gas
are:

For 1990-2023 the changes per gas are:
- 5: Total sectoral emissions in 2022 are 359.69 Gg
CO2 / year which is 0.6% of M.0.EL emissions. 2023 Emissions have
changed by -7.1% (-26.48 Gg CO2 /
year). 1990-2023 Emissions have changed by -1.7% (-6.08 Gg CO2 / year). For 2023 the
changes per gas
are:

third party scenario (HISTTP):
Most important changes per time frame
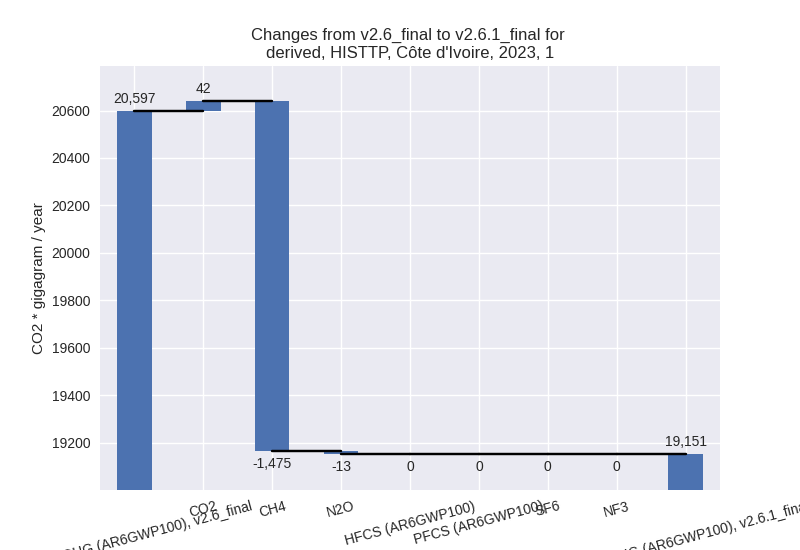
For 2023 the following sector-gas combinations have the highest absolute impact on national total KyotoGHG (AR6GWP100) emissions in 2023 (top 5):
- 1: 4, CH4 with -2479.23 Gg CO2 / year (-49.5%)
- 2: 1.B.2, CH4 with -1028.35 Gg CO2 / year (-71.3%)
- 3: 1.B.1, CH4 with -318.65 Gg CO2 / year (-7.5%)
- 4: M.AG.ELV, CH4 with 243.31 Gg CO2 / year (24.4%)
- 5: 3.A, CH4 with -171.67 Gg CO2 / year (-5.9%)
For 1990-2023 the following sector-gas combinations have the highest absolute impact on national total KyotoGHG (AR6GWP100) emissions in 1990-2023 (top 5):
- 1: 4, CH4 with -1658.60 Gg CO2 / year (-48.5%)
- 2: 1.B.2, CH4 with -545.45 Gg CO2 / year (-53.8%)
- 3: 1.B.1, CH4 with -57.93 Gg CO2 / year (-2.1%)
- 4: 1.A, CH4 with -17.54 Gg CO2 / year (-1.5%)
- 5: 3.A, CH4 with -9.00 Gg CO2 / year (-0.5%)
Changes in the main sectors for aggregate KyotoGHG (AR6GWP100) are
- 1: Total sectoral emissions in 2022 are 19557.44 Gg
CO2 / year which is 60.1% of M.0.EL emissions. 2023 Emissions have
changed by -7.0% (-1446.05 Gg CO2 /
year). 1990-2023 Emissions have changed by -4.7% (-624.29 Gg CO2 / year). For 2023
the changes per gas
are:
For 1990-2023 the changes per gas are:
The changes come from the following subsectors:- 1.A: Total sectoral emissions in 2022 are 15078.98 Gg CO2 / year which is 77.1% of category 1 emissions. 2023 Emissions have changed by -0.9% (-136.79 Gg CO2 / year). 1990-2023 Emissions have changed by -0.2% (-18.39 Gg CO2 / year).
- 1.B.1: Total sectoral emissions in 2022 are 3992.43
Gg CO2 / year which is 20.4% of category 1 emissions. 2023 Emissions
have changed by -7.5% (-322.88 Gg
CO2 / year). 1990-2023 Emissions have changed by -2.1% (-58.70 Gg CO2 / year). For 2023 the
changes per gas
are:

For 1990-2023 the changes per gas are: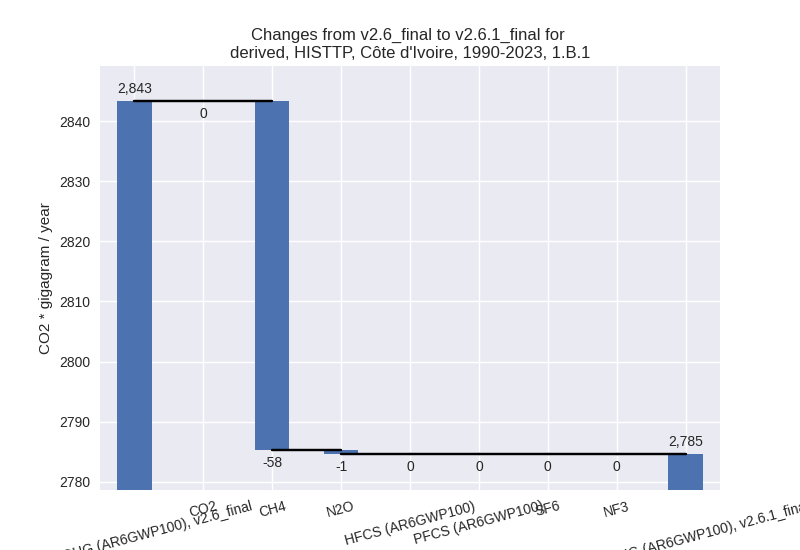
There is no subsector information available in PRIMAP-hist. - 1.B.2: Total sectoral emissions in 2022 are 486.02
Gg CO2 / year which is 2.5% of category 1 emissions. 2023 Emissions have
changed by -67.2% (-986.38 Gg CO2 /
year). 1990-2023 Emissions have changed by -47.8% (-547.20 Gg CO2 / year). For 2023
the changes per gas
are:
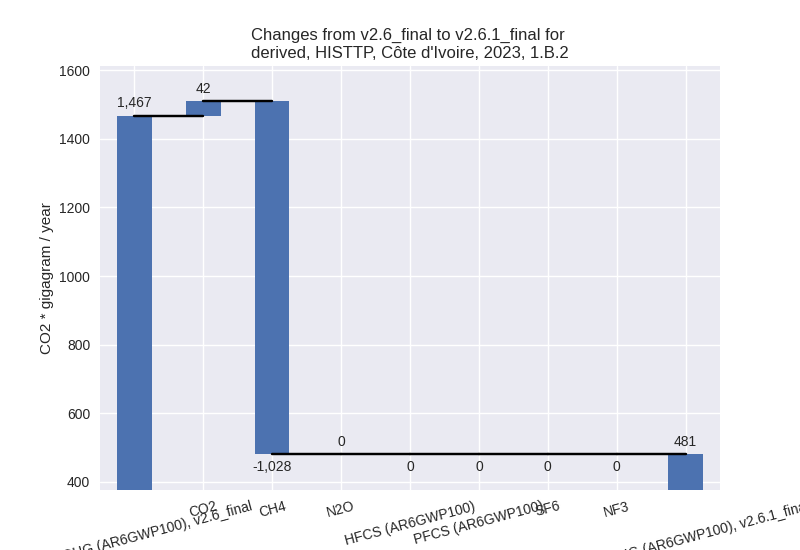
For 1990-2023 the changes per gas are:
There is no subsector information available in PRIMAP-hist.
- 2: Total sectoral emissions in 2022 are 2955.52 Gg CO2 / year which is 9.1% of M.0.EL emissions. 2023 Emissions have changed by -1.0% (-32.71 Gg CO2 / year). 1990-2023 Emissions have changed by -0.2% (-1.99 Gg CO2 / year).
- M.AG: Total sectoral emissions in 2022 are 6895.92 Gg CO2 / year which is 21.2% of M.0.EL emissions. 2023 Emissions have changed by 1.5% (103.54 Gg CO2 / year). 1990-2023 Emissions have changed by -0.1% (-4.04 Gg CO2 / year).
- 4: Total sectoral emissions in 2022 are 2760.39 Gg
CO2 / year which is 8.5% of M.0.EL emissions. 2023 Emissions have
changed by -46.4% (-2465.03 Gg CO2 /
year). 1990-2023 Emissions have changed by -45.8% (-1653.13 Gg CO2 / year). For 2023
the changes per gas
are:

For 1990-2023 the changes per gas are:
- 5: Total sectoral emissions in 2022 are 359.69 Gg
CO2 / year which is 1.1% of M.0.EL emissions. 2023 Emissions have
changed by -7.1% (-26.48 Gg CO2 /
year). 1990-2023 Emissions have changed by -1.7% (-6.08 Gg CO2 / year). For 2023 the
changes per gas
are: