Changes in PRIMAP-hist v2.6.1_final compared to v2.6_final for Congo
2025-03-19
Johannes Gütschow
Change analysis for Congo for PRIMAP-hist v2.6.1_final compared to v2.6_final
Overview over emissions by sector and gas
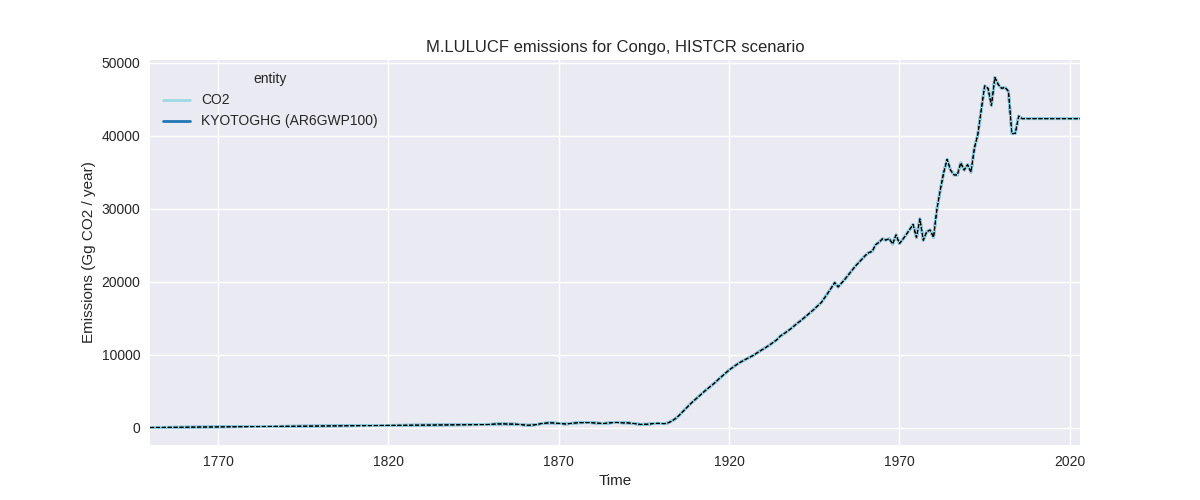
The following figures show the aggregate national total emissions excluding LULUCF AR6GWP100 for the country reported priority scenario. The dotted linesshow the v2.6_final data.


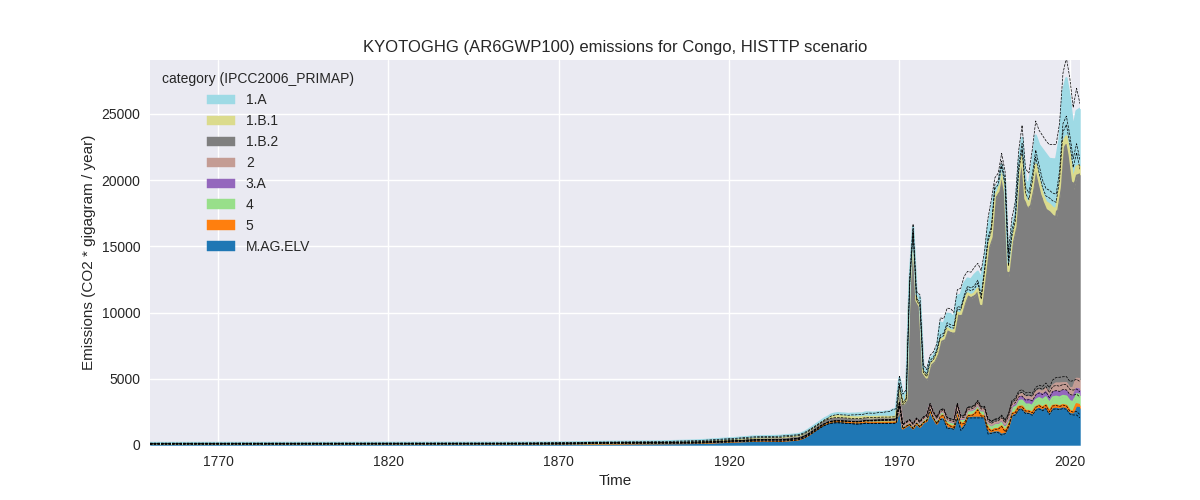
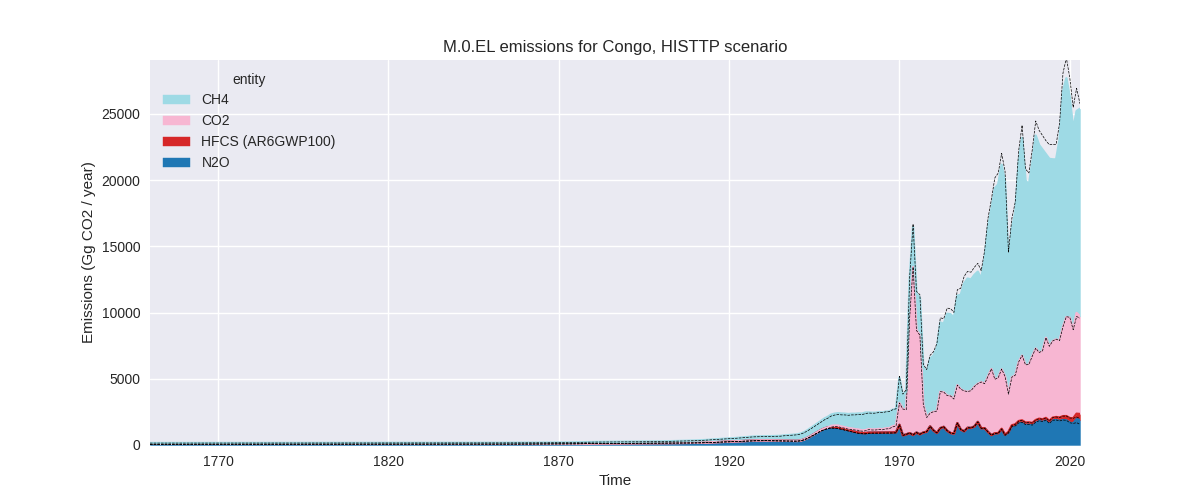
The following figures show the aggregate national total emissions excluding LULUCF AR6GWP100 for the third party priority scenario. The dotted linesshow the v2.6_final data.
Overview over changes
In the country reported priority scenario we have the following changes for aggregate Kyoto GHG and national total emissions excluding LULUCF (M.0.EL):
- Emissions in 2023 have changed by -1.5%% (-377.76 Gg CO2 / year)
- Emissions in 1990-2023 have changed by -4.6%% (-958.16 Gg CO2 / year)
In the third party priority scenario we have the following changes for aggregate Kyoto GHG and national total emissions excluding LULUCF (M.0.EL):
- Emissions in 2023 have changed by -1.5%% (-377.76 Gg CO2 / year)
- Emissions in 1990-2023 have changed by -4.6%% (-958.16 Gg CO2 / year)
Most important changes per scenario and time frame
In the country reported priority scenario the following sector-gas combinations have the highest absolute impact on national total KyotoGHG (AR6GWP100) emissions in 2023 (top 5):
- 1: 4, CH4 with -556.49 Gg CO2 / year (-43.6%)
- 2: M.AG.ELV, CH4 with 387.23 Gg CO2 / year (43.3%)
- 3: 1.B.2, CH4 with -356.22 Gg CO2 / year (-2.9%)
- 4: M.AG.ELV, N2O with 355.32 Gg CO2 / year (30.9%)
- 5: 1.B.2, CO2 with -226.47 Gg CO2 / year (-6.4%)
In the country reported priority scenario the following sector-gas combinations have the highest absolute impact on national total KyotoGHG (AR6GWP100) emissions in 1990-2023 (top 5):
- 1: 1.B.2, CH4 with -615.09 Gg CO2 / year (-5.3%)
- 2: 4, CH4 with -359.89 Gg CO2 / year (-43.9%)
- 3: 1.B.2, CO2 with -27.98 Gg CO2 / year (-1.0%)
- 4: M.AG.ELV, CH4 with 20.08 Gg CO2 / year (2.1%)
- 5: M.AG.ELV, N2O with 18.67 Gg CO2 / year (1.7%)
In the third party priority scenario the following sector-gas combinations have the highest absolute impact on national total KyotoGHG (AR6GWP100) emissions in 2023 (top 5):
- 1: 4, CH4 with -556.49 Gg CO2 / year (-43.6%)
- 2: M.AG.ELV, CH4 with 387.23 Gg CO2 / year (43.3%)
- 3: 1.B.2, CH4 with -356.22 Gg CO2 / year (-2.9%)
- 4: M.AG.ELV, N2O with 355.32 Gg CO2 / year (30.9%)
- 5: 1.B.2, CO2 with -226.47 Gg CO2 / year (-6.4%)
In the third party priority scenario the following sector-gas combinations have the highest absolute impact on national total KyotoGHG (AR6GWP100) emissions in 1990-2023 (top 5):
- 1: 1.B.2, CH4 with -615.09 Gg CO2 / year (-5.3%)
- 2: 4, CH4 with -359.89 Gg CO2 / year (-43.9%)
- 3: 1.B.2, CO2 with -27.98 Gg CO2 / year (-1.0%)
- 4: M.AG.ELV, CH4 with 20.08 Gg CO2 / year (2.1%)
- 5: M.AG.ELV, N2O with 18.67 Gg CO2 / year (1.7%)
Notes on data changes
Here we list notes explaining important emissions changes for the country.
- There is no usable country reported data for Cameroon, thus the CR and TP time-series are identical.
- The main change is for waste CH4 and due to updated EDGAR data.
- CH4 and N2O in M.AG.ELV are higher in 2023 because of an emission increase in 2022 in the new FAO data.
- Lower fugitive emissions are due to updated EDGAR emissions.
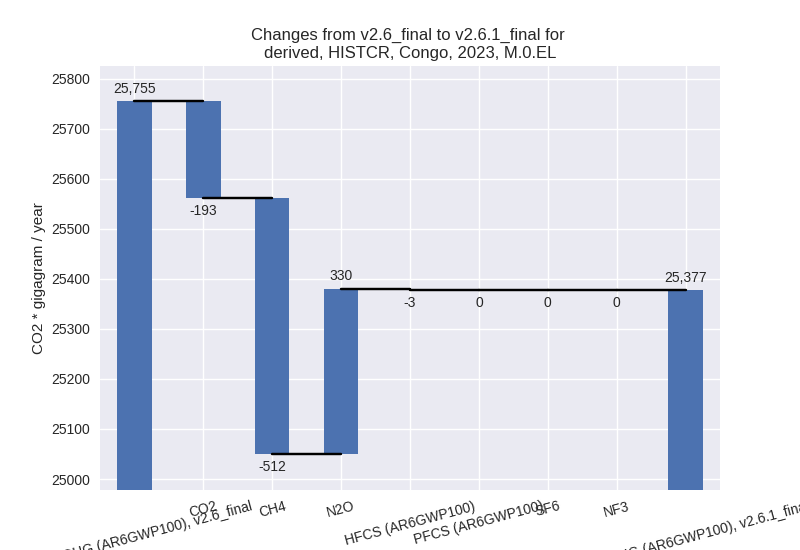
Changes by sector and gas
For each scenario and time frame the changes are displayed for all individual sectors and all individual gases. In the sector plot we use aggregate Kyoto GHGs in AR6GWP100. In the gas plot we usenational total emissions without LULUCF.
country reported scenario
2023

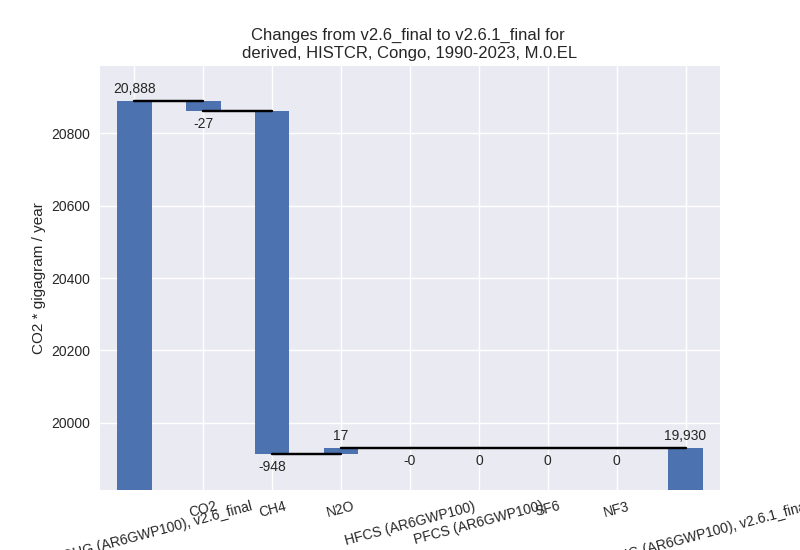
1990-2023

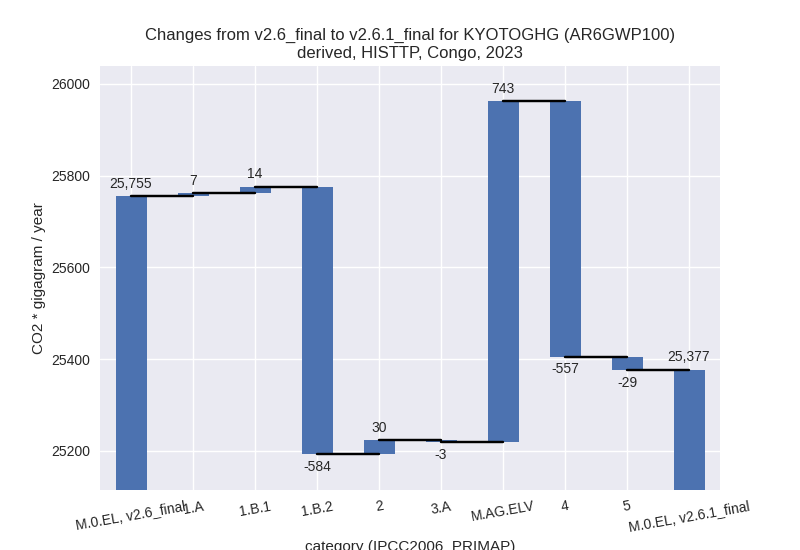
third party scenario
2023

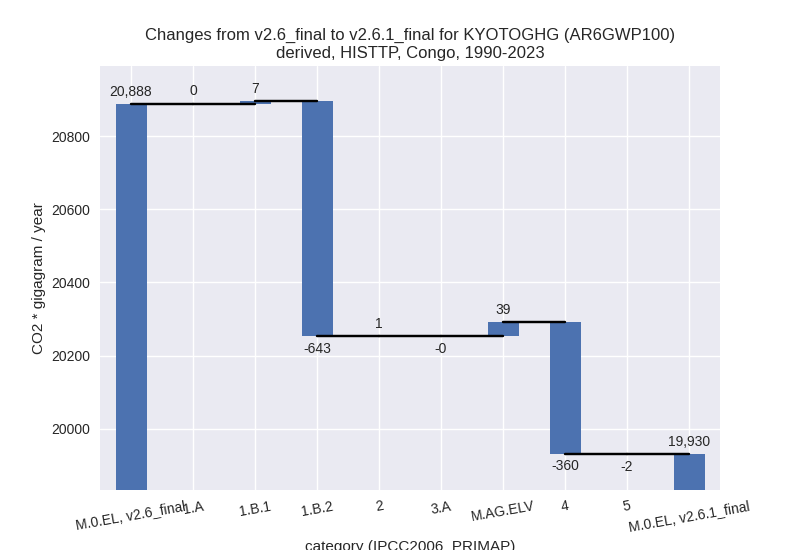
1990-2023

Detailed changes for the scenarios:
country reported scenario (HISTCR):
Most important changes per time frame
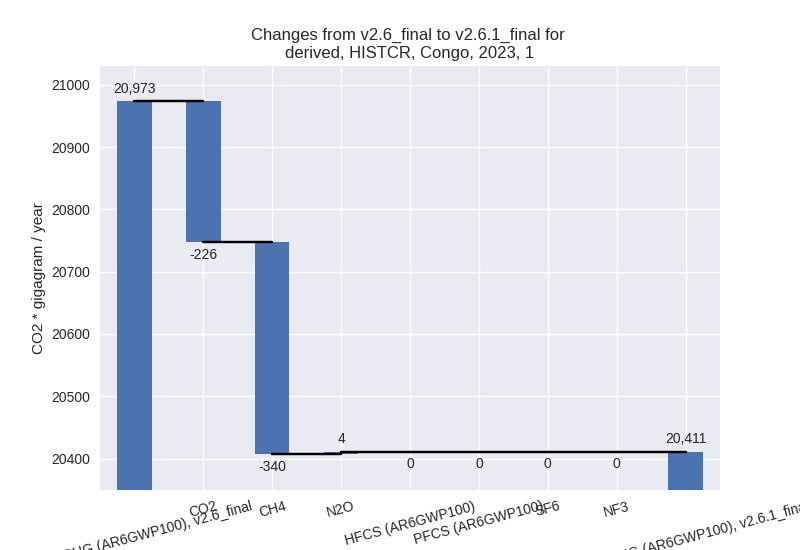
For 2023 the following sector-gas combinations have the highest absolute impact on national total KyotoGHG (AR6GWP100) emissions in 2023 (top 5):
- 1: 4, CH4 with -556.49 Gg CO2 / year (-43.6%)
- 2: M.AG.ELV, CH4 with 387.23 Gg CO2 / year (43.3%)
- 3: 1.B.2, CH4 with -356.22 Gg CO2 / year (-2.9%)
- 4: M.AG.ELV, N2O with 355.32 Gg CO2 / year (30.9%)
- 5: 1.B.2, CO2 with -226.47 Gg CO2 / year (-6.4%)
For 1990-2023 the following sector-gas combinations have the highest absolute impact on national total KyotoGHG (AR6GWP100) emissions in 1990-2023 (top 5):
- 1: 1.B.2, CH4 with -615.09 Gg CO2 / year (-5.3%)
- 2: 4, CH4 with -359.89 Gg CO2 / year (-43.9%)
- 3: 1.B.2, CO2 with -27.98 Gg CO2 / year (-1.0%)
- 4: M.AG.ELV, CH4 with 20.08 Gg CO2 / year (2.1%)
- 5: M.AG.ELV, N2O with 18.67 Gg CO2 / year (1.7%)
Changes in the main sectors for aggregate KyotoGHG (AR6GWP100) are
- 1: Total sectoral emissions in 2022 are 20213.80 Gg
CO2 / year which is 80.2% of M.0.EL emissions. 2023 Emissions have
changed by -2.7% (-562.16 Gg CO2 /
year). 1990-2023 Emissions have changed by -3.7% (-635.86 Gg CO2 / year). For 2023
the changes per gas
are:
For 1990-2023 the changes per gas are: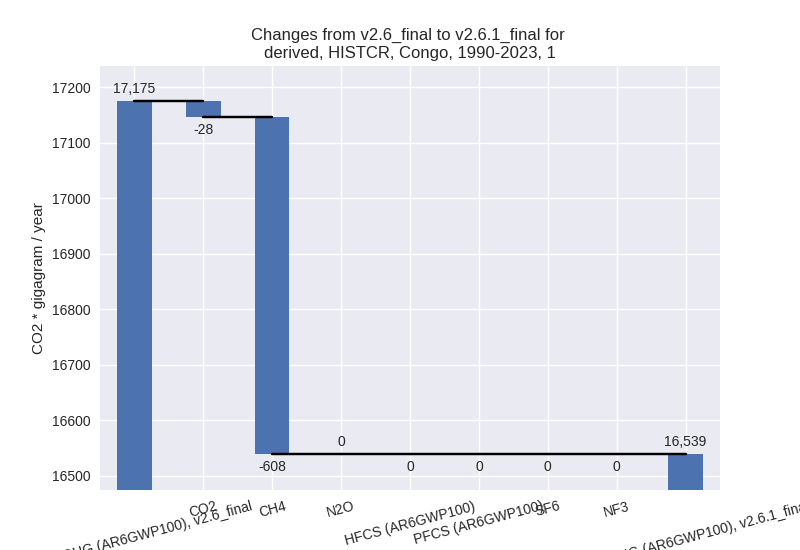
The changes come from the following subsectors:- 1.A: Total sectoral emissions in 2022 are 4192.85 Gg CO2 / year which is 20.7% of category 1 emissions. 2023 Emissions have changed by 0.2% (7.46 Gg CO2 / year). 1990-2023 Emissions have changed by 0.0% (0.19 Gg CO2 / year).
- 1.B.1: Total sectoral emissions in 2022 are 700.36
Gg CO2 / year which is 3.5% of category 1 emissions. 2023 Emissions have
changed by 2.0% (13.92 Gg CO2 /
year). 1990-2023 Emissions have changed by 1.6% (7.15 Gg CO2 / year). For 2023 the
changes per gas
are:

There is no subsector information available in PRIMAP-hist. - 1.B.2: Total sectoral emissions in 2022 are
15320.59 Gg CO2 / year which is 75.8% of category 1 emissions. 2023
Emissions have changed by -3.6%
(-583.54 Gg CO2 / year). 1990-2023 Emissions have changed by -4.4% (-643.20 Gg CO2 / year). For 2023
the changes per gas
are:

For 1990-2023 the changes per gas are: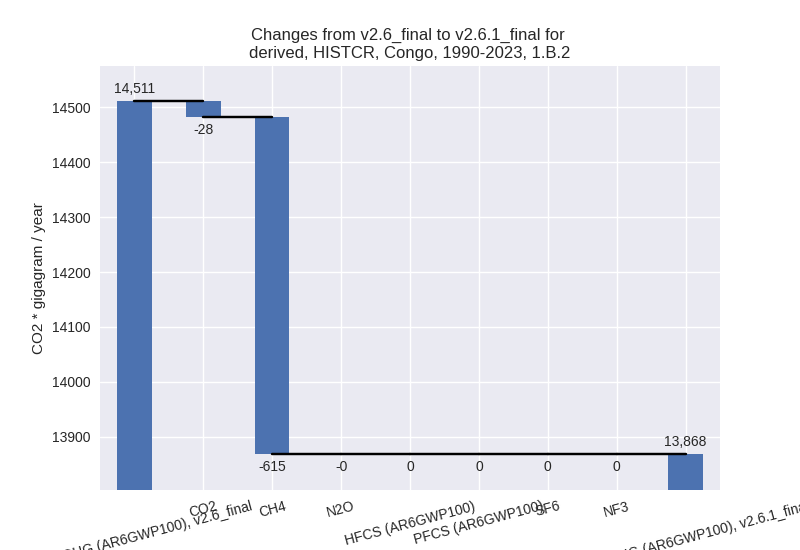
There is no subsector information available in PRIMAP-hist.
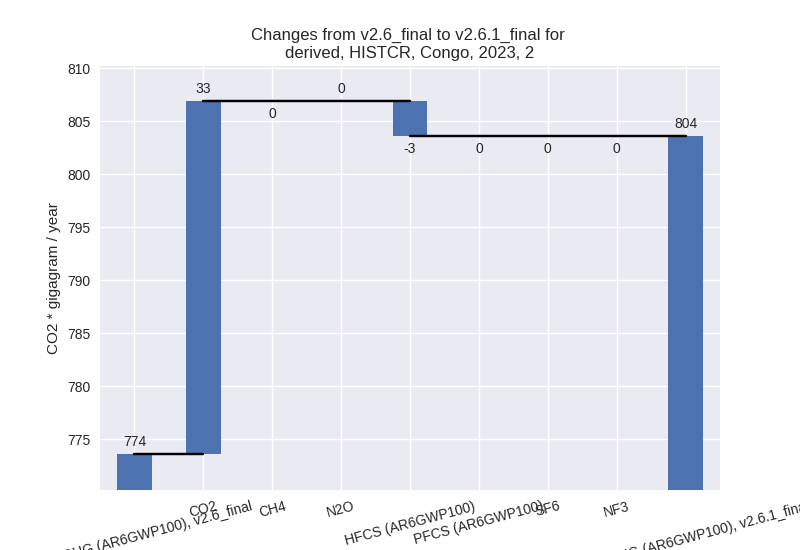
- 2: Total sectoral emissions in 2022 are 772.04 Gg
CO2 / year which is 3.1% of M.0.EL emissions. 2023 Emissions have
changed by 3.9% (30.01 Gg CO2 /
year). 1990-2023 Emissions have changed by 0.4% (0.95 Gg CO2 / year). For 2023 the
changes per gas
are:
- M.AG: Total sectoral emissions in 2022 are 3192.50
Gg CO2 / year which is 12.7% of M.0.EL emissions. 2023 Emissions have
changed by 30.4% (739.64 Gg CO2 /
year). 1990-2023 Emissions have changed by 1.6% (38.49 Gg CO2 / year). For 2023 the
changes per gas
are:

The changes come from the following subsectors:- 3.A: Total sectoral emissions in 2022 are 388.21 Gg CO2 / year which is 12.2% of category M.AG emissions. 2023 Emissions have changed by -0.7% (-2.91 Gg CO2 / year). 1990-2023 Emissions have changed by -0.1% (-0.26 Gg CO2 / year).
- M.AG.ELV: Total sectoral emissions in 2022 are
2804.29 Gg CO2 / year which is 87.8% of category M.AG emissions. 2023
Emissions have changed by 36.3%
(742.54 Gg CO2 / year). 1990-2023 Emissions have changed by 1.9% (38.75 Gg CO2 / year). For 2023 the
changes per gas
are:

There is no subsector information available in PRIMAP-hist.
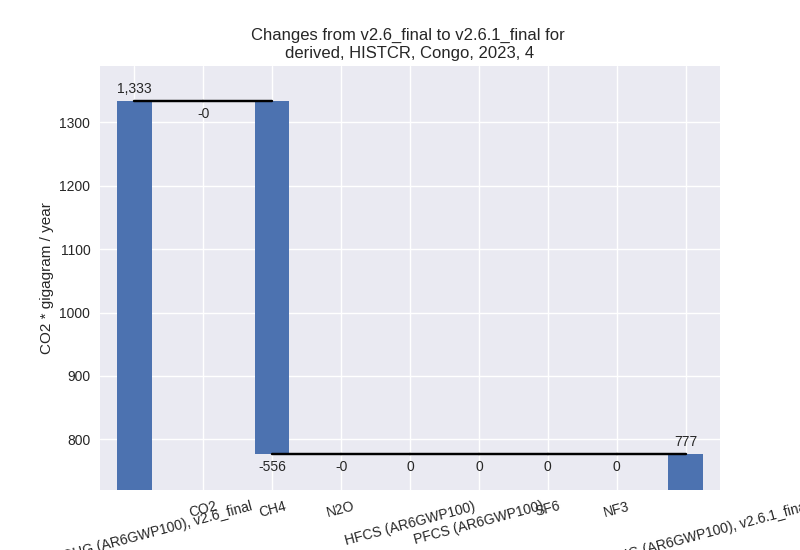
- 4: Total sectoral emissions in 2022 are 758.41 Gg
CO2 / year which is 3.0% of M.0.EL emissions. 2023 Emissions have
changed by -41.8% (-556.60 Gg CO2 /
year). 1990-2023 Emissions have changed by -42.2% (-359.93 Gg CO2 / year). For 2023
the changes per gas
are:
For 1990-2023 the changes per gas are:
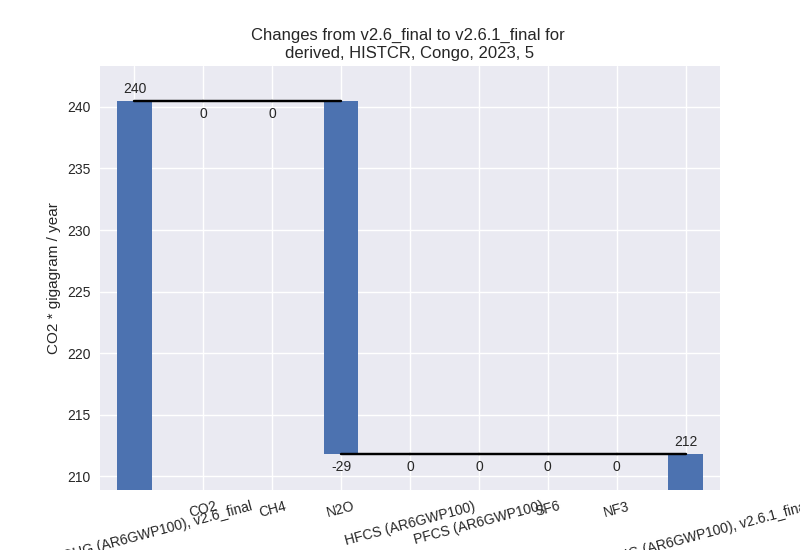
- 5: Total sectoral emissions in 2022 are 267.36 Gg
CO2 / year which is 1.1% of M.0.EL emissions. 2023 Emissions have
changed by -11.9% (-28.65 Gg CO2 /
year). 1990-2023 Emissions have changed by -0.7% (-1.81 Gg CO2 / year). For 2023 the
changes per gas
are:
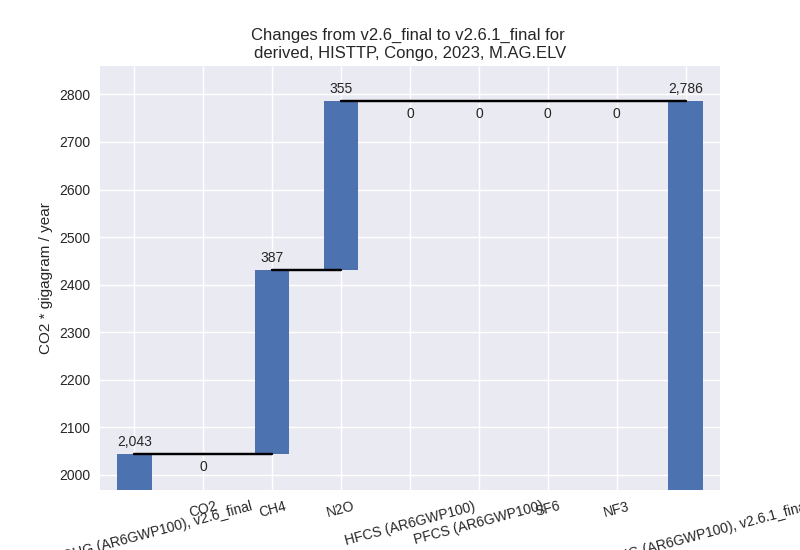
third party scenario (HISTTP):
Most important changes per time frame
For 2023 the following sector-gas combinations have the highest absolute impact on national total KyotoGHG (AR6GWP100) emissions in 2023 (top 5):
- 1: 4, CH4 with -556.49 Gg CO2 / year (-43.6%)
- 2: M.AG.ELV, CH4 with 387.23 Gg CO2 / year (43.3%)
- 3: 1.B.2, CH4 with -356.22 Gg CO2 / year (-2.9%)
- 4: M.AG.ELV, N2O with 355.32 Gg CO2 / year (30.9%)
- 5: 1.B.2, CO2 with -226.47 Gg CO2 / year (-6.4%)
For 1990-2023 the following sector-gas combinations have the highest absolute impact on national total KyotoGHG (AR6GWP100) emissions in 1990-2023 (top 5):
- 1: 1.B.2, CH4 with -615.09 Gg CO2 / year (-5.3%)
- 2: 4, CH4 with -359.89 Gg CO2 / year (-43.9%)
- 3: 1.B.2, CO2 with -27.98 Gg CO2 / year (-1.0%)
- 4: M.AG.ELV, CH4 with 20.08 Gg CO2 / year (2.1%)
- 5: M.AG.ELV, N2O with 18.67 Gg CO2 / year (1.7%)
Changes in the main sectors for aggregate KyotoGHG (AR6GWP100) are
- 1: Total sectoral emissions in 2022 are 20213.80 Gg
CO2 / year which is 80.2% of M.0.EL emissions. 2023 Emissions have
changed by -2.7% (-562.16 Gg CO2 /
year). 1990-2023 Emissions have changed by -3.7% (-635.86 Gg CO2 / year). For 2023
the changes per gas
are:

For 1990-2023 the changes per gas are:
The changes come from the following subsectors:- 1.A: Total sectoral emissions in 2022 are 4192.85 Gg CO2 / year which is 20.7% of category 1 emissions. 2023 Emissions have changed by 0.2% (7.46 Gg CO2 / year). 1990-2023 Emissions have changed by 0.0% (0.19 Gg CO2 / year).
- 1.B.1: Total sectoral emissions in 2022 are 700.36
Gg CO2 / year which is 3.5% of category 1 emissions. 2023 Emissions have
changed by 2.0% (13.92 Gg CO2 /
year). 1990-2023 Emissions have changed by 1.6% (7.15 Gg CO2 / year). For 2023 the
changes per gas
are:
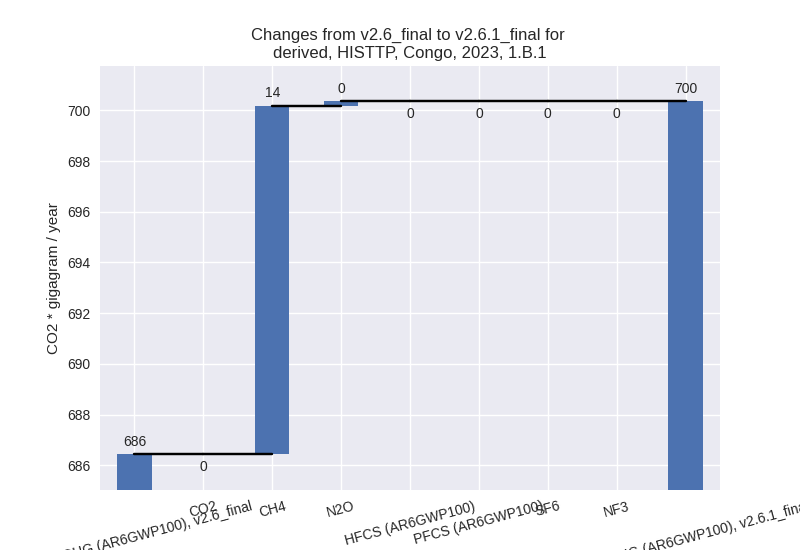
There is no subsector information available in PRIMAP-hist. - 1.B.2: Total sectoral emissions in 2022 are
15320.59 Gg CO2 / year which is 75.8% of category 1 emissions. 2023
Emissions have changed by -3.6%
(-583.54 Gg CO2 / year). 1990-2023 Emissions have changed by -4.4% (-643.20 Gg CO2 / year). For 2023
the changes per gas
are:

For 1990-2023 the changes per gas are:
There is no subsector information available in PRIMAP-hist.
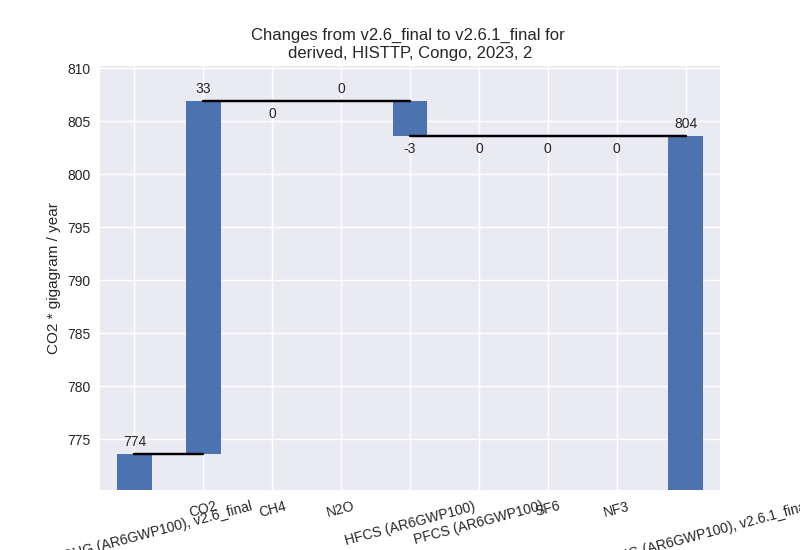
- 2: Total sectoral emissions in 2022 are 772.04 Gg
CO2 / year which is 3.1% of M.0.EL emissions. 2023 Emissions have
changed by 3.9% (30.01 Gg CO2 /
year). 1990-2023 Emissions have changed by 0.4% (0.95 Gg CO2 / year). For 2023 the
changes per gas
are:
- M.AG: Total sectoral emissions in 2022 are 3192.50
Gg CO2 / year which is 12.7% of M.0.EL emissions. 2023 Emissions have
changed by 30.4% (739.64 Gg CO2 /
year). 1990-2023 Emissions have changed by 1.6% (38.49 Gg CO2 / year). For 2023 the
changes per gas
are:

The changes come from the following subsectors:- 3.A: Total sectoral emissions in 2022 are 388.21 Gg CO2 / year which is 12.2% of category M.AG emissions. 2023 Emissions have changed by -0.7% (-2.91 Gg CO2 / year). 1990-2023 Emissions have changed by -0.1% (-0.26 Gg CO2 / year).
- M.AG.ELV: Total sectoral emissions in 2022 are
2804.29 Gg CO2 / year which is 87.8% of category M.AG emissions. 2023
Emissions have changed by 36.3%
(742.54 Gg CO2 / year). 1990-2023 Emissions have changed by 1.9% (38.75 Gg CO2 / year). For 2023 the
changes per gas
are:
There is no subsector information available in PRIMAP-hist.
- 4: Total sectoral emissions in 2022 are 758.41 Gg
CO2 / year which is 3.0% of M.0.EL emissions. 2023 Emissions have
changed by -41.8% (-556.60 Gg CO2 /
year). 1990-2023 Emissions have changed by -42.2% (-359.93 Gg CO2 / year). For 2023
the changes per gas
are:

For 1990-2023 the changes per gas are:
- 5: Total sectoral emissions in 2022 are 267.36 Gg
CO2 / year which is 1.1% of M.0.EL emissions. 2023 Emissions have
changed by -11.9% (-28.65 Gg CO2 /
year). 1990-2023 Emissions have changed by -0.7% (-1.81 Gg CO2 / year). For 2023 the
changes per gas
are:
