Changes in PRIMAP-hist v2.6.1_final compared to v2.6_final for Comoros
2025-03-19
Johannes Gütschow
Change analysis for Comoros for PRIMAP-hist v2.6.1_final compared to v2.6_final
Overview over emissions by sector and gas
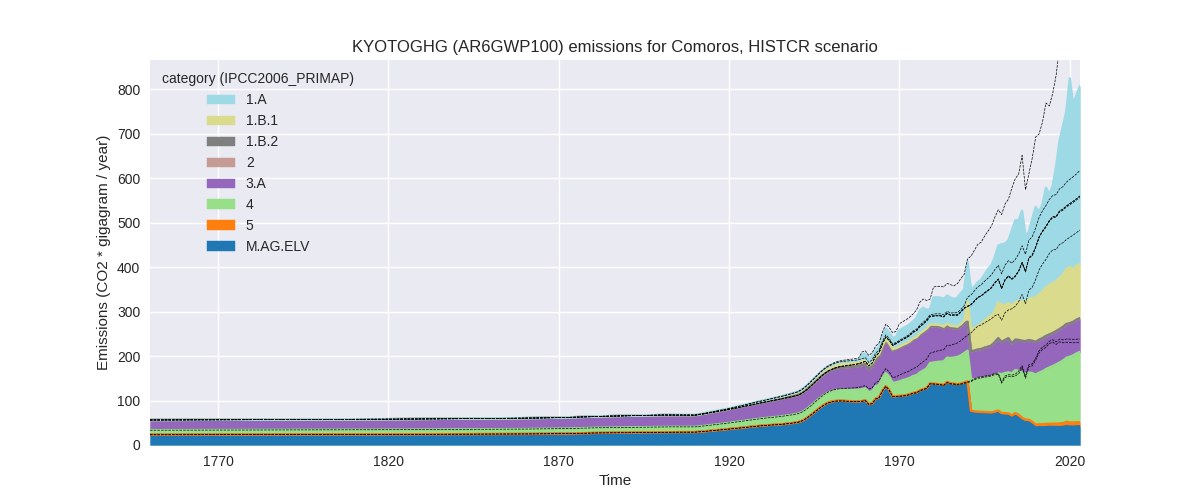
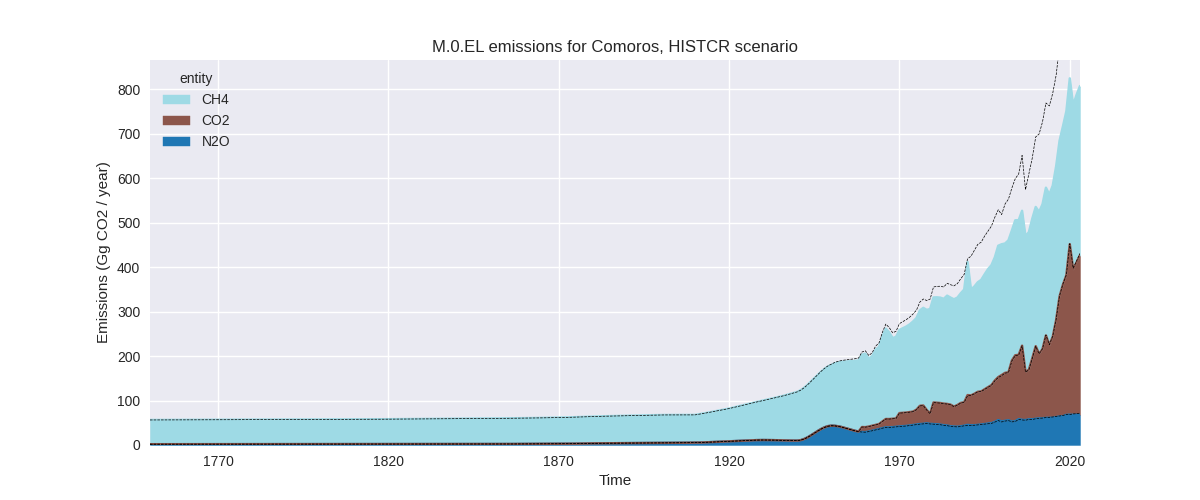
The following figures show the aggregate national total emissions excluding LULUCF AR6GWP100 for the country reported priority scenario. The dotted linesshow the v2.6_final data.
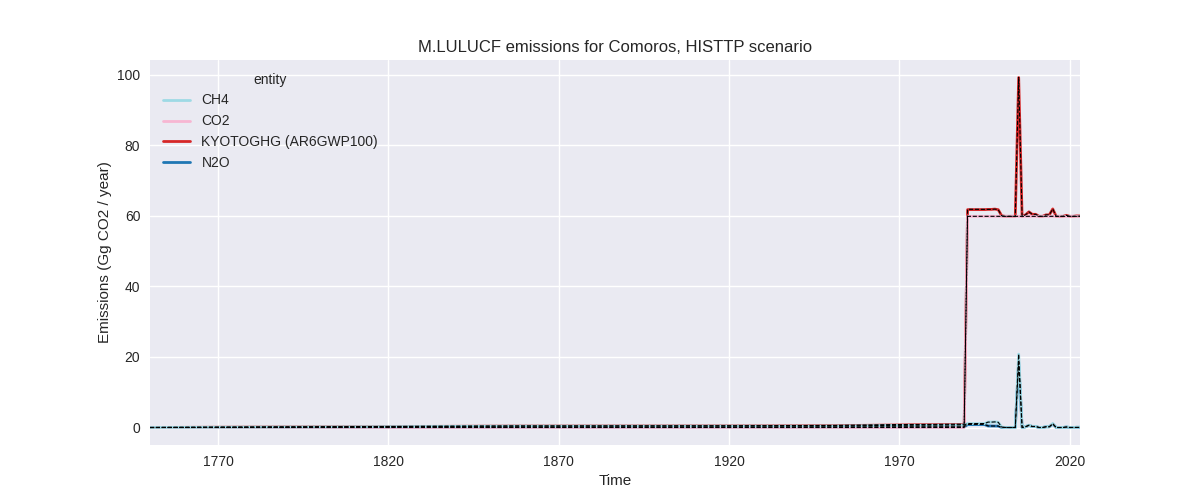
The following figures show the aggregate national total emissions excluding LULUCF AR6GWP100 for the third party priority scenario. The dotted linesshow the v2.6_final data.


Overview over changes
In the country reported priority scenario we have the following changes for aggregate Kyoto GHG and national total emissions excluding LULUCF (M.0.EL):
- Emissions in 2023 have changed by -22.6%% (-236.27 Gg CO2 / year)
- Emissions in 1990-2023 have changed by -20.6%% (-137.32 Gg CO2 / year)
In the third party priority scenario we have the following changes for aggregate Kyoto GHG and national total emissions excluding LULUCF (M.0.EL):
- Emissions in 2023 have changed by -22.6%% (-236.27 Gg CO2 / year)
- Emissions in 1990-2023 have changed by -20.6%% (-137.32 Gg CO2 / year)
Most important changes per scenario and time frame
In the country reported priority scenario the following sector-gas combinations have the highest absolute impact on national total KyotoGHG (AR6GWP100) emissions in 2023 (top 5):
- 1: M.AG.ELV, CH4 with -185.85 Gg CO2 / year (-99.3%)
- 2: 4, CH4 with -86.37 Gg CO2 / year (-36.5%)
- 3: 1.B.1, CH4 with 62.59 Gg CO2 / year (109.7%)
- 4: 1.A, CH4 with -22.82 Gg CO2 / year (-38.8%)
- 5: M.AG.ELV, N2O with -2.40 Gg CO2 / year (-5.6%)
In the country reported priority scenario the following sector-gas combinations have the highest absolute impact on national total KyotoGHG (AR6GWP100) emissions in 1990-2023 (top 5):
- 1: M.AG.ELV, CH4 with -123.94 Gg CO2 / year (-86.8%)
- 2: 4, CH4 with -60.09 Gg CO2 / year (-37.2%)
- 3: 1.B.1, CH4 with 50.42 Gg CO2 / year (131.7%)
- 4: 1.A, CH4 with -3.44 Gg CO2 / year (-10.0%)
- 5: M.AG.ELV, N2O with -2.26 Gg CO2 / year (-5.6%)
In the third party priority scenario the following sector-gas combinations have the highest absolute impact on national total KyotoGHG (AR6GWP100) emissions in 2023 (top 5):
- 1: M.AG.ELV, CH4 with -185.85 Gg CO2 / year (-99.3%)
- 2: 4, CH4 with -86.37 Gg CO2 / year (-36.5%)
- 3: 1.B.1, CH4 with 62.59 Gg CO2 / year (109.7%)
- 4: 1.A, CH4 with -22.82 Gg CO2 / year (-38.8%)
- 5: M.AG.ELV, N2O with -2.40 Gg CO2 / year (-5.6%)
In the third party priority scenario the following sector-gas combinations have the highest absolute impact on national total KyotoGHG (AR6GWP100) emissions in 1990-2023 (top 5):
- 1: M.AG.ELV, CH4 with -123.94 Gg CO2 / year (-86.8%)
- 2: 4, CH4 with -60.09 Gg CO2 / year (-37.2%)
- 3: 1.B.1, CH4 with 50.42 Gg CO2 / year (131.7%)
- 4: 1.A, CH4 with -3.44 Gg CO2 / year (-10.0%)
- 5: M.AG.ELV, N2O with -2.26 Gg CO2 / year (-5.6%)
Notes on data changes
Here we list notes explaining important emissions changes for the country.
- There is no usable country reported data for Cameroon, thus the CR and TP time-series are identical.
- The most important change are much (99% in 2023, 87% in cumulatively) lower CH4 emissions from M.AG.ELV due to a change in activity data underlying the FAOSTAT and EDGAR data (both datasets show a rapid drop in emissions from 1990 to 1991. 1990 data is consistent with previous releases)
- CH4 from waste is also much lower in the new EDGAR data.
- Fugitive CH4 in 1.B.1 is over 100% higher than in the previous EDGAR release
Changes by sector and gas
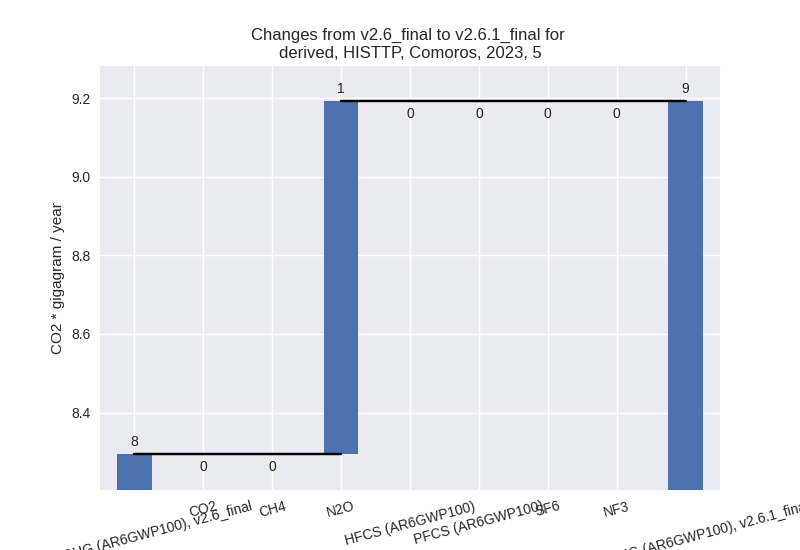
For each scenario and time frame the changes are displayed for all individual sectors and all individual gases. In the sector plot we use aggregate Kyoto GHGs in AR6GWP100. In the gas plot we usenational total emissions without LULUCF.
country reported scenario
2023

1990-2023


third party scenario
2023


1990-2023

Detailed changes for the scenarios:
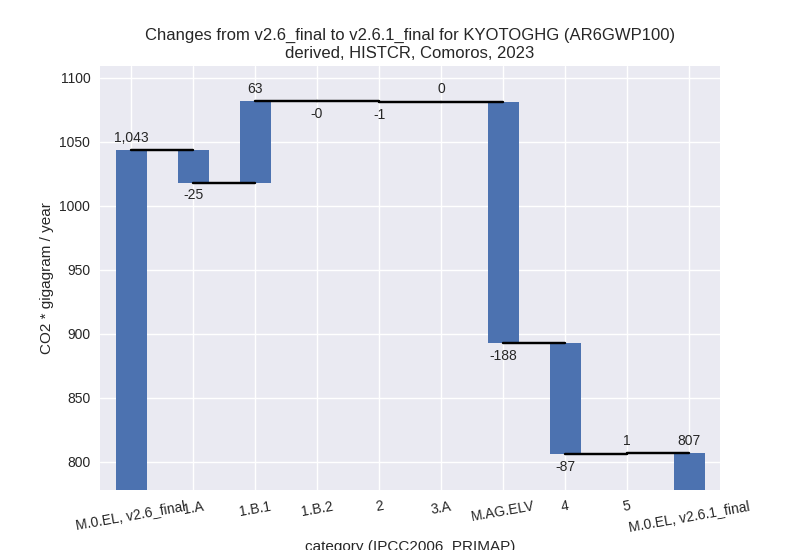
country reported scenario (HISTCR):
Most important changes per time frame
For 2023 the following sector-gas combinations have the highest absolute impact on national total KyotoGHG (AR6GWP100) emissions in 2023 (top 5):
- 1: M.AG.ELV, CH4 with -185.85 Gg CO2 / year (-99.3%)
- 2: 4, CH4 with -86.37 Gg CO2 / year (-36.5%)
- 3: 1.B.1, CH4 with 62.59 Gg CO2 / year (109.7%)
- 4: 1.A, CH4 with -22.82 Gg CO2 / year (-38.8%)
- 5: M.AG.ELV, N2O with -2.40 Gg CO2 / year (-5.6%)
For 1990-2023 the following sector-gas combinations have the highest absolute impact on national total KyotoGHG (AR6GWP100) emissions in 1990-2023 (top 5):
- 1: M.AG.ELV, CH4 with -123.94 Gg CO2 / year (-86.8%)
- 2: 4, CH4 with -60.09 Gg CO2 / year (-37.2%)
- 3: 1.B.1, CH4 with 50.42 Gg CO2 / year (131.7%)
- 4: 1.A, CH4 with -3.44 Gg CO2 / year (-10.0%)
- 5: M.AG.ELV, N2O with -2.26 Gg CO2 / year (-5.6%)
Changes in the main sectors for aggregate KyotoGHG (AR6GWP100) are
- 1: Total sectoral emissions in 2022 are 505.89 Gg
CO2 / year which is 64.2% of M.0.EL emissions. 2023 Emissions have
changed by 7.9% (38.26 Gg CO2 /
year). 1990-2023 Emissions have changed by 19.7% (47.52 Gg CO2 / year). For 2023 the
changes per gas
are:

For 1990-2023 the changes per gas are: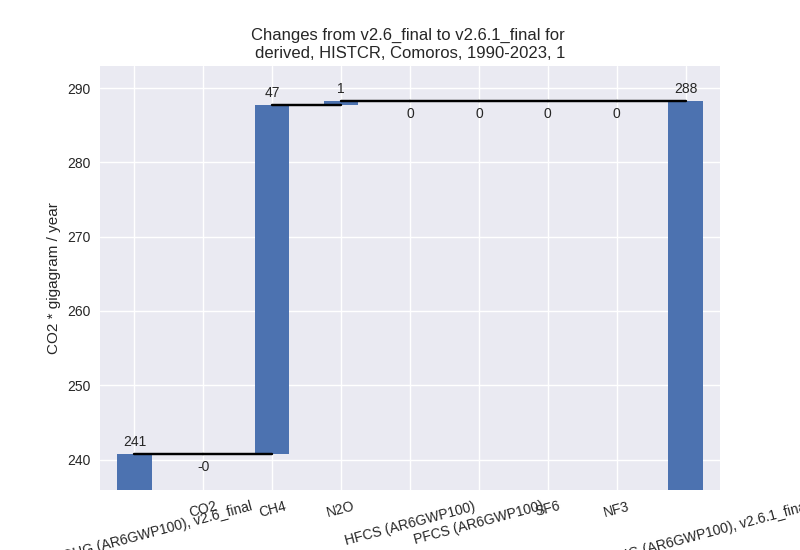
The changes come from the following subsectors:- 1.A: Total sectoral emissions in 2022 are 384.68 Gg
CO2 / year which is 76.0% of category 1 emissions. 2023 Emissions have
changed by -5.9% (-25.16 Gg CO2 /
year). 1990-2023 Emissions have changed by -1.8% (-3.57 Gg CO2 / year). For 2023 the
changes per gas
are:

There is no subsector information available in PRIMAP-hist. - 1.B.1: Total sectoral emissions in 2022 are 121.21
Gg CO2 / year which is 24.0% of category 1 emissions. 2023 Emissions
have changed by 109.7% (63.42 Gg CO2
/ year). 1990-2023 Emissions have changed by 131.7% (51.09 Gg CO2 / year). For 2023 the
changes per gas
are:
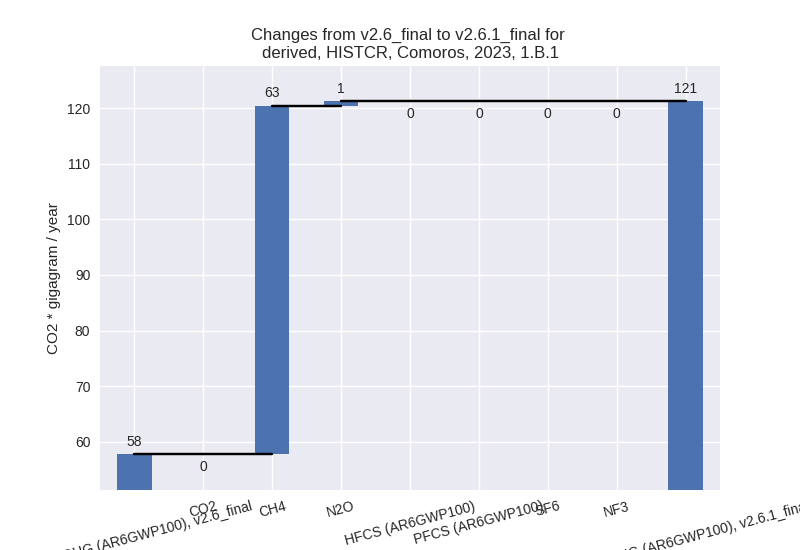
For 1990-2023 the changes per gas are:
There is no subsector information available in PRIMAP-hist. - 1.B.2: Total sectoral emissions in 2022 are 0.00 Gg
CO2 / year which is 0.0% of category 1 emissions. 2023 Emissions have
changed by -83.3% (-0.00 Gg CO2 /
year). 1990-2023 Emissions have changed by -79.8% (-0.00 Gg CO2 / year). For 2023 the
changes per gas
are:

For 1990-2023 the changes per gas are: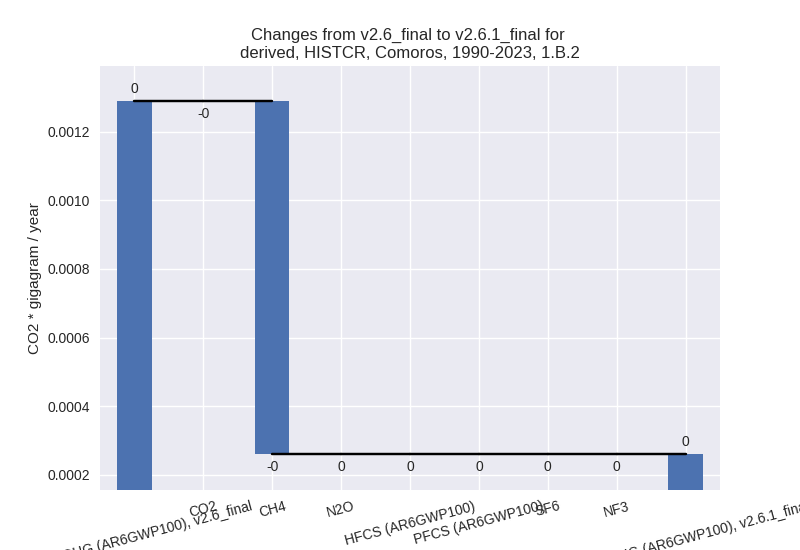
There is no subsector information available in PRIMAP-hist.
- 1.A: Total sectoral emissions in 2022 are 384.68 Gg
CO2 / year which is 76.0% of category 1 emissions. 2023 Emissions have
changed by -5.9% (-25.16 Gg CO2 /
year). 1990-2023 Emissions have changed by -1.8% (-3.57 Gg CO2 / year). For 2023 the
changes per gas
are:
- 2: Total sectoral emissions in 2022 are 2.20 Gg CO2
/ year which is 0.3% of M.0.EL emissions. 2023 Emissions have changed by
-22.4% (-0.66 Gg CO2 / year).
1990-2023 Emissions have changed by -4.0% (-0.07 Gg CO2 / year). For 2023 the
changes per gas
are:

For 1990-2023 the changes per gas are:
- M.AG: Total sectoral emissions in 2022 are 115.35
Gg CO2 / year which is 14.6% of M.0.EL emissions. 2023 Emissions have
changed by -62.0% (-187.97 Gg CO2 /
year). 1990-2023 Emissions have changed by -49.7% (-126.15 Gg CO2 / year). For 2023
the changes per gas
are:

For 1990-2023 the changes per gas are:
The changes come from the following subsectors:- 3.A: Total sectoral emissions in 2022 are 73.50 Gg CO2 / year which is 63.7% of category M.AG emissions. 2023 Emissions have changed by 0.4% (0.27 Gg CO2 / year). 1990-2023 Emissions have changed by 0.1% (0.04 Gg CO2 / year).
- M.AG.ELV: Total sectoral emissions in 2022 are
41.85 Gg CO2 / year which is 36.3% of category M.AG emissions. 2023
Emissions have changed by -81.8%
(-188.24 Gg CO2 / year). 1990-2023 Emissions have changed by -68.8% (-126.19 Gg CO2 / year). For 2023
the changes per gas
are:

For 1990-2023 the changes per gas are: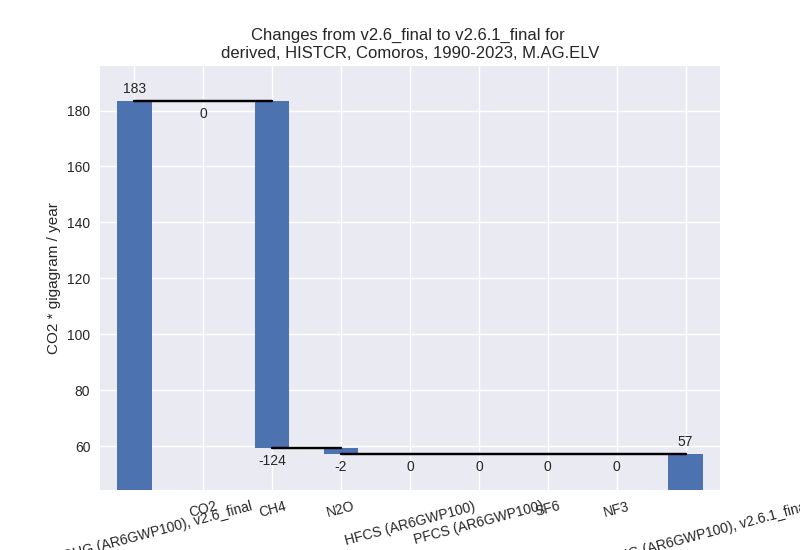
There is no subsector information available in PRIMAP-hist.
- 4: Total sectoral emissions in 2022 are 154.72 Gg
CO2 / year which is 19.6% of M.0.EL emissions. 2023 Emissions have
changed by -35.4% (-86.80 Gg CO2 /
year). 1990-2023 Emissions have changed by -36.0% (-60.20 Gg CO2 / year). For 2023
the changes per gas
are:

For 1990-2023 the changes per gas are:
- 5: Total sectoral emissions in 2022 are 9.24 Gg CO2
/ year which is 1.2% of M.0.EL emissions. 2023 Emissions have changed by
10.8% (0.90 Gg CO2 / year).
1990-2023 Emissions have changed by 35.7% (1.59 Gg CO2 / year). For 2023 the
changes per gas
are:

For 1990-2023 the changes per gas are: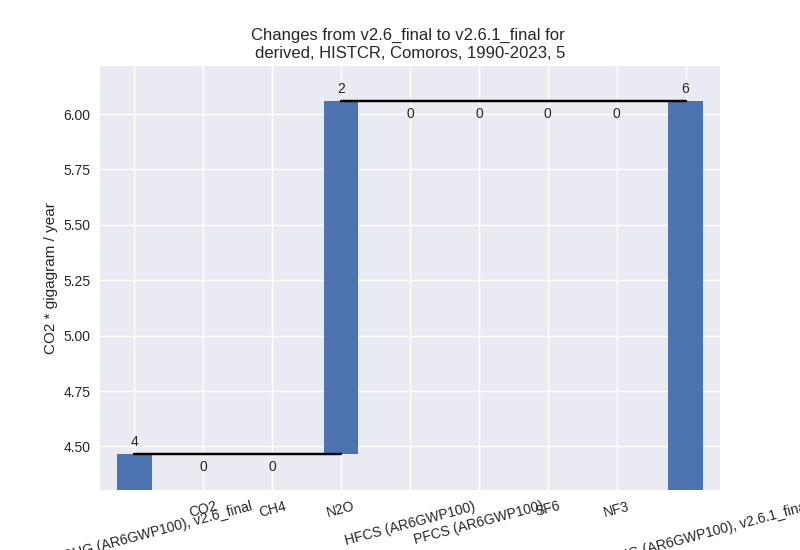
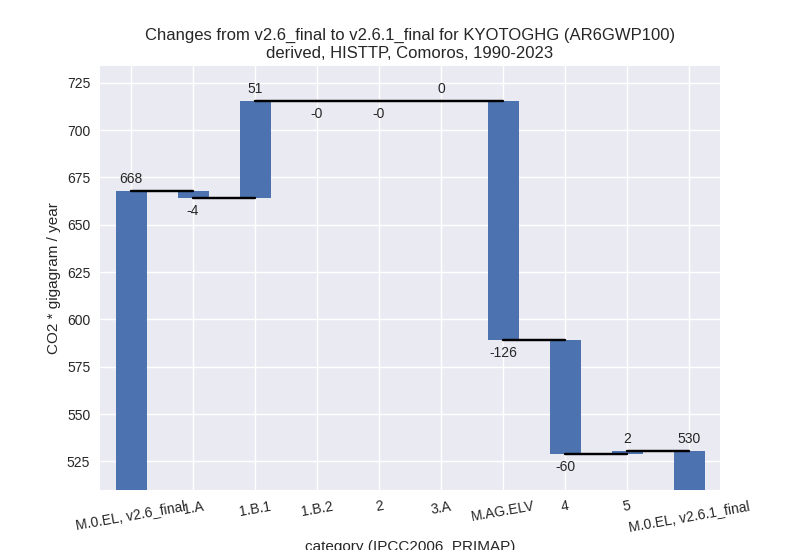
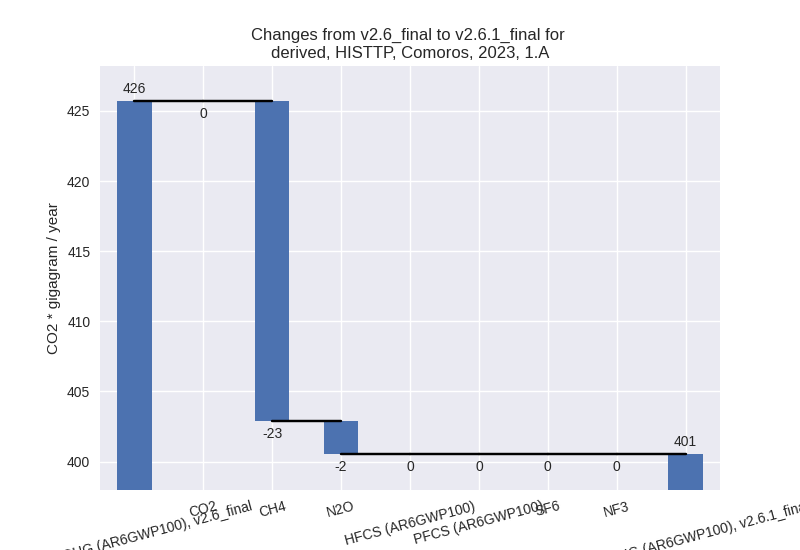
third party scenario (HISTTP):
Most important changes per time frame
For 2023 the following sector-gas combinations have the highest absolute impact on national total KyotoGHG (AR6GWP100) emissions in 2023 (top 5):
- 1: M.AG.ELV, CH4 with -185.85 Gg CO2 / year (-99.3%)
- 2: 4, CH4 with -86.37 Gg CO2 / year (-36.5%)
- 3: 1.B.1, CH4 with 62.59 Gg CO2 / year (109.7%)
- 4: 1.A, CH4 with -22.82 Gg CO2 / year (-38.8%)
- 5: M.AG.ELV, N2O with -2.40 Gg CO2 / year (-5.6%)
For 1990-2023 the following sector-gas combinations have the highest absolute impact on national total KyotoGHG (AR6GWP100) emissions in 1990-2023 (top 5):
- 1: M.AG.ELV, CH4 with -123.94 Gg CO2 / year (-86.8%)
- 2: 4, CH4 with -60.09 Gg CO2 / year (-37.2%)
- 3: 1.B.1, CH4 with 50.42 Gg CO2 / year (131.7%)
- 4: 1.A, CH4 with -3.44 Gg CO2 / year (-10.0%)
- 5: M.AG.ELV, N2O with -2.26 Gg CO2 / year (-5.6%)
Changes in the main sectors for aggregate KyotoGHG (AR6GWP100) are
- 1: Total sectoral emissions in 2022 are 505.89 Gg
CO2 / year which is 64.2% of M.0.EL emissions. 2023 Emissions have
changed by 7.9% (38.26 Gg CO2 /
year). 1990-2023 Emissions have changed by 19.7% (47.52 Gg CO2 / year). For 2023 the
changes per gas
are:
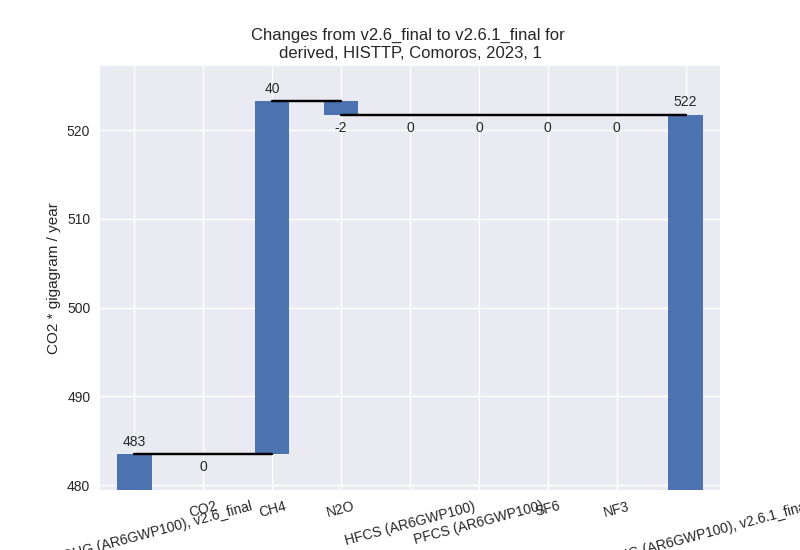
For 1990-2023 the changes per gas are:
The changes come from the following subsectors:- 1.A: Total sectoral emissions in 2022 are 384.68 Gg
CO2 / year which is 76.0% of category 1 emissions. 2023 Emissions have
changed by -5.9% (-25.16 Gg CO2 /
year). 1990-2023 Emissions have changed by -1.8% (-3.57 Gg CO2 / year). For 2023 the
changes per gas
are:
There is no subsector information available in PRIMAP-hist. - 1.B.1: Total sectoral emissions in 2022 are 121.21
Gg CO2 / year which is 24.0% of category 1 emissions. 2023 Emissions
have changed by 109.7% (63.42 Gg CO2
/ year). 1990-2023 Emissions have changed by 131.7% (51.09 Gg CO2 / year). For 2023 the
changes per gas
are:

For 1990-2023 the changes per gas are:
There is no subsector information available in PRIMAP-hist. - 1.B.2: Total sectoral emissions in 2022 are 0.00 Gg
CO2 / year which is 0.0% of category 1 emissions. 2023 Emissions have
changed by -83.3% (-0.00 Gg CO2 /
year). 1990-2023 Emissions have changed by -79.8% (-0.00 Gg CO2 / year). For 2023 the
changes per gas
are:

For 1990-2023 the changes per gas are: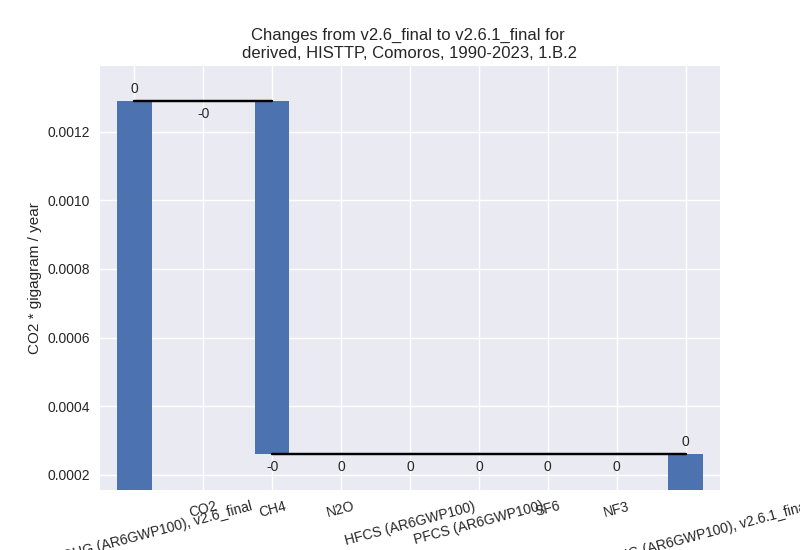
There is no subsector information available in PRIMAP-hist.
- 1.A: Total sectoral emissions in 2022 are 384.68 Gg
CO2 / year which is 76.0% of category 1 emissions. 2023 Emissions have
changed by -5.9% (-25.16 Gg CO2 /
year). 1990-2023 Emissions have changed by -1.8% (-3.57 Gg CO2 / year). For 2023 the
changes per gas
are:
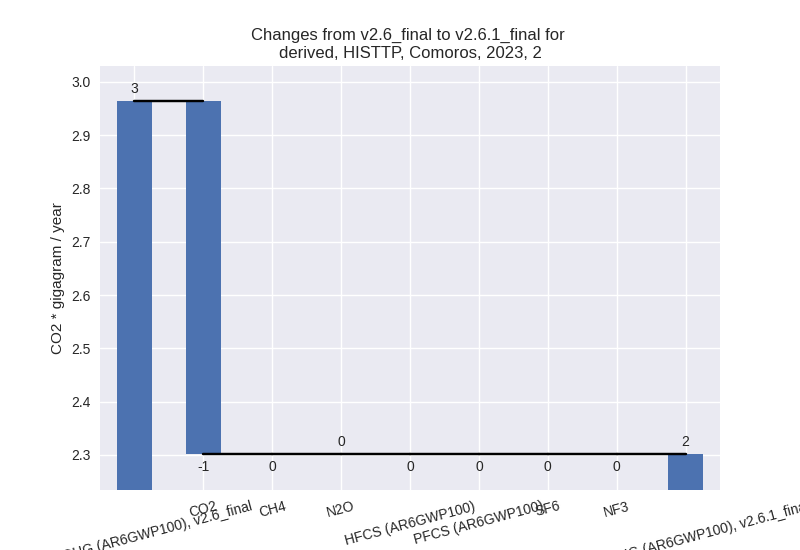
- 2: Total sectoral emissions in 2022 are 2.20 Gg CO2
/ year which is 0.3% of M.0.EL emissions. 2023 Emissions have changed by
-22.4% (-0.66 Gg CO2 / year).
1990-2023 Emissions have changed by -4.0% (-0.07 Gg CO2 / year). For 2023 the
changes per gas
are:
For 1990-2023 the changes per gas are: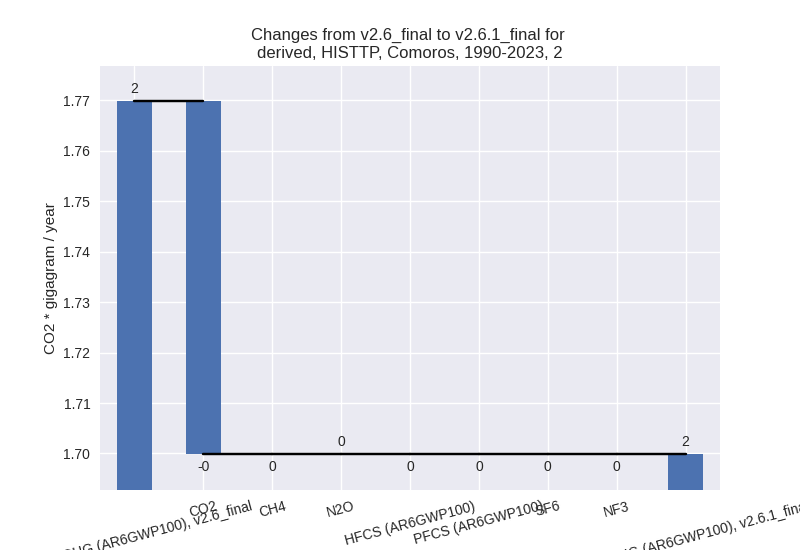
- M.AG: Total sectoral emissions in 2022 are 115.35
Gg CO2 / year which is 14.6% of M.0.EL emissions. 2023 Emissions have
changed by -62.0% (-187.97 Gg CO2 /
year). 1990-2023 Emissions have changed by -49.7% (-126.15 Gg CO2 / year). For 2023
the changes per gas
are:

For 1990-2023 the changes per gas are:
The changes come from the following subsectors:- 3.A: Total sectoral emissions in 2022 are 73.50 Gg CO2 / year which is 63.7% of category M.AG emissions. 2023 Emissions have changed by 0.4% (0.27 Gg CO2 / year). 1990-2023 Emissions have changed by 0.1% (0.04 Gg CO2 / year).
- M.AG.ELV: Total sectoral emissions in 2022 are
41.85 Gg CO2 / year which is 36.3% of category M.AG emissions. 2023
Emissions have changed by -81.8%
(-188.24 Gg CO2 / year). 1990-2023 Emissions have changed by -68.8% (-126.19 Gg CO2 / year). For 2023
the changes per gas
are:

For 1990-2023 the changes per gas are:
There is no subsector information available in PRIMAP-hist.
- 4: Total sectoral emissions in 2022 are 154.72 Gg
CO2 / year which is 19.6% of M.0.EL emissions. 2023 Emissions have
changed by -35.4% (-86.80 Gg CO2 /
year). 1990-2023 Emissions have changed by -36.0% (-60.20 Gg CO2 / year). For 2023
the changes per gas
are:

For 1990-2023 the changes per gas are:
- 5: Total sectoral emissions in 2022 are 9.24 Gg CO2
/ year which is 1.2% of M.0.EL emissions. 2023 Emissions have changed by
10.8% (0.90 Gg CO2 / year).
1990-2023 Emissions have changed by 35.7% (1.59 Gg CO2 / year). For 2023 the
changes per gas
are:
For 1990-2023 the changes per gas are: