Changes in PRIMAP-hist v2.6.1_final compared to v2.6_final for Cabo Verde
2025-03-19
Johannes Gütschow
Change analysis for Cabo Verde for PRIMAP-hist v2.6.1_final compared to v2.6_final
Overview over emissions by sector and gas
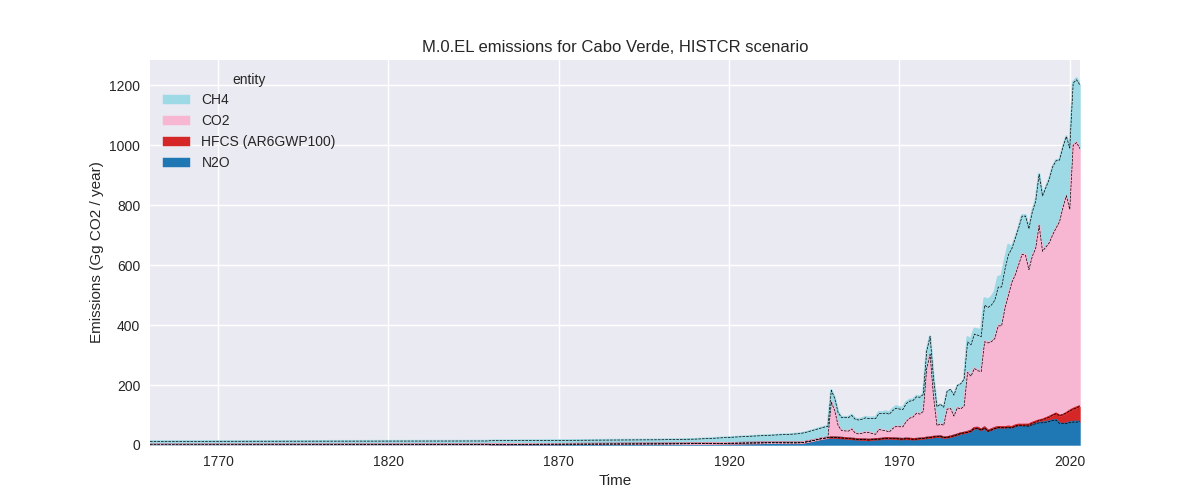
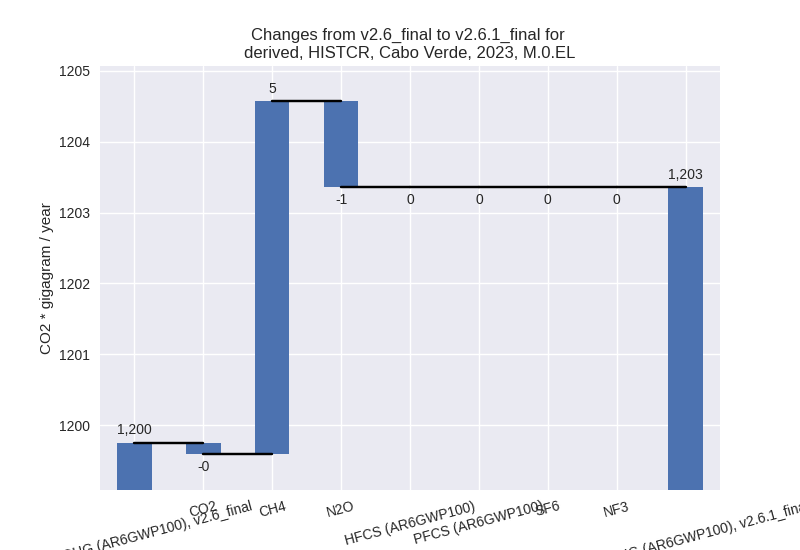
The following figures show the aggregate national total emissions excluding LULUCF AR6GWP100 for the country reported priority scenario. The dotted linesshow the v2.6_final data.
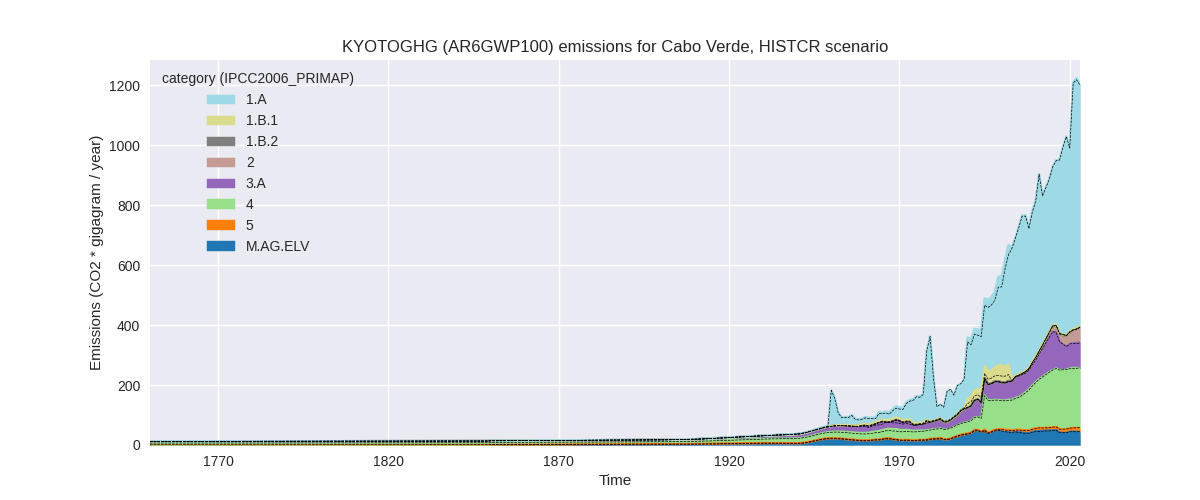
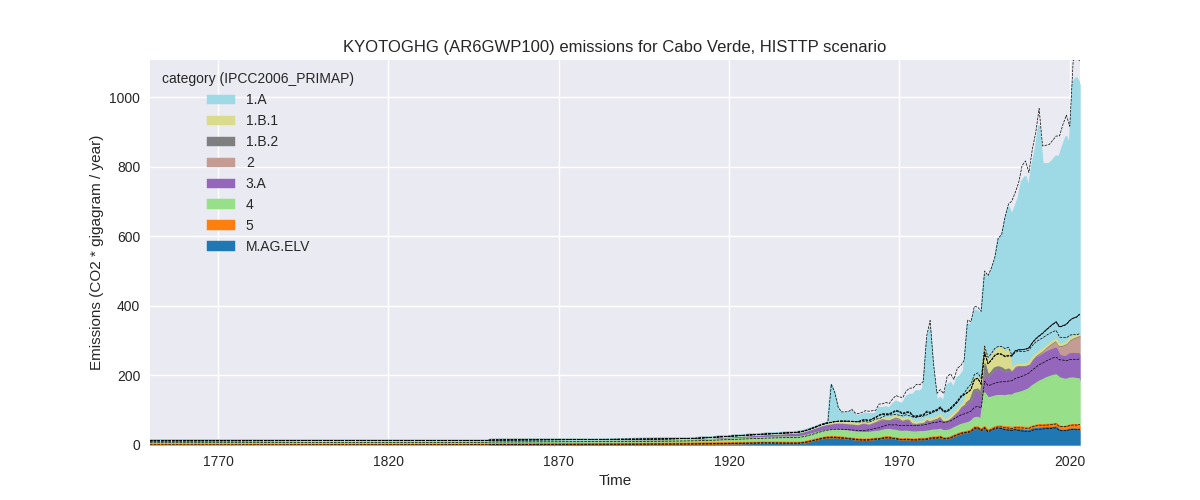
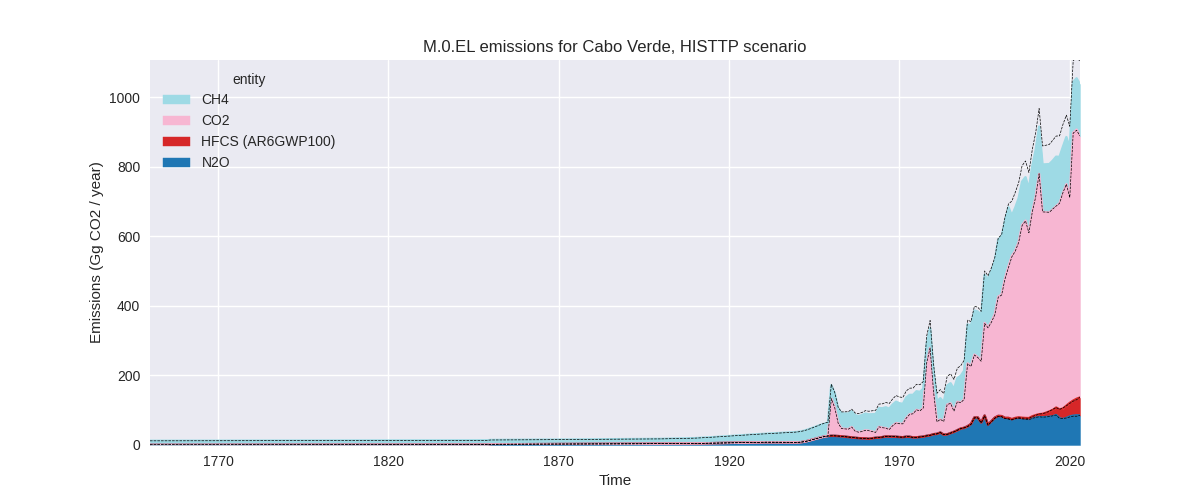
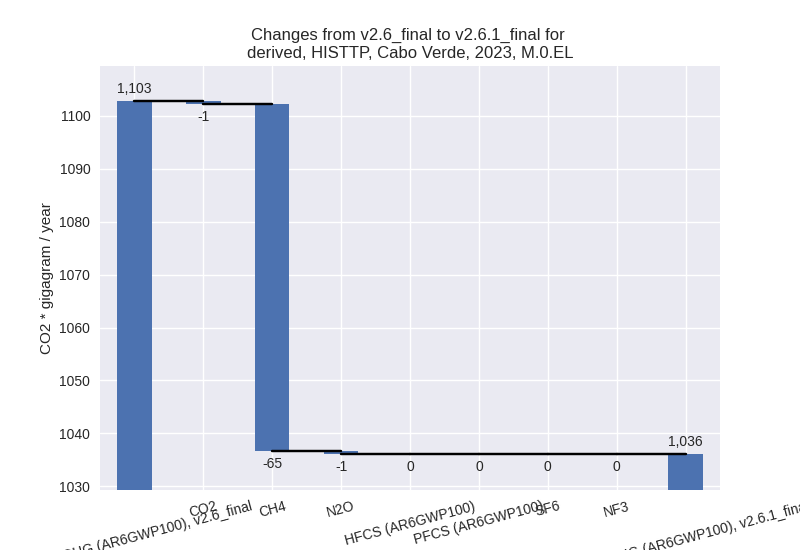
The following figures show the aggregate national total emissions excluding LULUCF AR6GWP100 for the third party priority scenario. The dotted linesshow the v2.6_final data.
Overview over changes
In the country reported priority scenario we have the following changes for aggregate Kyoto GHG and national total emissions excluding LULUCF (M.0.EL):
- Emissions in 2023 have changed by 0.3%% (3.61 Gg CO2 / year)
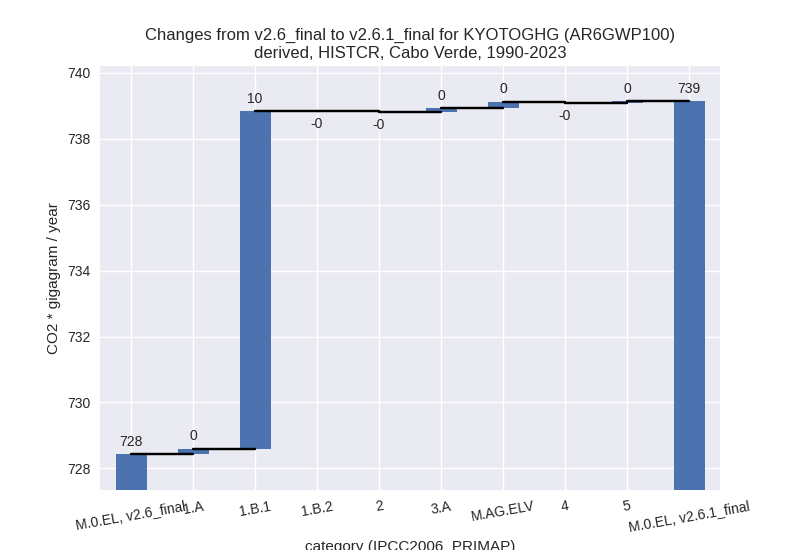
- Emissions in 1990-2023 have changed by 1.5%% (10.70 Gg CO2 / year)
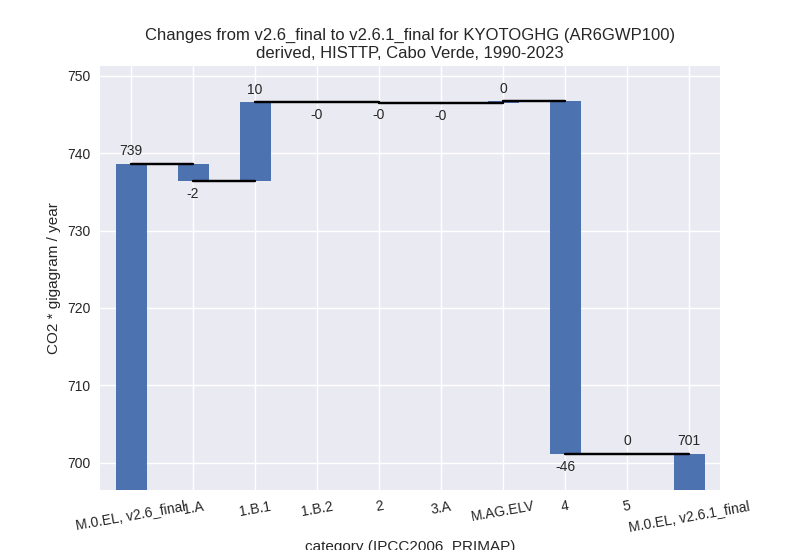
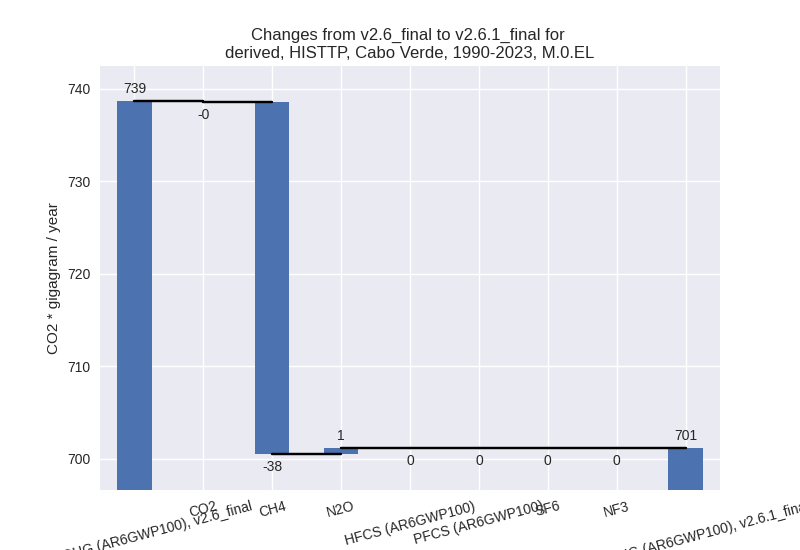
In the third party priority scenario we have the following changes for aggregate Kyoto GHG and national total emissions excluding LULUCF (M.0.EL):
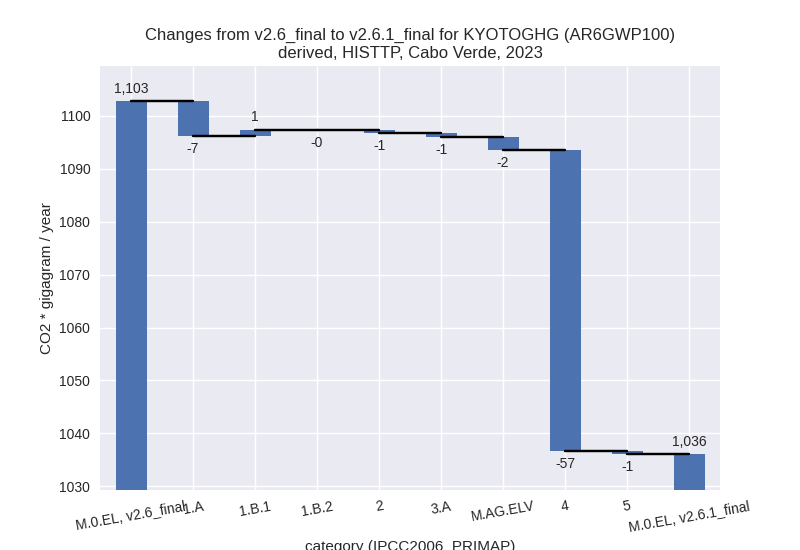
- Emissions in 2023 have changed by -6.0%% (-66.59 Gg CO2 / year)
- Emissions in 1990-2023 have changed by -5.1%% (-37.54 Gg CO2 / year)
Most important changes per scenario and time frame
In the country reported priority scenario the following sector-gas combinations have the highest absolute impact on national total KyotoGHG (AR6GWP100) emissions in 2023 (top 5):
- 1: 3.A, CH4 with 2.33 Gg CO2 / year (3.2%)
- 2: M.AG.ELV, N2O with -1.72 Gg CO2 / year (-4.0%)
- 3: 4, CH4 with 1.24 Gg CO2 / year (1.0%)
- 4: 1.B.1, CH4 with 1.08 Gg CO2 / year (110.2%)
- 5: 1.A, CH4 with 1.08 Gg CO2 / year (13.9%)
In the country reported priority scenario the following sector-gas combinations have the highest absolute impact on national total KyotoGHG (AR6GWP100) emissions in 1990-2023 (top 5):
- 1: 1.B.1, CH4 with 10.10 Gg CO2 / year (137.9%)
- 2: M.AG.ELV, N2O with 0.24 Gg CO2 / year (0.6%)
- 3: 1.B.1, N2O with 0.13 Gg CO2 / year (137.9%)
- 4: 1.A, CH4 with 0.12 Gg CO2 / year (1.8%)
- 5: 3.A, CH4 with 0.07 Gg CO2 / year (0.1%)
In the third party priority scenario the following sector-gas combinations have the highest absolute impact on national total KyotoGHG (AR6GWP100) emissions in 2023 (top 5):
- 1: 4, CH4 with -57.05 Gg CO2 / year (-48.7%)
- 2: 1.A, CH4 with -7.43 Gg CO2 / year (-25.1%)
- 3: M.AG.ELV, N2O with -1.72 Gg CO2 / year (-4.0%)
- 4: 3.A, CH4 with -1.24 Gg CO2 / year (-1.9%)
- 5: 1.B.1, CH4 with 1.08 Gg CO2 / year (110.2%)
In the third party priority scenario the following sector-gas combinations have the highest absolute impact on national total KyotoGHG (AR6GWP100) emissions in 1990-2023 (top 5):
- 1: 4, CH4 with -45.66 Gg CO2 / year (-53.1%)
- 2: 1.B.1, CH4 with 10.10 Gg CO2 / year (137.9%)
- 3: 1.A, CH4 with -2.48 Gg CO2 / year (-10.7%)
- 4: M.AG.ELV, N2O with 0.24 Gg CO2 / year (0.6%)
- 5: 1.A, N2O with 0.18 Gg CO2 / year (2.6%)
Notes on data changes
Here we list notes explaining important emissions changes for the country.
- No new country reported data has been included. Changes in the CR time-series are small with respect to total emissions and for individual sectors with the exception of 1.B.1 where no country reported data exists and EDGAR has high changes.
- In the TP time-series the main change is from waste CH4 (new EDGAR data)
Changes by sector and gas
For each scenario and time frame the changes are displayed for all individual sectors and all individual gases. In the sector plot we use aggregate Kyoto GHGs in AR6GWP100. In the gas plot we usenational total emissions without LULUCF.
country reported scenario
2023
1990-2023

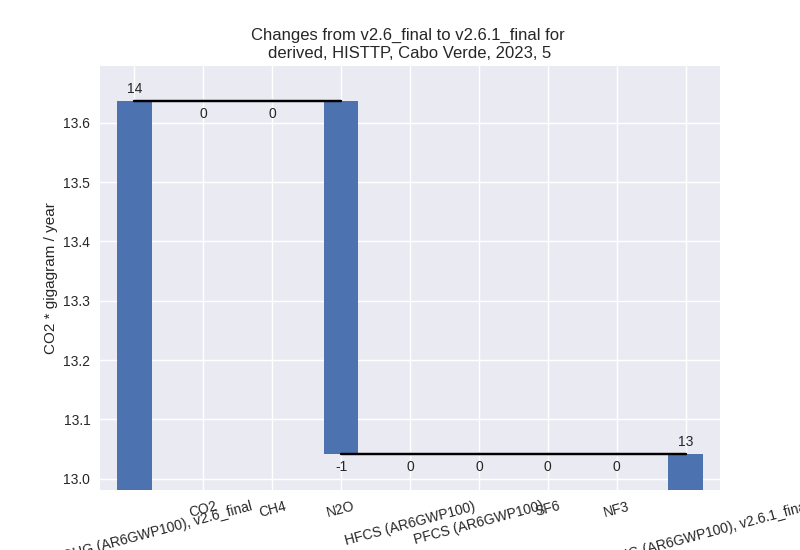
third party scenario
2023
1990-2023
Detailed changes for the scenarios:
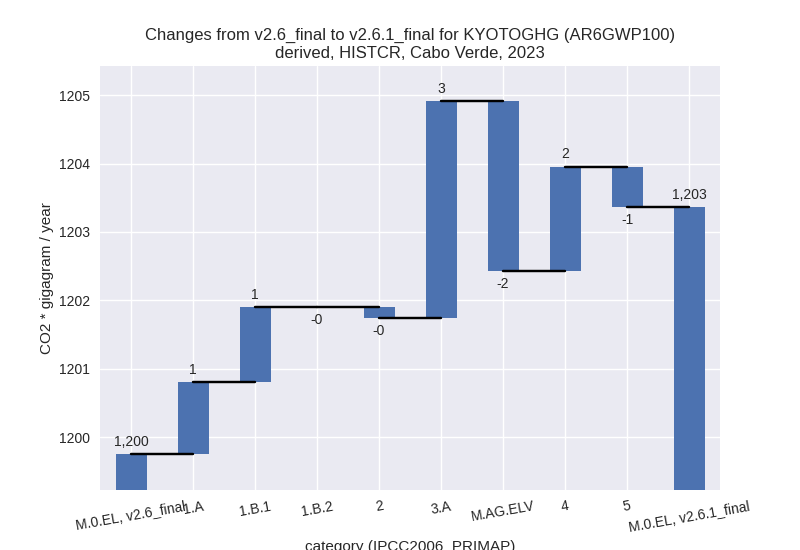
country reported scenario (HISTCR):
Most important changes per time frame
For 2023 the following sector-gas combinations have the highest absolute impact on national total KyotoGHG (AR6GWP100) emissions in 2023 (top 5):
- 1: 3.A, CH4 with 2.33 Gg CO2 / year (3.2%)
- 2: M.AG.ELV, N2O with -1.72 Gg CO2 / year (-4.0%)
- 3: 4, CH4 with 1.24 Gg CO2 / year (1.0%)
- 4: 1.B.1, CH4 with 1.08 Gg CO2 / year (110.2%)
- 5: 1.A, CH4 with 1.08 Gg CO2 / year (13.9%)
For 1990-2023 the following sector-gas combinations have the highest absolute impact on national total KyotoGHG (AR6GWP100) emissions in 1990-2023 (top 5):
- 1: 1.B.1, CH4 with 10.10 Gg CO2 / year (137.9%)
- 2: M.AG.ELV, N2O with 0.24 Gg CO2 / year (0.6%)
- 3: 1.B.1, N2O with 0.13 Gg CO2 / year (137.9%)
- 4: 1.A, CH4 with 0.12 Gg CO2 / year (1.8%)
- 5: 3.A, CH4 with 0.07 Gg CO2 / year (0.1%)
Changes in the main sectors for aggregate KyotoGHG (AR6GWP100) are
- 1: Total sectoral emissions in 2022 are 833.76 Gg
CO2 / year which is 68.2% of M.0.EL emissions. 2023 Emissions have
changed by 0.3% (2.15 Gg CO2 /
year). 1990-2023 Emissions have changed by 2.3% (10.40 Gg CO2 / year). For 1990-2023
the changes per gas
are:

The changes come from the following subsectors:- 1.A: Total sectoral emissions in 2022 are 831.66 Gg CO2 / year which is 99.7% of category 1 emissions. 2023 Emissions have changed by 0.1% (1.05 Gg CO2 / year). 1990-2023 Emissions have changed by 0.0% (0.16 Gg CO2 / year).
- 1.B.1: Total sectoral emissions in 2022 are 2.10 Gg
CO2 / year which is 0.3% of category 1 emissions. 2023 Emissions have
changed by 110.2% (1.10 Gg CO2 /
year). 1990-2023 Emissions have changed by 137.9% (10.24 Gg CO2 / year). For 2023 the
changes per gas
are:

For 1990-2023 the changes per gas are: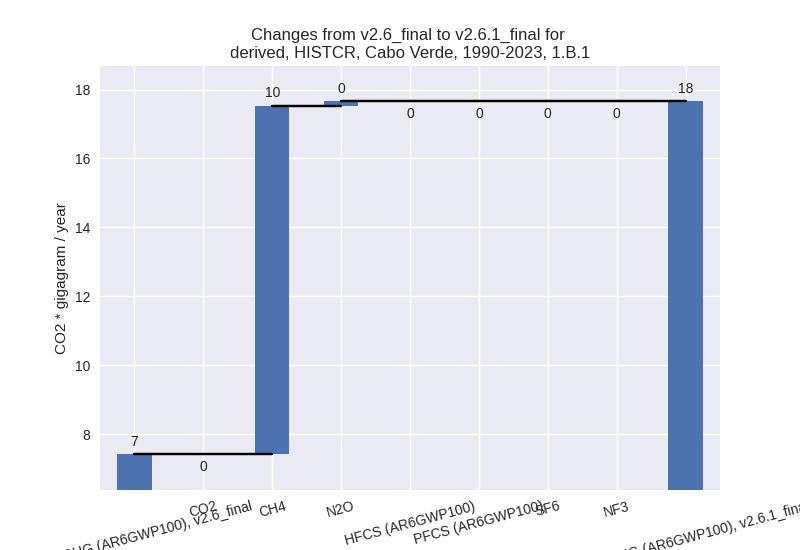
There is no subsector information available in PRIMAP-hist. - 1.B.2: Total sectoral emissions in 2022 are 0.00 Gg
CO2 / year which is 0.0% of category 1 emissions. 2023 Emissions have
changed by -22.0% (-0.00 Gg CO2 /
year). 1990-2023 Emissions have changed by -43.2% (-0.00 Gg CO2 / year). For 2023 the
changes per gas
are:

For 1990-2023 the changes per gas are: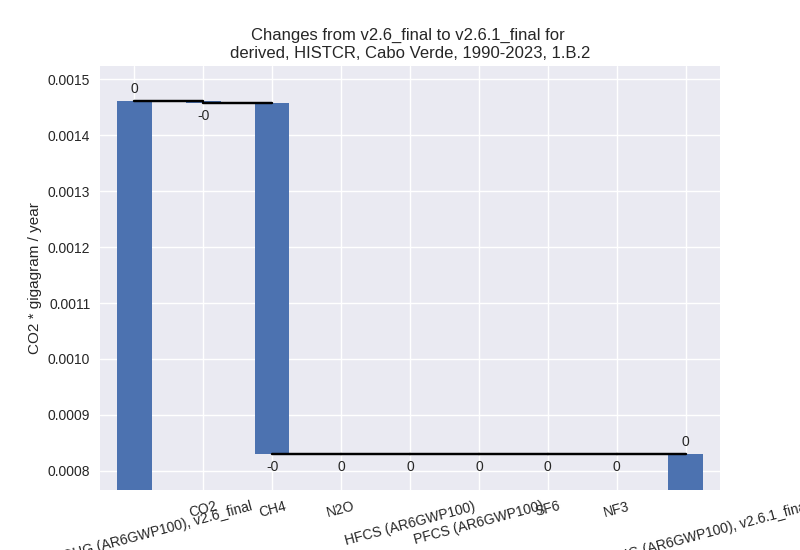
There is no subsector information available in PRIMAP-hist.
- 2: Total sectoral emissions in 2022 are 48.32 Gg CO2 / year which is 4.0% of M.0.EL emissions. 2023 Emissions have changed by -0.3% (-0.16 Gg CO2 / year). 1990-2023 Emissions have changed by -0.2% (-0.02 Gg CO2 / year).
- M.AG: Total sectoral emissions in 2022 are 127.09 Gg CO2 / year which is 10.4% of M.0.EL emissions. 2023 Emissions have changed by 0.5% (0.70 Gg CO2 / year). 1990-2023 Emissions have changed by 0.3% (0.32 Gg CO2 / year).
- 4: Total sectoral emissions in 2022 are 200.04 Gg CO2 / year which is 16.4% of M.0.EL emissions. 2023 Emissions have changed by 0.8% (1.52 Gg CO2 / year). 1990-2023 Emissions have changed by -0.0% (-0.03 Gg CO2 / year).
- 5: Total sectoral emissions in 2022 are 13.40 Gg
CO2 / year which is 1.1% of M.0.EL emissions. 2023 Emissions have
changed by -4.4% (-0.60 Gg CO2 /
year). 1990-2023 Emissions have changed by 0.5% (0.04 Gg CO2 / year). For 2023 the
changes per gas
are:

third party scenario (HISTTP):
Most important changes per time frame
For 2023 the following sector-gas combinations have the highest absolute impact on national total KyotoGHG (AR6GWP100) emissions in 2023 (top 5):
- 1: 4, CH4 with -57.05 Gg CO2 / year (-48.7%)
- 2: 1.A, CH4 with -7.43 Gg CO2 / year (-25.1%)
- 3: M.AG.ELV, N2O with -1.72 Gg CO2 / year (-4.0%)
- 4: 3.A, CH4 with -1.24 Gg CO2 / year (-1.9%)
- 5: 1.B.1, CH4 with 1.08 Gg CO2 / year (110.2%)
For 1990-2023 the following sector-gas combinations have the highest absolute impact on national total KyotoGHG (AR6GWP100) emissions in 1990-2023 (top 5):
- 1: 4, CH4 with -45.66 Gg CO2 / year (-53.1%)
- 2: 1.B.1, CH4 with 10.10 Gg CO2 / year (137.9%)
- 3: 1.A, CH4 with -2.48 Gg CO2 / year (-10.7%)
- 4: M.AG.ELV, N2O with 0.24 Gg CO2 / year (0.6%)
- 5: 1.A, N2O with 0.18 Gg CO2 / year (2.6%)
Changes in the main sectors for aggregate KyotoGHG (AR6GWP100) are
- 1: Total sectoral emissions in 2022 are 742.64 Gg CO2 / year which is 70.5% of M.0.EL emissions. 2023 Emissions have changed by -0.7% (-5.40 Gg CO2 / year). 1990-2023 Emissions have changed by 1.7% (7.94 Gg CO2 / year).
- 2: Total sectoral emissions in 2022 are 50.45 Gg CO2 / year which is 4.8% of M.0.EL emissions. 2023 Emissions have changed by -1.1% (-0.59 Gg CO2 / year). 1990-2023 Emissions have changed by -0.4% (-0.05 Gg CO2 / year).
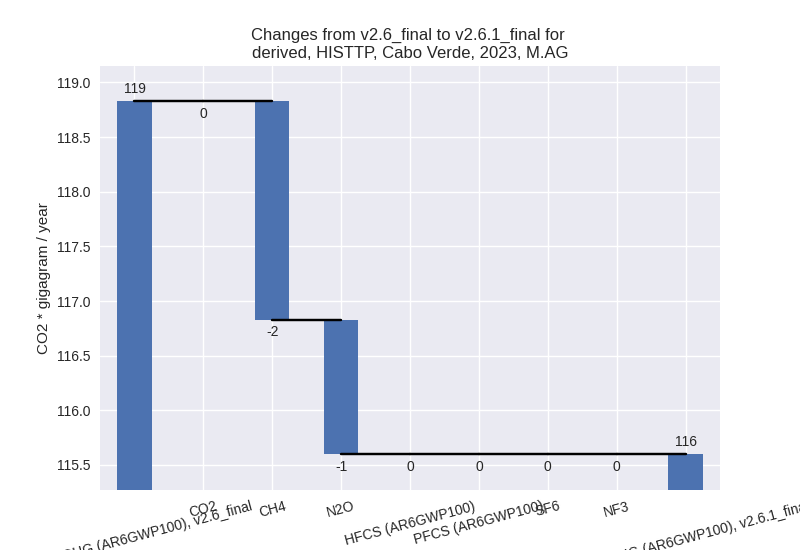
- M.AG: Total sectoral emissions in 2022 are 114.67
Gg CO2 / year which is 10.9% of M.0.EL emissions. 2023 Emissions have
changed by -2.7% (-3.23 Gg CO2 /
year). 1990-2023 Emissions have changed by 0.1% (0.16 Gg CO2 / year). For 2023 the
changes per gas
are:
The changes come from the following subsectors:- 3.A: Total sectoral emissions in 2022 are 71.35 Gg CO2 / year which is 62.2% of category M.AG emissions. 2023 Emissions have changed by -1.0% (-0.75 Gg CO2 / year). 1990-2023 Emissions have changed by -0.0% (-0.03 Gg CO2 / year).
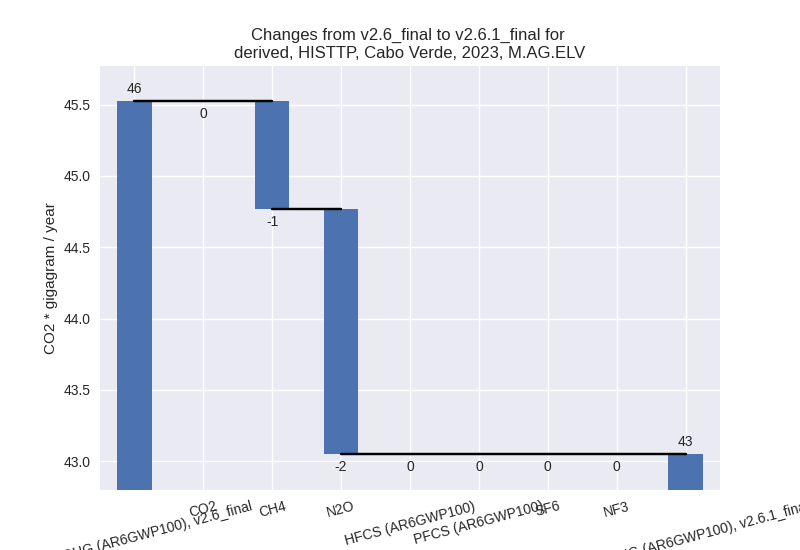
- M.AG.ELV: Total sectoral emissions in 2022 are
43.32 Gg CO2 / year which is 37.8% of category M.AG emissions. 2023
Emissions have changed by -5.4%
(-2.48 Gg CO2 / year). 1990-2023 Emissions have changed by 0.5% (0.20 Gg CO2 / year). For 2023 the
changes per gas
are:
There is no subsector information available in PRIMAP-hist.
- 4: Total sectoral emissions in 2022 are 132.54 Gg
CO2 / year which is 12.6% of M.0.EL emissions. 2023 Emissions have
changed by -30.2% (-56.78 Gg CO2 /
year). 1990-2023 Emissions have changed by -31.1% (-45.64 Gg CO2 / year). For 2023
the changes per gas
are:

For 1990-2023 the changes per gas are:
- 5: Total sectoral emissions in 2022 are 13.40 Gg
CO2 / year which is 1.3% of M.0.EL emissions. 2023 Emissions have
changed by -4.4% (-0.60 Gg CO2 /
year). 1990-2023 Emissions have changed by 0.5% (0.04 Gg CO2 / year). For 2023 the
changes per gas
are: