Changes in PRIMAP-hist v2.6.1_final compared to v2.6_final for Costa Rica
2025-03-19
Johannes Gütschow
Change analysis for Costa Rica for PRIMAP-hist v2.6.1_final compared to v2.6_final
Overview over emissions by sector and gas
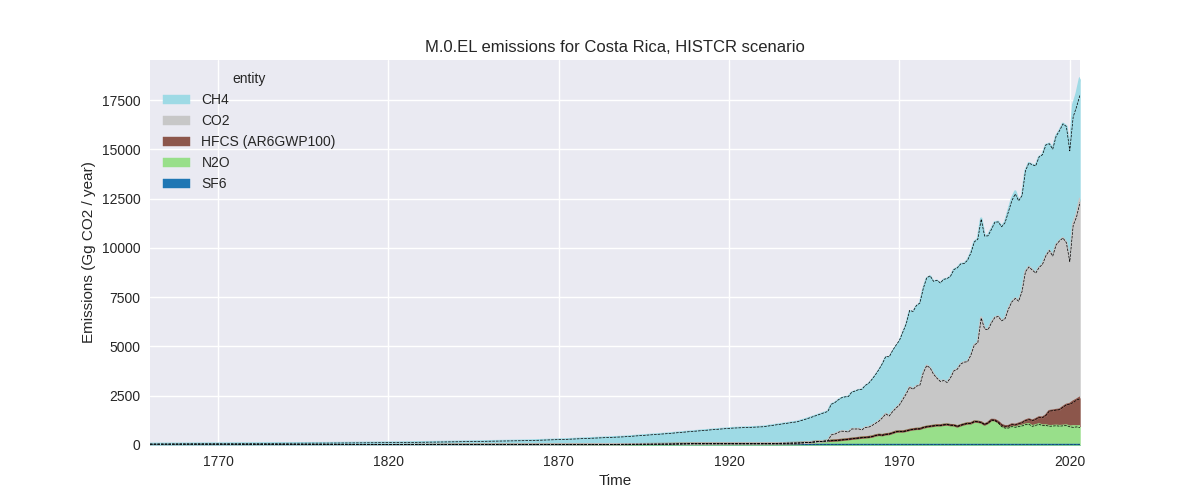
The following figures show the aggregate national total emissions excluding LULUCF AR6GWP100 for the country reported priority scenario. The dotted linesshow the v2.6_final data.
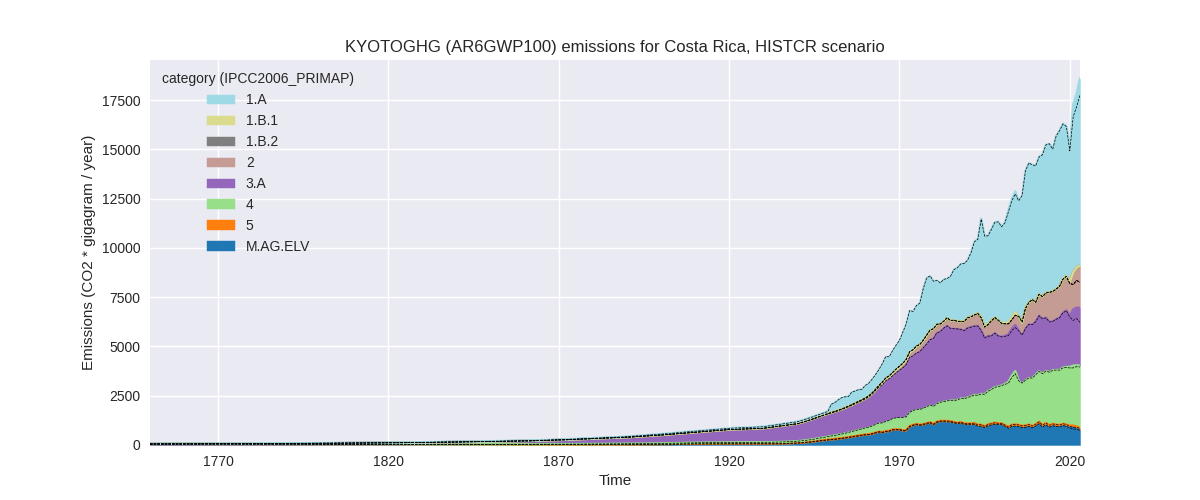
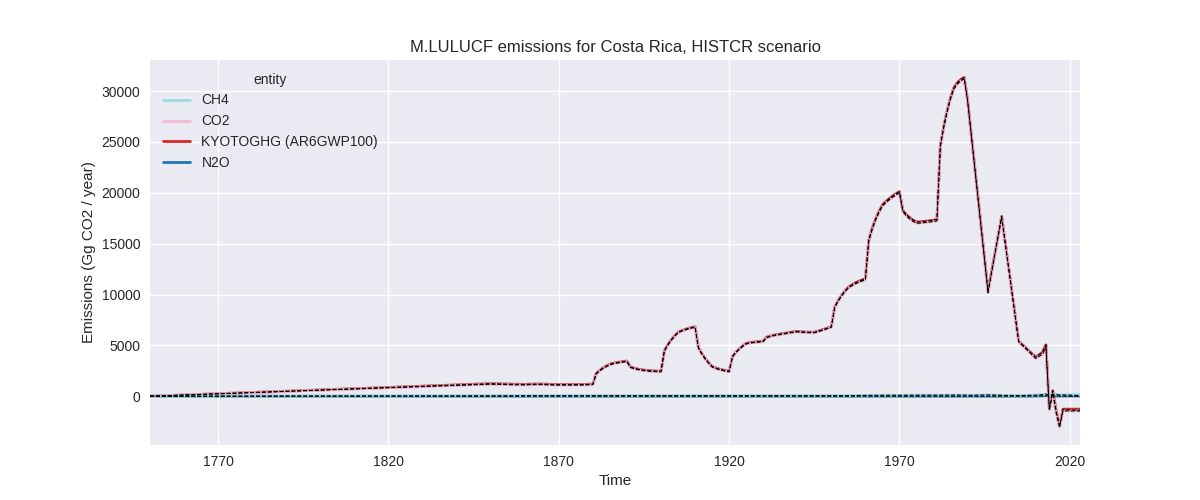
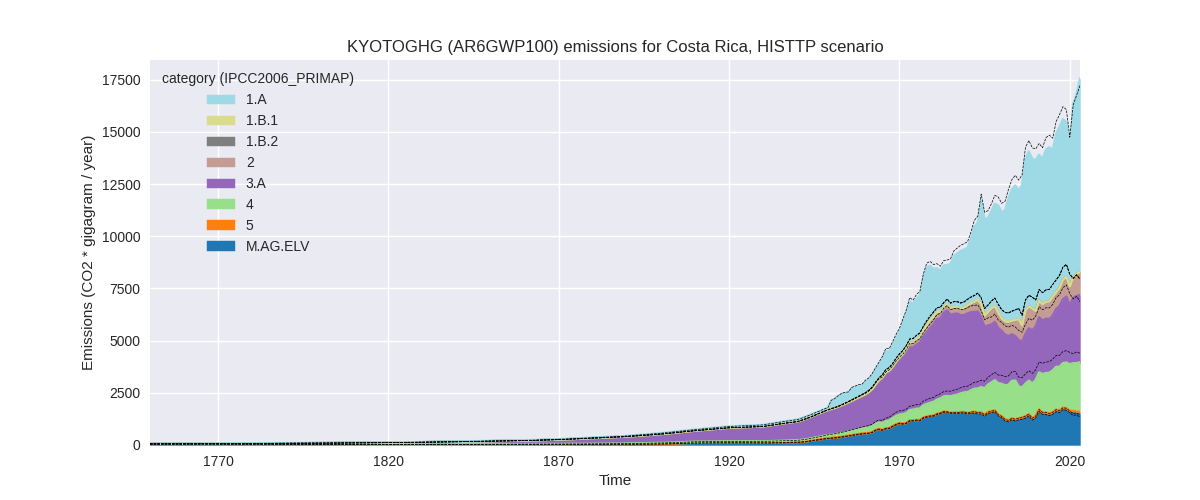
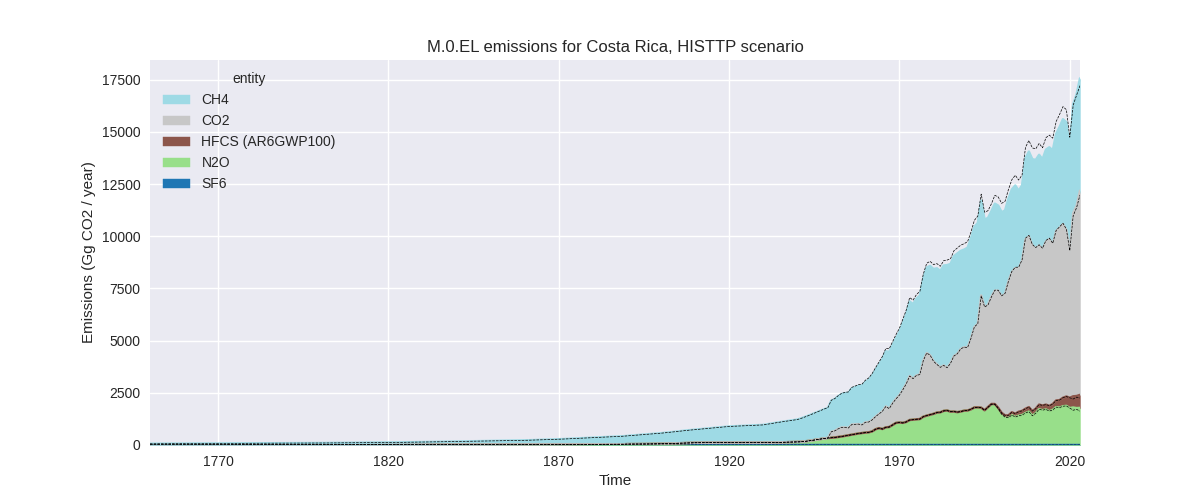
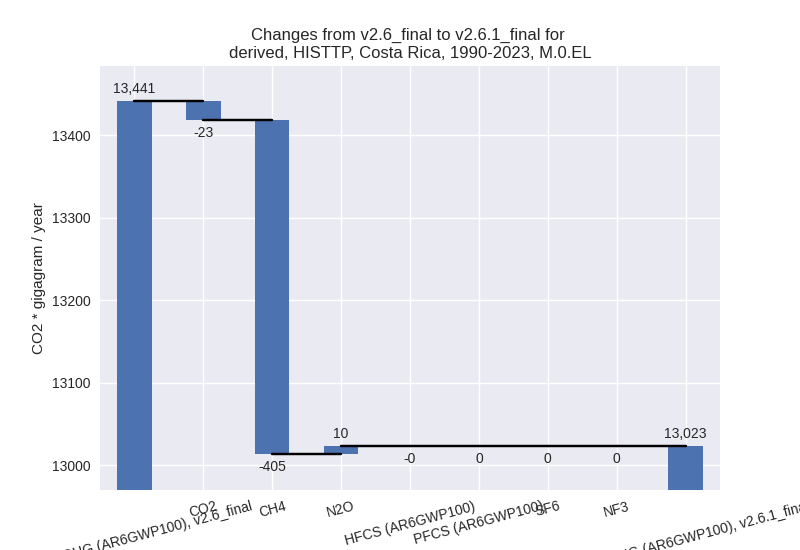
The following figures show the aggregate national total emissions excluding LULUCF AR6GWP100 for the third party priority scenario. The dotted linesshow the v2.6_final data.
Overview over changes
In the country reported priority scenario we have the following changes for aggregate Kyoto GHG and national total emissions excluding LULUCF (M.0.EL):
- Emissions in 2023 have changed by 4.7%% (840.90 Gg CO2 / year)
- Emissions in 1990-2023 have changed by 0.6%% (73.68 Gg CO2 / year)
In the third party priority scenario we have the following changes for aggregate Kyoto GHG and national total emissions excluding LULUCF (M.0.EL):
- Emissions in 2023 have changed by 2.0%% (347.06 Gg CO2 / year)
- Emissions in 1990-2023 have changed by -3.1%% (-418.01 Gg CO2 / year)
Most important changes per scenario and time frame
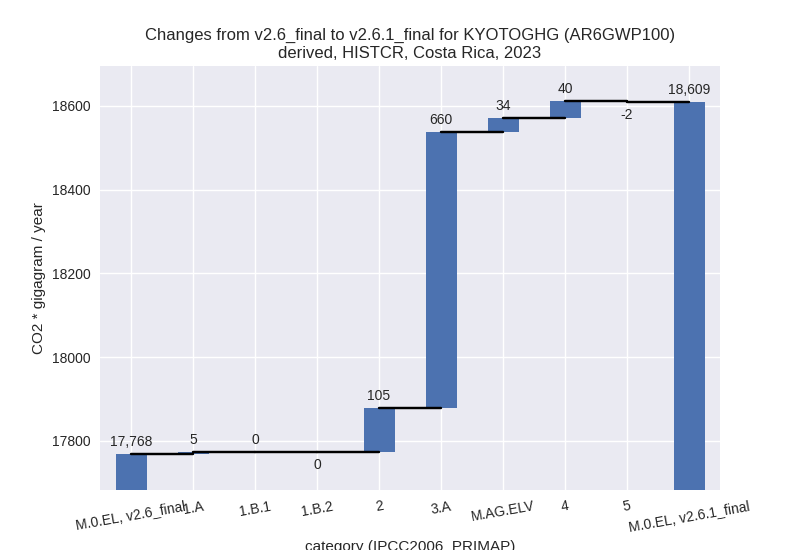
In the country reported priority scenario the following sector-gas combinations have the highest absolute impact on national total KyotoGHG (AR6GWP100) emissions in 2023 (top 5):
- 1: 3.A, CH4 with 654.81 Gg CO2 / year (30.8%)
- 2: 2, CO2 with 115.23 Gg CO2 / year (20.2%)
- 3: M.AG.ELV, N2O with 59.42 Gg CO2 / year (12.8%)
- 4: 4, CH4 with 39.03 Gg CO2 / year (1.3%)
- 5: M.AG.ELV, CH4 with -32.34 Gg CO2 / year (-14.7%)
In the country reported priority scenario the following sector-gas combinations have the highest absolute impact on national total KyotoGHG (AR6GWP100) emissions in 1990-2023 (top 5):
- 1: 3.A, CH4 with 46.44 Gg CO2 / year (1.8%)
- 2: 2, CO2 with 10.61 Gg CO2 / year (1.9%)
- 3: 4, CH4 with 10.10 Gg CO2 / year (0.5%)
- 4: M.AG.ELV, N2O with 4.09 Gg CO2 / year (0.7%)
- 5: 1.B.2, CO2 with 2.84 Gg CO2 / year (1231741.3%)
In the third party priority scenario the following sector-gas combinations have the highest absolute impact on national total KyotoGHG (AR6GWP100) emissions in 2023 (top 5):
- 1: 3.A, CH4 with 743.95 Gg CO2 / year (30.8%)
- 2: 4, CH4 with -599.12 Gg CO2 / year (-22.0%)
- 3: M.AG.ELV, N2O with 150.47 Gg CO2 / year (12.8%)
- 4: 2, CO2 with 37.60 Gg CO2 / year (8.5%)
- 5: M.AG.ELV, CO2 with 16.65 Gg CO2 / year (13.0%)
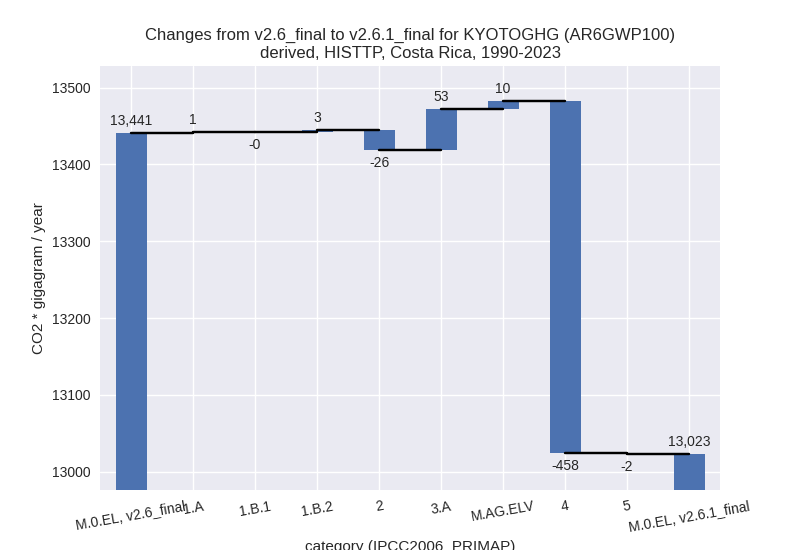
In the third party priority scenario the following sector-gas combinations have the highest absolute impact on national total KyotoGHG (AR6GWP100) emissions in 1990-2023 (top 5):
- 1: 4, CH4 with -458.08 Gg CO2 / year (-23.2%)
- 2: 3.A, CH4 with 52.76 Gg CO2 / year (1.9%)
- 3: 2, CO2 with -25.34 Gg CO2 / year (-4.7%)
- 4: M.AG.ELV, N2O with 10.36 Gg CO2 / year (0.8%)
- 5: 1.B.2, CO2 with 2.84 Gg CO2 / year (1231741.3%)
Notes on data changes
Here we list notes explaining important emissions changes for the country.
- No new country reported data has been included
- The main change for 2023 is a 31% increase in livestock CH4 because new FAO data shows a steep increase for 2021 instead of the emissions drop in the previous release (CR, TP).
- In the TP scenario waste emissions are over 20% lower due to the new EDGAR data.
Changes by sector and gas
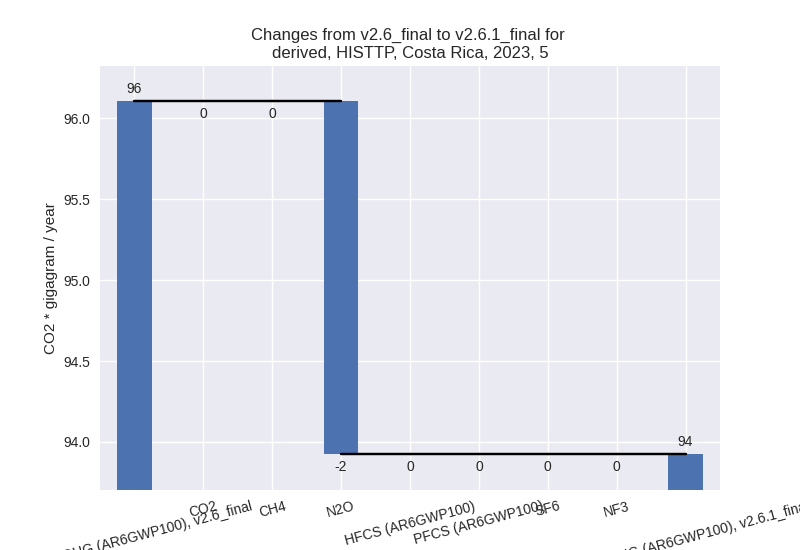
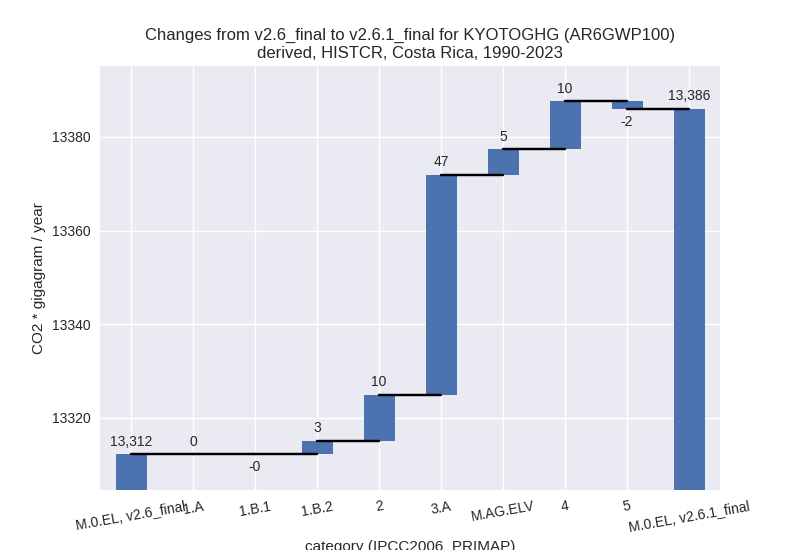
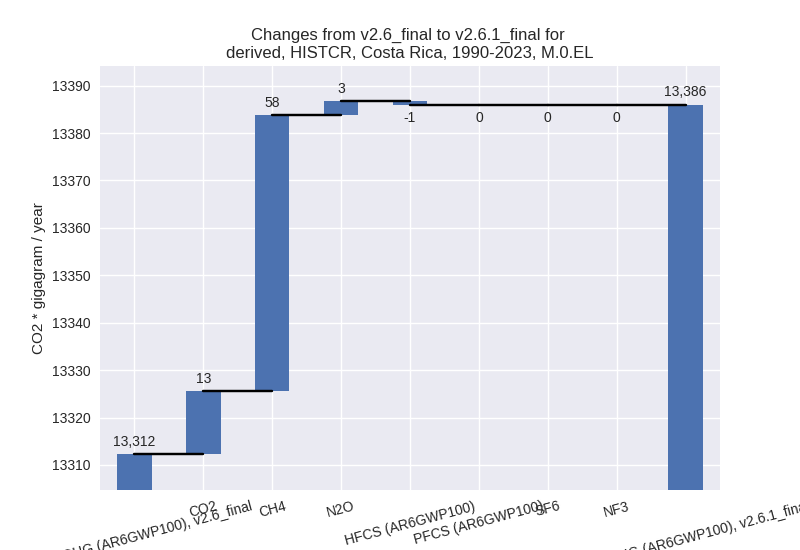
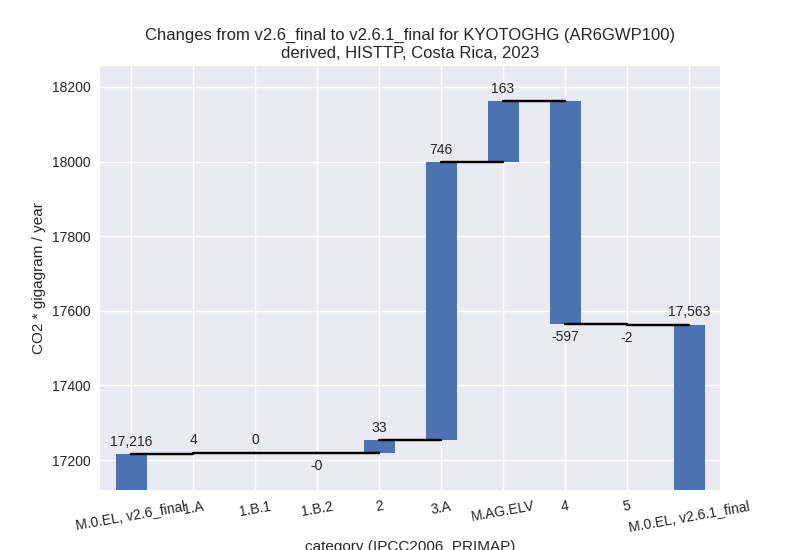
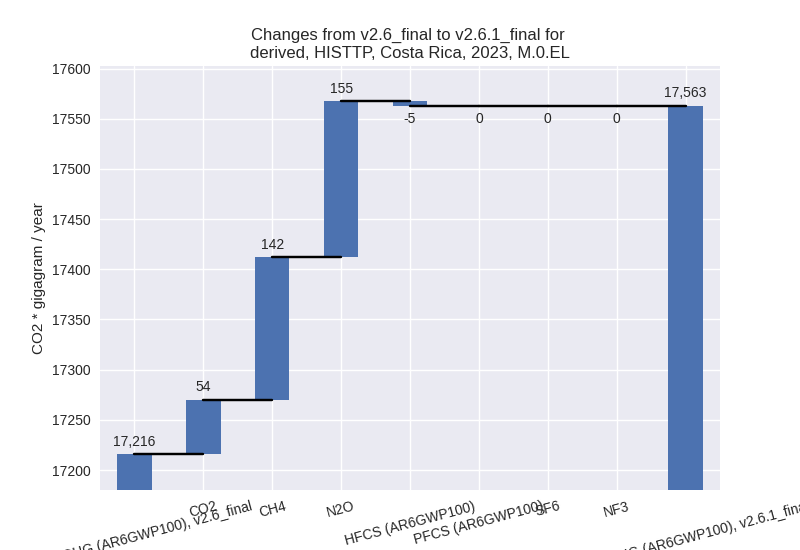
For each scenario and time frame the changes are displayed for all individual sectors and all individual gases. In the sector plot we use aggregate Kyoto GHGs in AR6GWP100. In the gas plot we usenational total emissions without LULUCF.
country reported scenario
2023

1990-2023
third party scenario
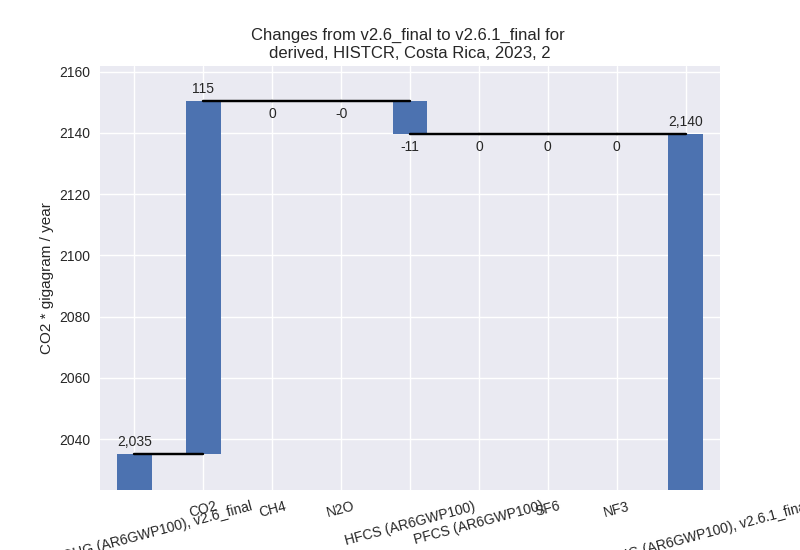
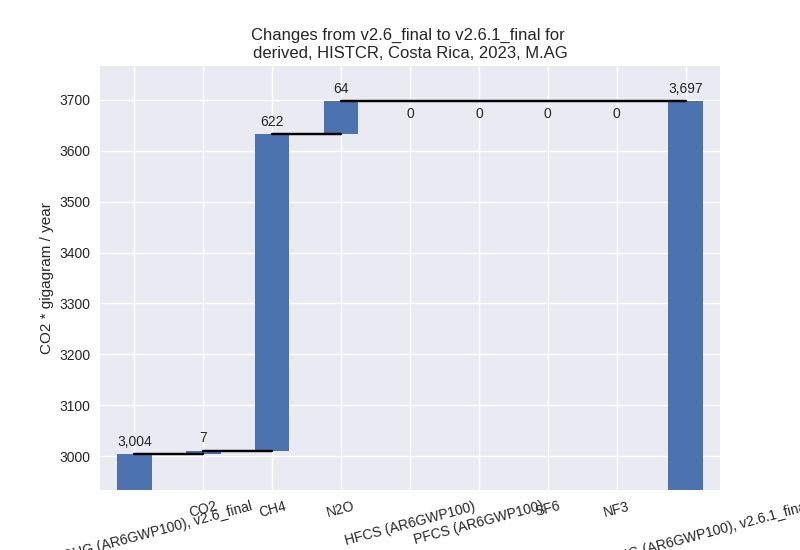
2023
1990-2023
Detailed changes for the scenarios:
country reported scenario (HISTCR):
Most important changes per time frame
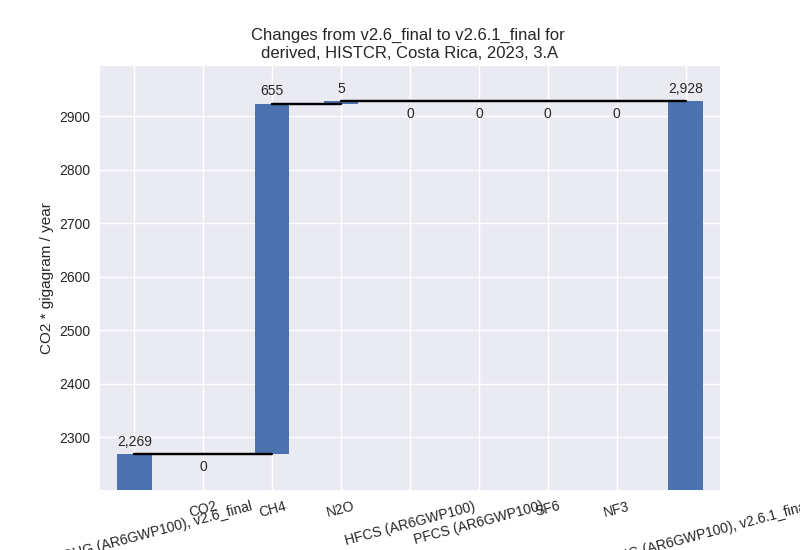
For 2023 the following sector-gas combinations have the highest absolute impact on national total KyotoGHG (AR6GWP100) emissions in 2023 (top 5):
- 1: 3.A, CH4 with 654.81 Gg CO2 / year (30.8%)
- 2: 2, CO2 with 115.23 Gg CO2 / year (20.2%)
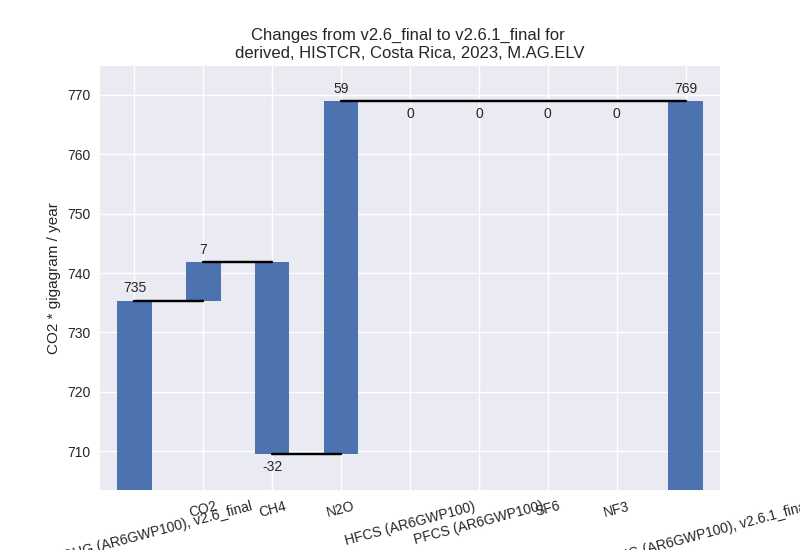
- 3: M.AG.ELV, N2O with 59.42 Gg CO2 / year (12.8%)
- 4: 4, CH4 with 39.03 Gg CO2 / year (1.3%)
- 5: M.AG.ELV, CH4 with -32.34 Gg CO2 / year (-14.7%)
For 1990-2023 the following sector-gas combinations have the highest absolute impact on national total KyotoGHG (AR6GWP100) emissions in 1990-2023 (top 5):
- 1: 3.A, CH4 with 46.44 Gg CO2 / year (1.8%)
- 2: 2, CO2 with 10.61 Gg CO2 / year (1.9%)
- 3: 4, CH4 with 10.10 Gg CO2 / year (0.5%)
- 4: M.AG.ELV, N2O with 4.09 Gg CO2 / year (0.7%)
- 5: 1.B.2, CO2 with 2.84 Gg CO2 / year (1231741.3%)
Changes in the main sectors for aggregate KyotoGHG (AR6GWP100) are
- 1: Total sectoral emissions in 2022 are 8813.96 Gg CO2 / year which is 49.5% of M.0.EL emissions. 2023 Emissions have changed by 0.1% (5.33 Gg CO2 / year). 1990-2023 Emissions have changed by 0.0% (2.87 Gg CO2 / year).
- 2: Total sectoral emissions in 2022 are 2036.83 Gg
CO2 / year which is 11.4% of M.0.EL emissions. 2023 Emissions have
changed by 5.1% (104.54 Gg CO2 /
year). 1990-2023 Emissions have changed by 0.9% (9.84 Gg CO2 / year). For 2023 the
changes per gas
are:
- M.AG: Total sectoral emissions in 2022 are 3768.35
Gg CO2 / year which is 21.1% of M.0.EL emissions. 2023 Emissions have
changed by 23.1% (693.27 Gg CO2 /
year). 1990-2023 Emissions have changed by 1.4% (52.36 Gg CO2 / year). For 2023 the
changes per gas
are:
The changes come from the following subsectors:- 3.A: Total sectoral emissions in 2022 are 2927.77
Gg CO2 / year which is 77.7% of category M.AG emissions. 2023 Emissions
have changed by 29.1% (659.68 Gg CO2
/ year). 1990-2023 Emissions have changed by 1.7% (46.90 Gg CO2 / year). For 2023 the
changes per gas
are:
There is no subsector information available in PRIMAP-hist. - M.AG.ELV: Total sectoral emissions in 2022 are
840.57 Gg CO2 / year which is 22.3% of category M.AG emissions. 2023
Emissions have changed by 4.6%
(33.59 Gg CO2 / year). 1990-2023 Emissions have changed by 0.6% (5.46 Gg CO2 / year). For 2023 the
changes per gas
are:
There is no subsector information available in PRIMAP-hist.
- 3.A: Total sectoral emissions in 2022 are 2927.77
Gg CO2 / year which is 77.7% of category M.AG emissions. 2023 Emissions
have changed by 29.1% (659.68 Gg CO2
/ year). 1990-2023 Emissions have changed by 1.7% (46.90 Gg CO2 / year). For 2023 the
changes per gas
are:
- 4: Total sectoral emissions in 2022 are 3104.61 Gg CO2 / year which is 17.4% of M.0.EL emissions. 2023 Emissions have changed by 1.3% (39.95 Gg CO2 / year). 1990-2023 Emissions have changed by 0.4% (10.23 Gg CO2 / year).
- 5: Total sectoral emissions in 2022 are 95.95 Gg
CO2 / year which is 0.5% of M.0.EL emissions. 2023 Emissions have
changed by -2.3% (-2.18 Gg CO2 /
year). 1990-2023 Emissions have changed by -2.0% (-1.63 Gg CO2 / year). For 2023 the
changes per gas
are:

third party scenario (HISTTP):
Most important changes per time frame
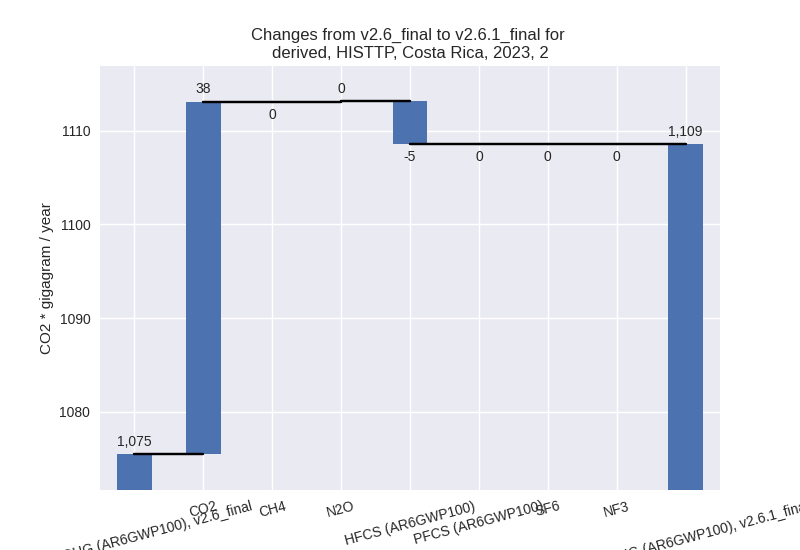
For 2023 the following sector-gas combinations have the highest absolute impact on national total KyotoGHG (AR6GWP100) emissions in 2023 (top 5):
- 1: 3.A, CH4 with 743.95 Gg CO2 / year (30.8%)
- 2: 4, CH4 with -599.12 Gg CO2 / year (-22.0%)
- 3: M.AG.ELV, N2O with 150.47 Gg CO2 / year (12.8%)
- 4: 2, CO2 with 37.60 Gg CO2 / year (8.5%)
- 5: M.AG.ELV, CO2 with 16.65 Gg CO2 / year (13.0%)
For 1990-2023 the following sector-gas combinations have the highest absolute impact on national total KyotoGHG (AR6GWP100) emissions in 1990-2023 (top 5):
- 1: 4, CH4 with -458.08 Gg CO2 / year (-23.2%)
- 2: 3.A, CH4 with 52.76 Gg CO2 / year (1.9%)
- 3: 2, CO2 with -25.34 Gg CO2 / year (-4.7%)
- 4: M.AG.ELV, N2O with 10.36 Gg CO2 / year (0.8%)
- 5: 1.B.2, CO2 with 2.84 Gg CO2 / year (1231741.3%)
Changes in the main sectors for aggregate KyotoGHG (AR6GWP100) are
- 1: Total sectoral emissions in 2022 are 8597.49 Gg CO2 / year which is 51.2% of M.0.EL emissions. 2023 Emissions have changed by 0.0% (4.12 Gg CO2 / year). 1990-2023 Emissions have changed by 0.1% (3.62 Gg CO2 / year).
- 2: Total sectoral emissions in 2022 are 1063.11 Gg
CO2 / year which is 6.3% of M.0.EL emissions. 2023 Emissions have
changed by 3.1% (33.06 Gg CO2 /
year). 1990-2023 Emissions have changed by -3.2% (-25.67 Gg CO2 / year). For 2023 the
changes per gas
are:
For 1990-2023 the changes per gas are: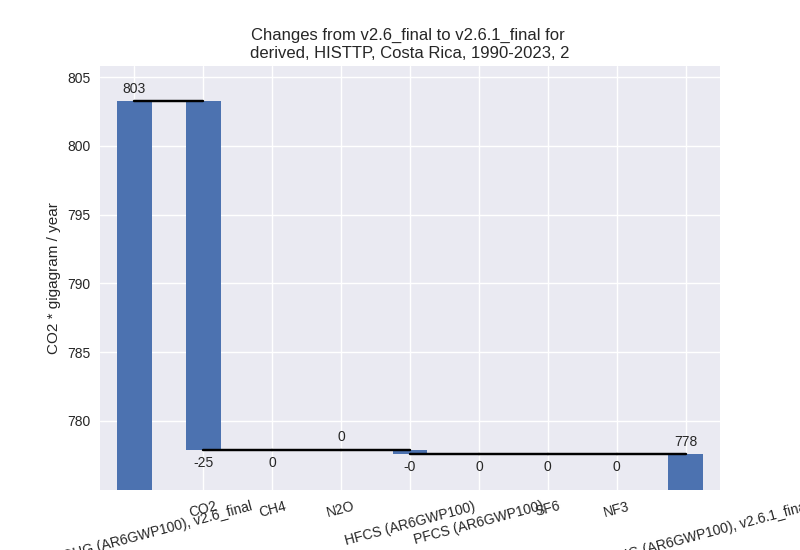
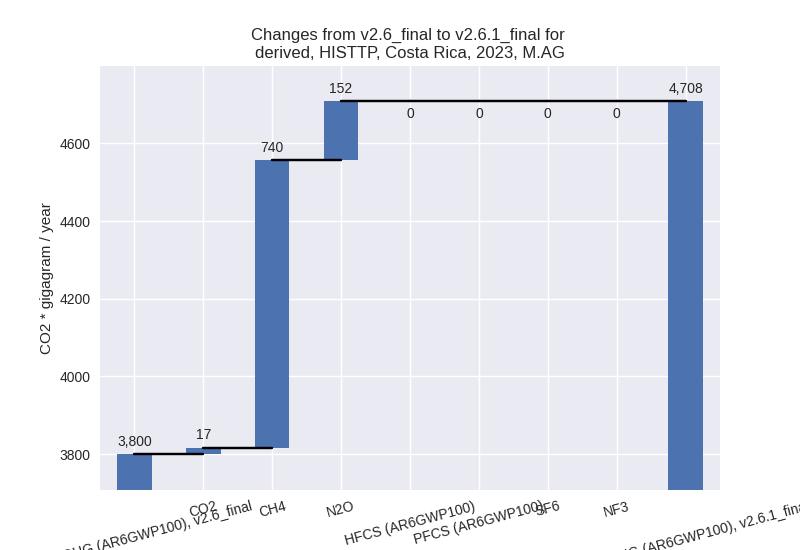
- M.AG: Total sectoral emissions in 2022 are 4714.60
Gg CO2 / year which is 28.1% of M.0.EL emissions. 2023 Emissions have
changed by 23.9% (908.71 Gg CO2 /
year). 1990-2023 Emissions have changed by 1.5% (63.38 Gg CO2 / year). For 2023 the
changes per gas
are:
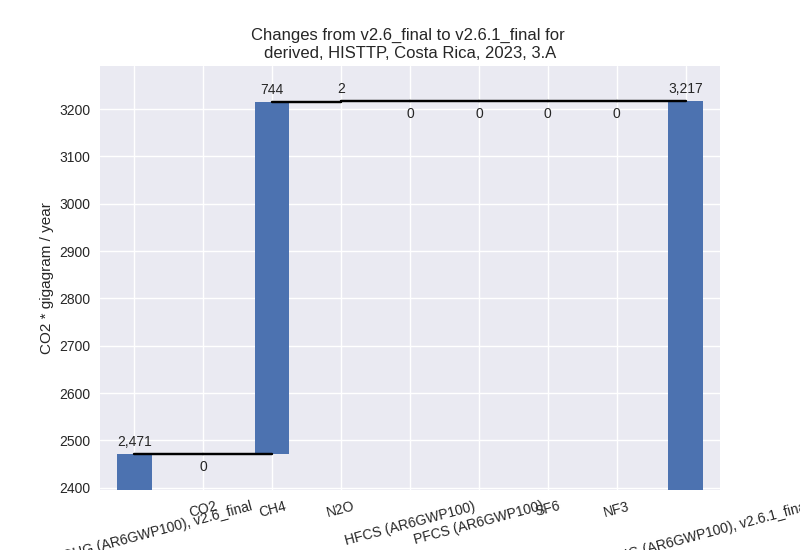
The changes come from the following subsectors:- 3.A: Total sectoral emissions in 2022 are 3216.31
Gg CO2 / year which is 68.2% of category M.AG emissions. 2023 Emissions
have changed by 30.2% (745.89 Gg CO2
/ year). 1990-2023 Emissions have changed by 1.9% (52.95 Gg CO2 / year). For 2023 the
changes per gas
are:
There is no subsector information available in PRIMAP-hist. - M.AG.ELV: Total sectoral emissions in 2022 are
1498.29 Gg CO2 / year which is 31.8% of category M.AG emissions. 2023
Emissions have changed by 12.3%
(162.81 Gg CO2 / year). 1990-2023 Emissions have changed by 0.7% (10.43 Gg CO2 / year). For 2023 the
changes per gas
are:
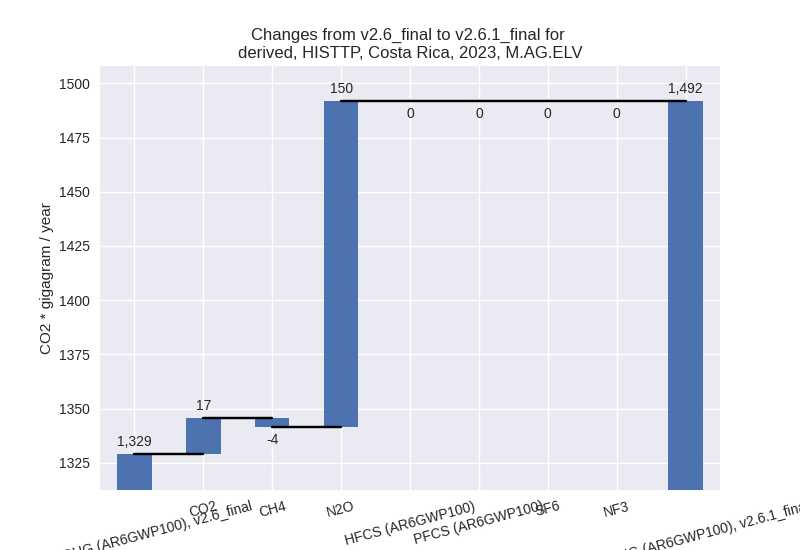
There is no subsector information available in PRIMAP-hist.
- 3.A: Total sectoral emissions in 2022 are 3216.31
Gg CO2 / year which is 68.2% of category M.AG emissions. 2023 Emissions
have changed by 30.2% (745.89 Gg CO2
/ year). 1990-2023 Emissions have changed by 1.9% (52.95 Gg CO2 / year). For 2023 the
changes per gas
are:
- 4: Total sectoral emissions in 2022 are 2326.19 Gg
CO2 / year which is 13.8% of M.0.EL emissions. 2023 Emissions have
changed by -20.1% (-596.64 Gg CO2 /
year). 1990-2023 Emissions have changed by -21.3% (-457.71 Gg CO2 / year). For 2023
the changes per gas
are:
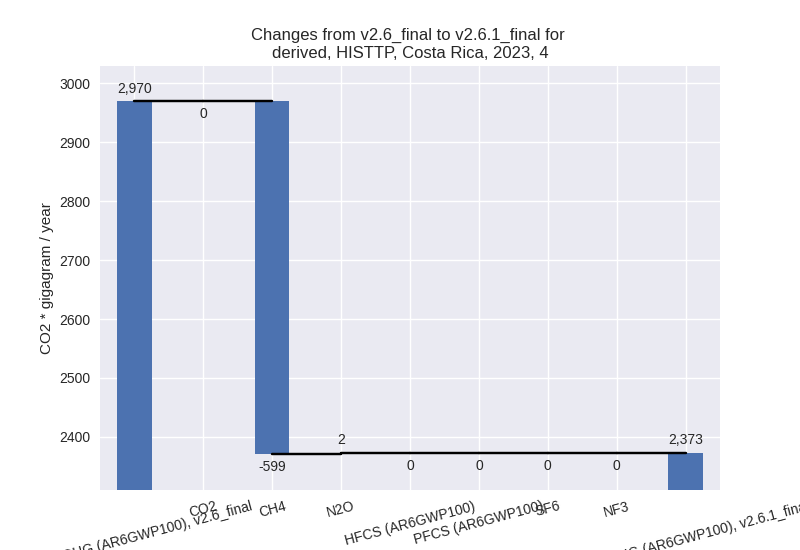
For 1990-2023 the changes per gas are:
- 5: Total sectoral emissions in 2022 are 95.95 Gg
CO2 / year which is 0.6% of M.0.EL emissions. 2023 Emissions have
changed by -2.3% (-2.18 Gg CO2 /
year). 1990-2023 Emissions have changed by -2.0% (-1.63 Gg CO2 / year). For 2023 the
changes per gas
are: