Changes in PRIMAP-hist v2.6.1_final compared to v2.6_final for Cuba
2025-03-19
Johannes Gütschow
Change analysis for Cuba for PRIMAP-hist v2.6.1_final compared to v2.6_final
Overview over emissions by sector and gas
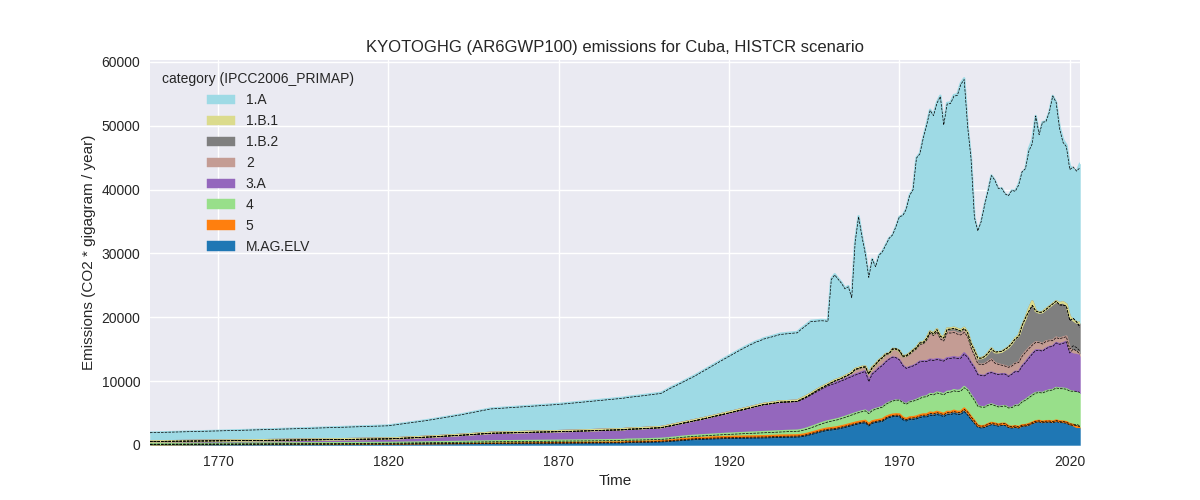
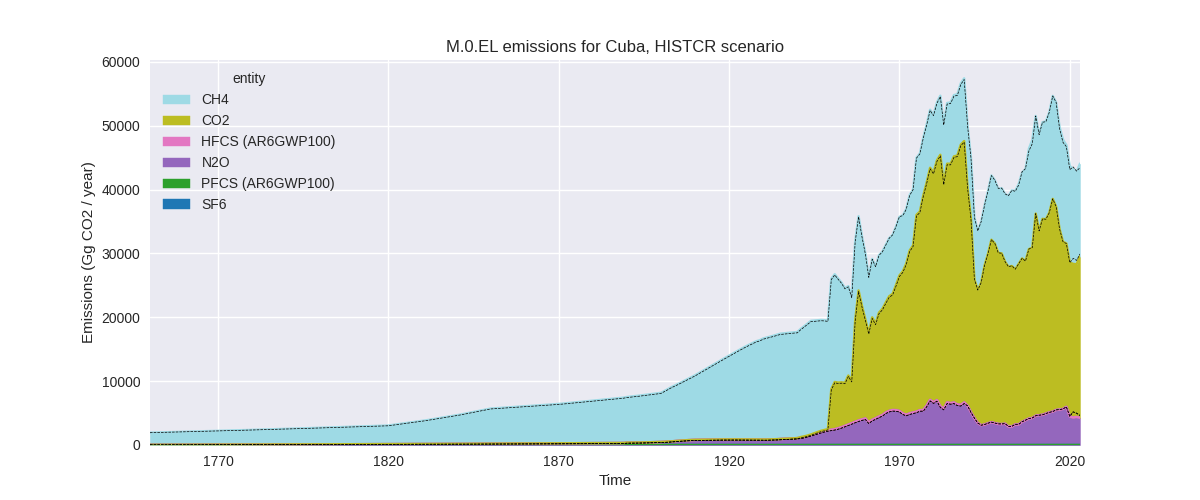
The following figures show the aggregate national total emissions excluding LULUCF AR6GWP100 for the country reported priority scenario. The dotted linesshow the v2.6_final data.
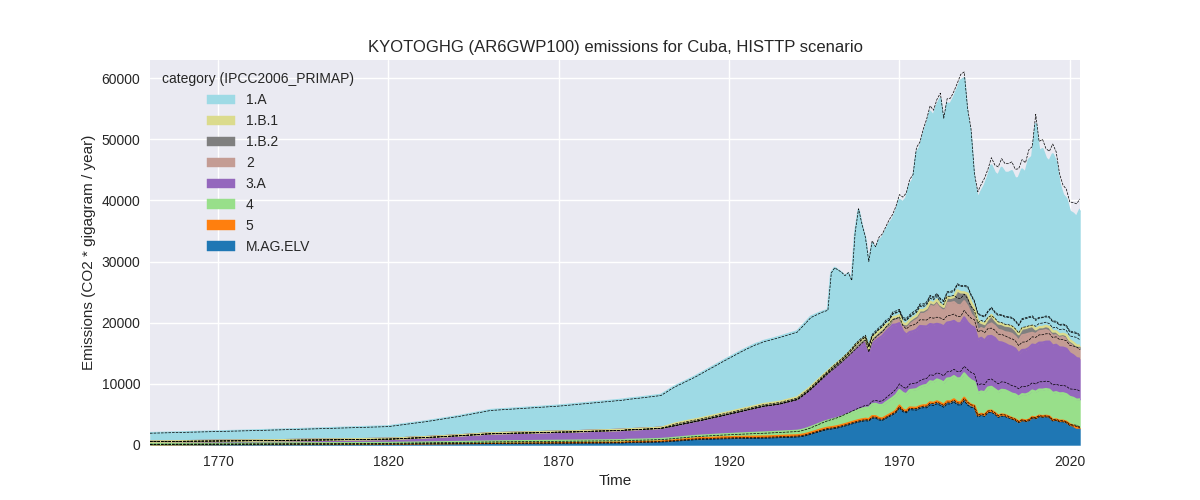
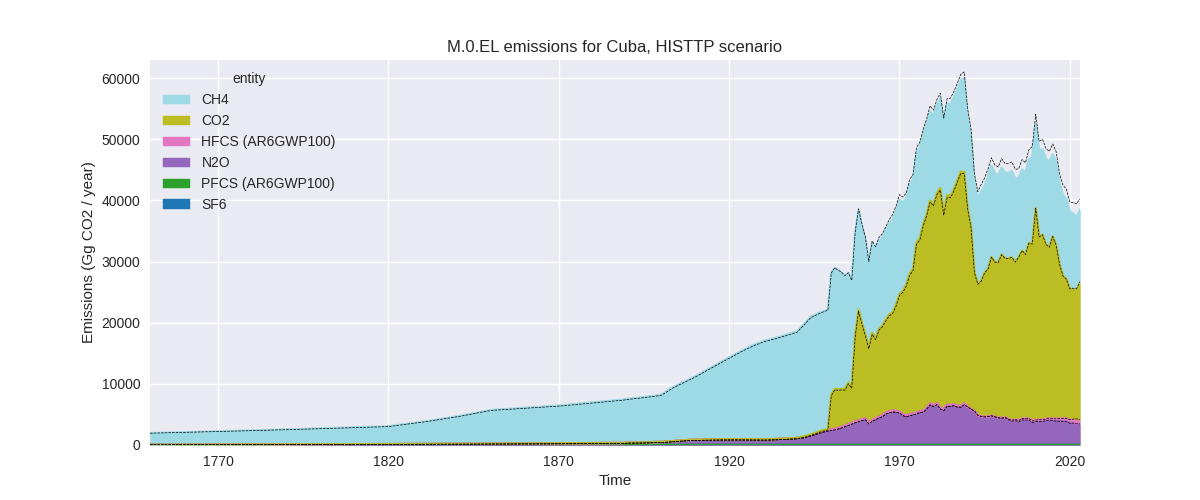
The following figures show the aggregate national total emissions excluding LULUCF AR6GWP100 for the third party priority scenario. The dotted linesshow the v2.6_final data.
Overview over changes
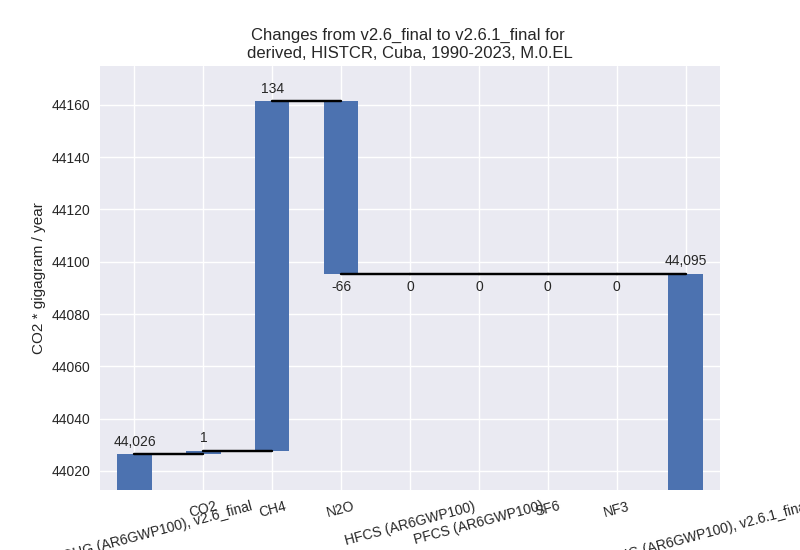
In the country reported priority scenario we have the following changes for aggregate Kyoto GHG and national total emissions excluding LULUCF (M.0.EL):
- Emissions in 2023 have changed by 1.5%% (634.23 Gg CO2 / year)
- Emissions in 1990-2023 have changed by 0.2%% (69.01 Gg CO2 / year)
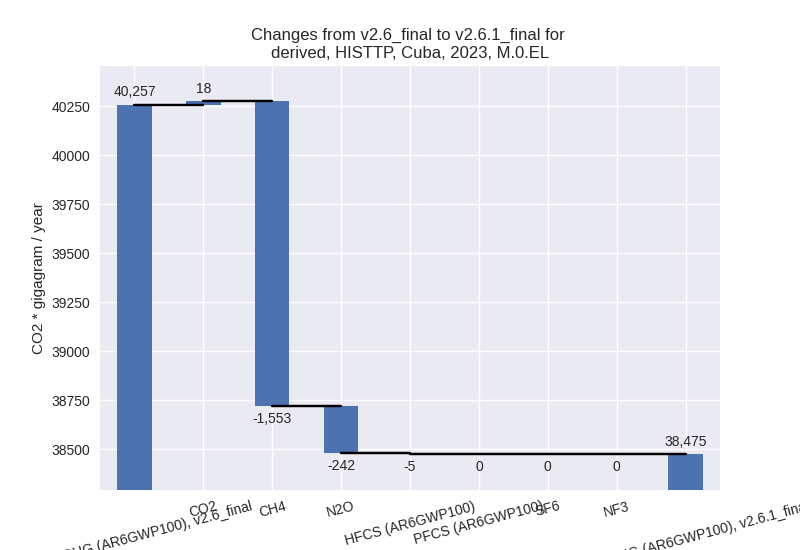
In the third party priority scenario we have the following changes for aggregate Kyoto GHG and national total emissions excluding LULUCF (M.0.EL):
- Emissions in 2023 have changed by -4.4%% (-1782.40 Gg CO2 / year)
- Emissions in 1990-2023 have changed by -3.4%% (-1542.64 Gg CO2 / year)
Most important changes per scenario and time frame
In the country reported priority scenario the following sector-gas combinations have the highest absolute impact on national total KyotoGHG (AR6GWP100) emissions in 2023 (top 5):
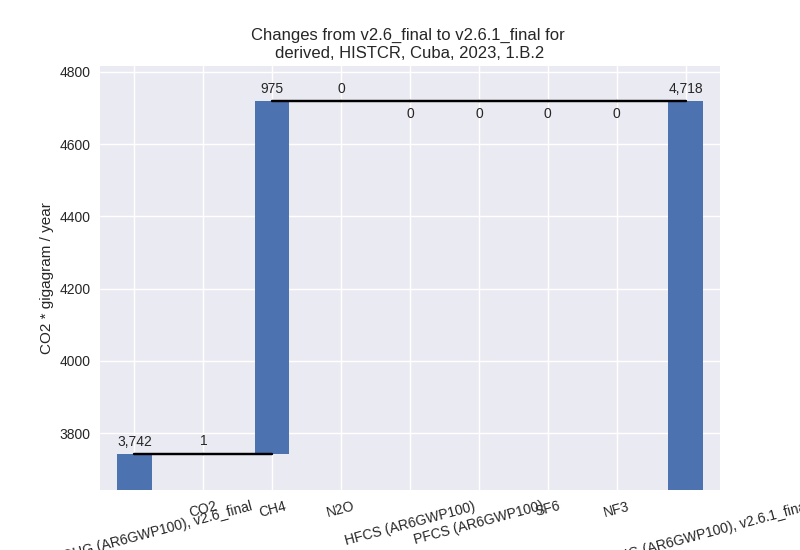
- 1: 1.B.2, CH4 with 975.28 Gg CO2 / year (26.2%)
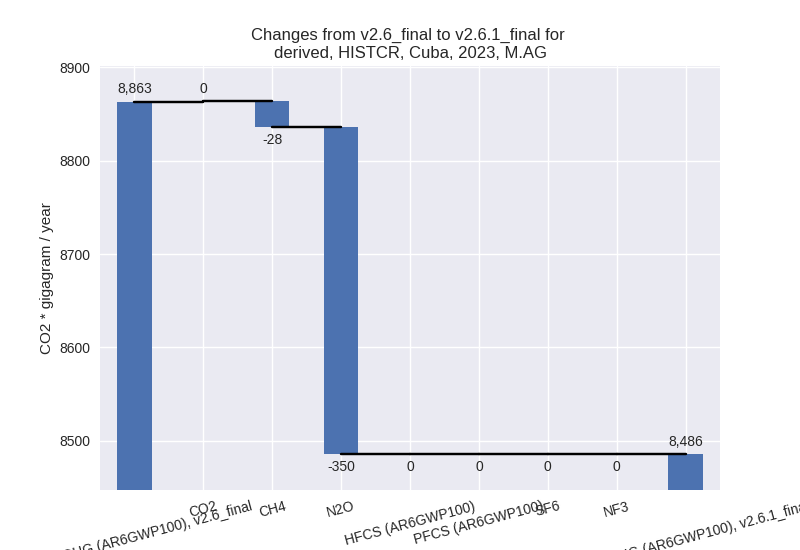
- 2: M.AG.ELV, N2O with -247.88 Gg CO2 / year (-9.2%)
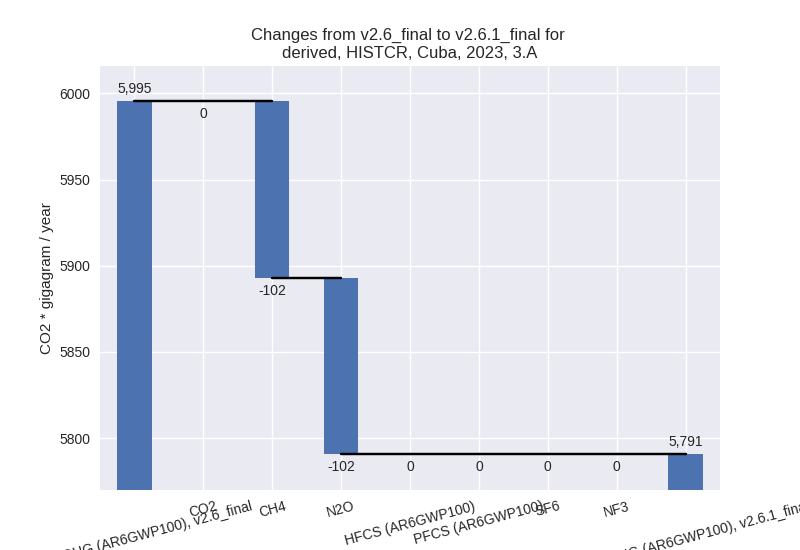
- 3: 3.A, CH4 with -102.46 Gg CO2 / year (-2.3%)
- 4: 3.A, N2O with -102.34 Gg CO2 / year (-7.0%)
- 5: M.AG.ELV, CH4 with 74.61 Gg CO2 / year (46.2%)
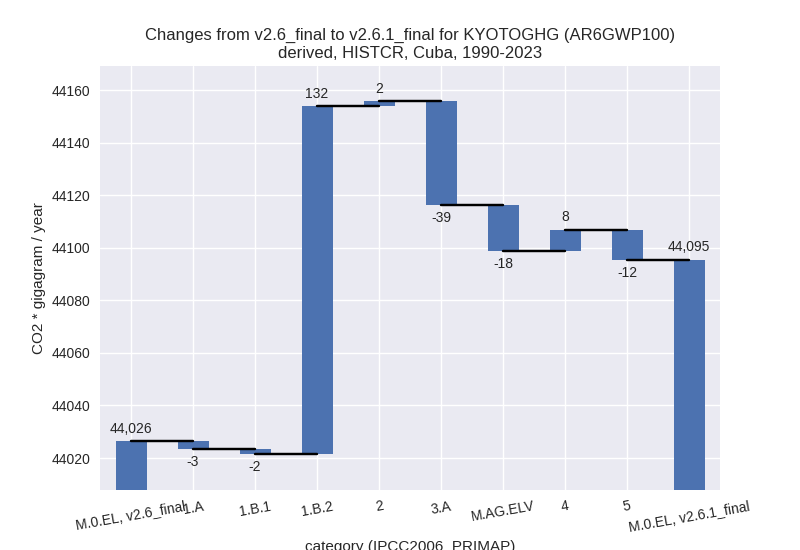
In the country reported priority scenario the following sector-gas combinations have the highest absolute impact on national total KyotoGHG (AR6GWP100) emissions in 1990-2023 (top 5):
- 1: 1.B.2, CH4 with 132.89 Gg CO2 / year (3.8%)
- 2: 3.A, N2O with -32.65 Gg CO2 / year (-4.1%)
- 3: M.AG.ELV, N2O with -18.42 Gg CO2 / year (-0.7%)
- 4: 5, N2O with -11.52 Gg CO2 / year (-5.1%)
- 5: 4, CH4 with 7.88 Gg CO2 / year (0.2%)
In the third party priority scenario the following sector-gas combinations have the highest absolute impact on national total KyotoGHG (AR6GWP100) emissions in 2023 (top 5):
- 1: 4, CH4 with -1296.73 Gg CO2 / year (-22.7%)
- 2: M.AG.ELV, N2O with -221.79 Gg CO2 / year (-9.2%)
- 3: 1.B.2, CH4 with -186.63 Gg CO2 / year (-38.2%)
- 4: M.AG.ELV, CH4 with 156.69 Gg CO2 / year (46.2%)
- 5: 3.A, CH4 with -150.89 Gg CO2 / year (-2.3%)
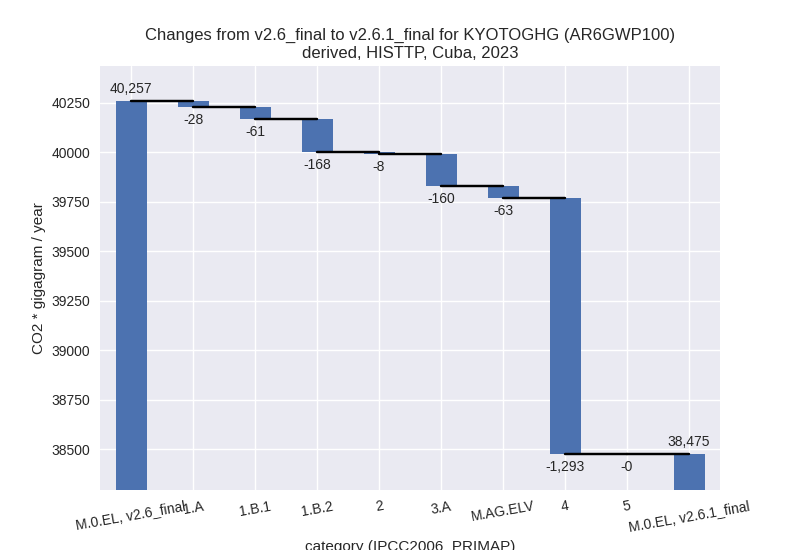
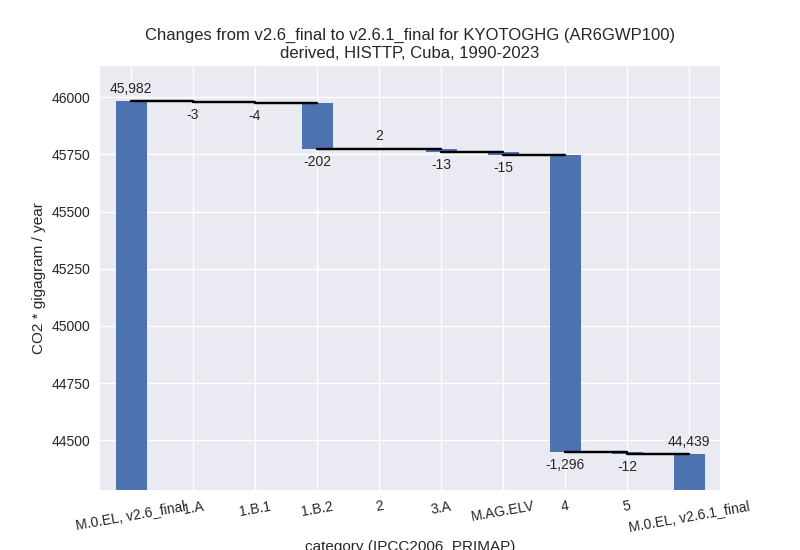
In the third party priority scenario the following sector-gas combinations have the highest absolute impact on national total KyotoGHG (AR6GWP100) emissions in 1990-2023 (top 5):
- 1: 4, CH4 with -1296.23 Gg CO2 / year (-24.5%)
- 2: 1.B.2, CH4 with -222.53 Gg CO2 / year (-28.0%)
- 3: 1.B.2, CO2 with 20.37 Gg CO2 / year (8.3%)
- 4: M.AG.ELV, N2O with -16.34 Gg CO2 / year (-0.6%)
- 5: 5, N2O with -11.52 Gg CO2 / year (-5.1%)
Notes on data changes
Here we list notes explaining important emissions changes for the country.
- No new country reported data has been included. Aggregate changes in the CR time-series are small. Individual sector changes come from updated third party data (EDGAR, FAO) which is used to extrapolate the country reported data.
- In the TP scenario the main change is for waste CH4 and due to updated EDGAR data. Changes in fugitive emissions and N2O in M.AG.ELV come directly from EDGAR and FAO data as well.
Changes by sector and gas
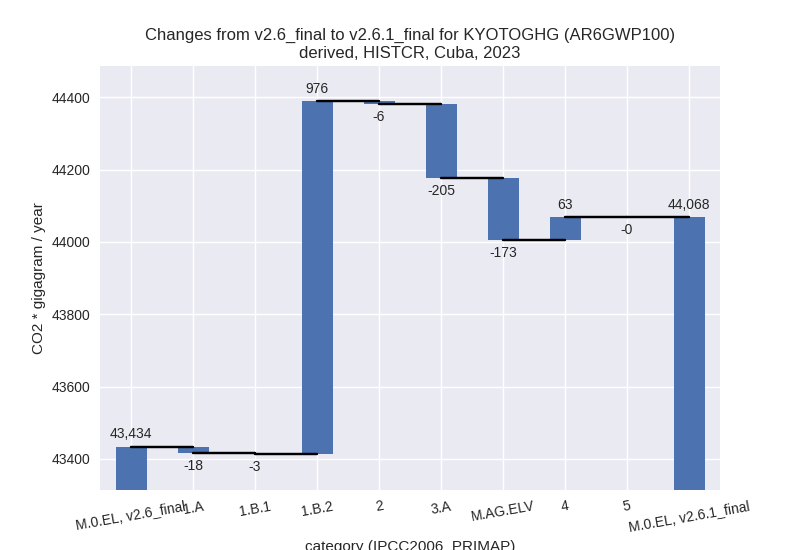
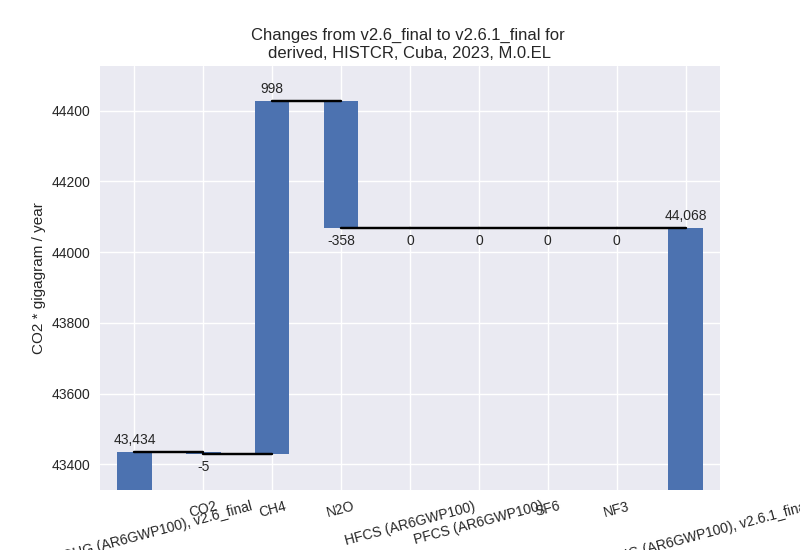
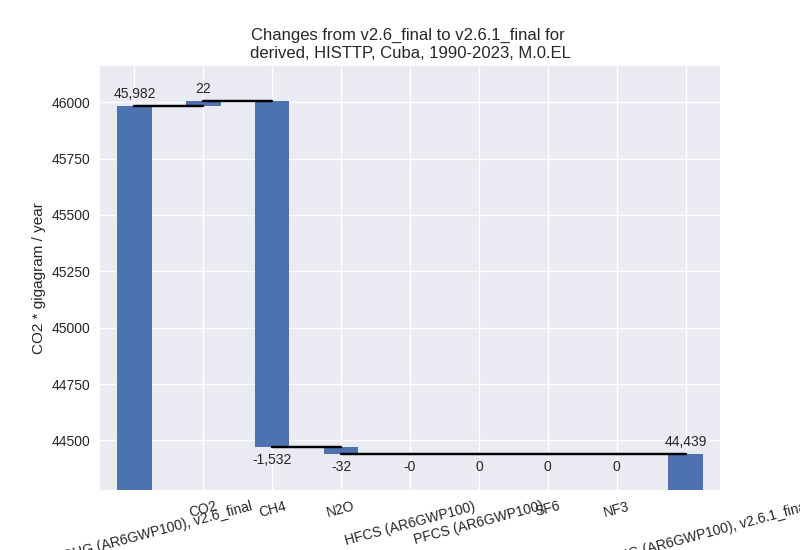
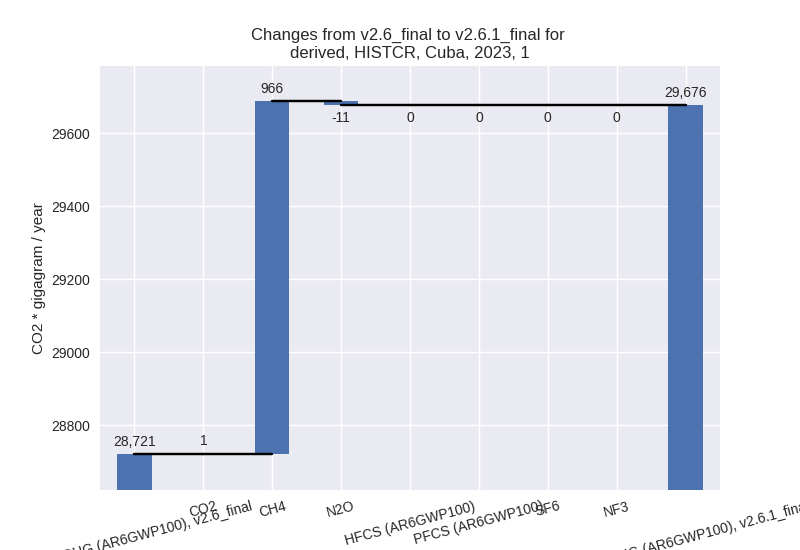
For each scenario and time frame the changes are displayed for all individual sectors and all individual gases. In the sector plot we use aggregate Kyoto GHGs in AR6GWP100. In the gas plot we usenational total emissions without LULUCF.
country reported scenario
2023
1990-2023
third party scenario
2023
1990-2023
Detailed changes for the scenarios:
country reported scenario (HISTCR):
Most important changes per time frame
For 2023 the following sector-gas combinations have the highest absolute impact on national total KyotoGHG (AR6GWP100) emissions in 2023 (top 5):
- 1: 1.B.2, CH4 with 975.28 Gg CO2 / year (26.2%)
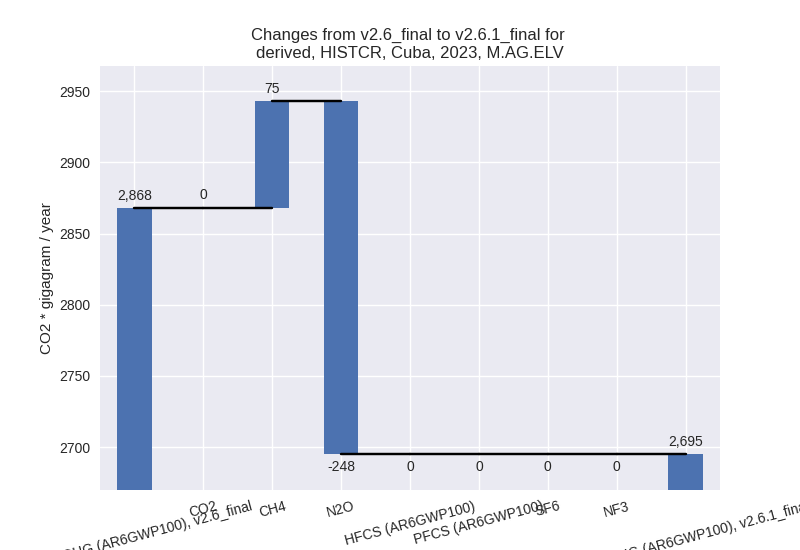
- 2: M.AG.ELV, N2O with -247.88 Gg CO2 / year (-9.2%)
- 3: 3.A, CH4 with -102.46 Gg CO2 / year (-2.3%)
- 4: 3.A, N2O with -102.34 Gg CO2 / year (-7.0%)
- 5: M.AG.ELV, CH4 with 74.61 Gg CO2 / year (46.2%)
For 1990-2023 the following sector-gas combinations have the highest absolute impact on national total KyotoGHG (AR6GWP100) emissions in 1990-2023 (top 5):
- 1: 1.B.2, CH4 with 132.89 Gg CO2 / year (3.8%)
- 2: 3.A, N2O with -32.65 Gg CO2 / year (-4.1%)
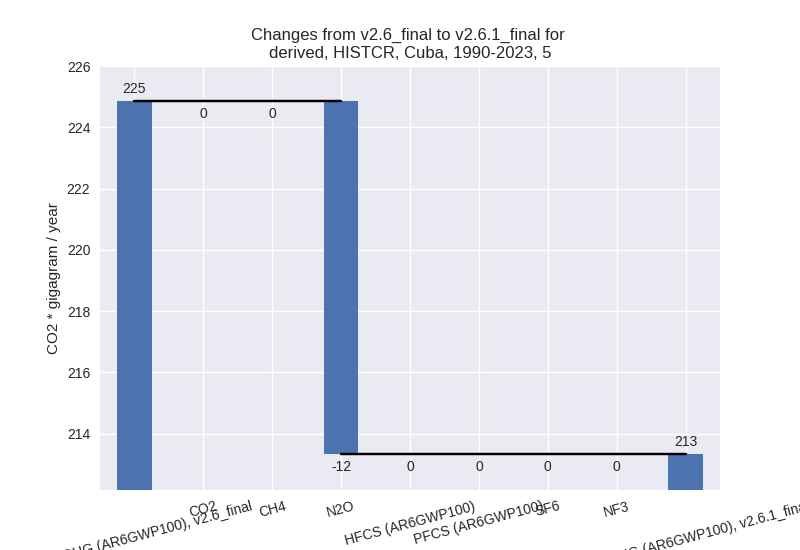
- 3: M.AG.ELV, N2O with -18.42 Gg CO2 / year (-0.7%)
- 4: 5, N2O with -11.52 Gg CO2 / year (-5.1%)
- 5: 4, CH4 with 7.88 Gg CO2 / year (0.2%)
Changes in the main sectors for aggregate KyotoGHG (AR6GWP100) are
- 1: Total sectoral emissions in 2022 are 28196.88 Gg
CO2 / year which is 65.9% of M.0.EL emissions. 2023 Emissions have
changed by 3.3% (955.39 Gg CO2 /
year). 1990-2023 Emissions have changed by 0.4% (127.48 Gg CO2 / year). For 2023 the
changes per gas
are:
The changes come from the following subsectors:- 1.A: Total sectoral emissions in 2022 are 23576.00 Gg CO2 / year which is 83.6% of category 1 emissions. 2023 Emissions have changed by -0.1% (-18.09 Gg CO2 / year). 1990-2023 Emissions have changed by -0.0% (-2.82 Gg CO2 / year).
- 1.B.1: Total sectoral emissions in 2022 are 0.00 Gg
CO2 / year which is 0.0% of category 1 emissions. 2023 Emissions have
changed by -100.0% (-2.75 Gg CO2 /
year). 1990-2023 Emissions have changed by -100.0% (-2.11 Gg CO2 / year). For 2023
the changes per gas
are:
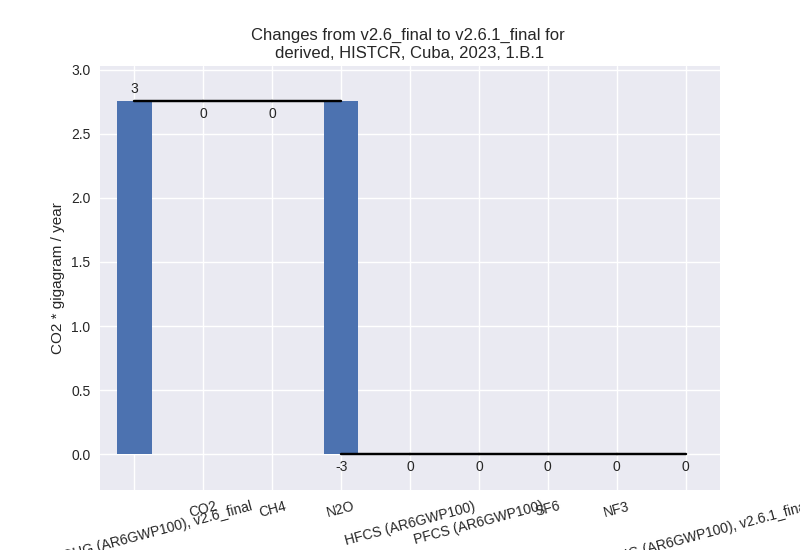
For 1990-2023 the changes per gas are:
There is no subsector information available in PRIMAP-hist. - 1.B.2: Total sectoral emissions in 2022 are 4620.88
Gg CO2 / year which is 16.4% of category 1 emissions. 2023 Emissions
have changed by 26.1% (976.23 Gg CO2
/ year). 1990-2023 Emissions have changed by 3.7% (132.41 Gg CO2 / year). For 2023 the
changes per gas
are:
For 1990-2023 the changes per gas are: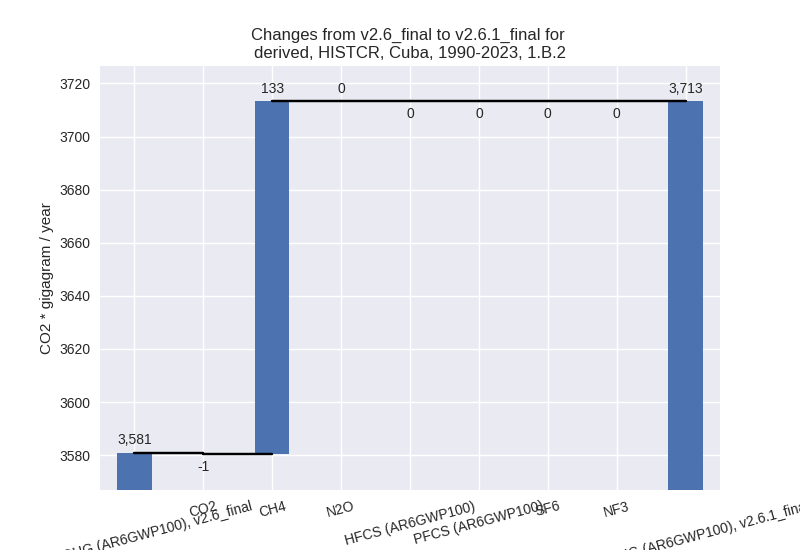
There is no subsector information available in PRIMAP-hist.
- 2: Total sectoral emissions in 2022 are 485.19 Gg CO2 / year which is 1.1% of M.0.EL emissions. 2023 Emissions have changed by -1.3% (-6.30 Gg CO2 / year). 1990-2023 Emissions have changed by 0.1% (1.86 Gg CO2 / year).
- M.AG: Total sectoral emissions in 2022 are 8707.37
Gg CO2 / year which is 20.4% of M.0.EL emissions. 2023 Emissions have
changed by -4.3% (-377.68 Gg CO2 /
year). 1990-2023 Emissions have changed by -0.6% (-57.09 Gg CO2 / year). For 2023 the
changes per gas
are:
The changes come from the following subsectors:- 3.A: Total sectoral emissions in 2022 are 5994.99
Gg CO2 / year which is 68.8% of category M.AG emissions. 2023 Emissions
have changed by -3.4% (-204.80 Gg
CO2 / year). 1990-2023 Emissions have changed by -0.7% (-39.42 Gg CO2 / year). For 2023 the
changes per gas
are:
There is no subsector information available in PRIMAP-hist. - M.AG.ELV: Total sectoral emissions in 2022 are
2712.39 Gg CO2 / year which is 31.2% of category M.AG emissions. 2023
Emissions have changed by -6.0%
(-172.88 Gg CO2 / year). 1990-2023 Emissions have changed by -0.6% (-17.67 Gg CO2 / year). For 2023 the
changes per gas
are:
There is no subsector information available in PRIMAP-hist.
- 3.A: Total sectoral emissions in 2022 are 5994.99
Gg CO2 / year which is 68.8% of category M.AG emissions. 2023 Emissions
have changed by -3.4% (-204.80 Gg
CO2 / year). 1990-2023 Emissions have changed by -0.7% (-39.42 Gg CO2 / year). For 2023 the
changes per gas
are:
- 4: Total sectoral emissions in 2022 are 5238.17 Gg CO2 / year which is 12.2% of M.0.EL emissions. 2023 Emissions have changed by 1.2% (62.90 Gg CO2 / year). 1990-2023 Emissions have changed by 0.2% (8.28 Gg CO2 / year).
- 5: Total sectoral emissions in 2022 are 139.60 Gg
CO2 / year which is 0.3% of M.0.EL emissions. 2023 Emissions have
changed by -0.1% (-0.08 Gg CO2 /
year). 1990-2023 Emissions have changed by -5.1% (-11.52 Gg CO2 / year). For
1990-2023 the changes per gas
are:
third party scenario (HISTTP):
Most important changes per time frame
For 2023 the following sector-gas combinations have the highest absolute impact on national total KyotoGHG (AR6GWP100) emissions in 2023 (top 5):
- 1: 4, CH4 with -1296.73 Gg CO2 / year (-22.7%)
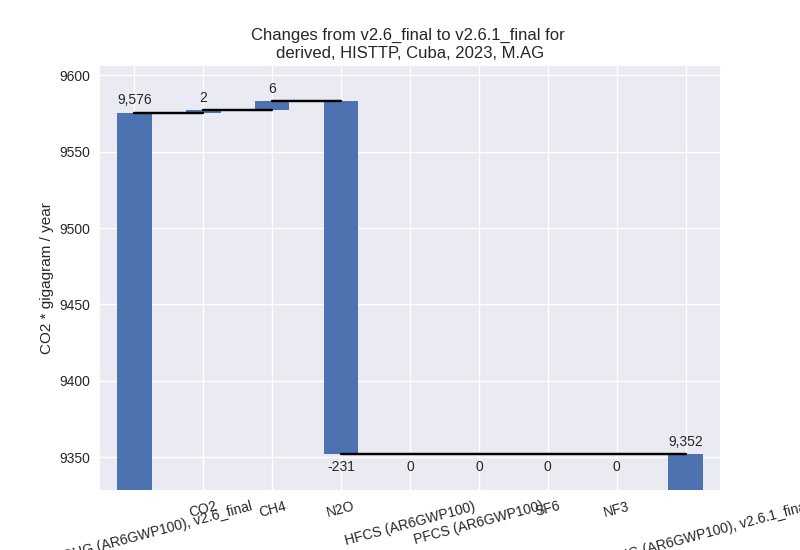
- 2: M.AG.ELV, N2O with -221.79 Gg CO2 / year (-9.2%)
- 3: 1.B.2, CH4 with -186.63 Gg CO2 / year (-38.2%)
- 4: M.AG.ELV, CH4 with 156.69 Gg CO2 / year (46.2%)
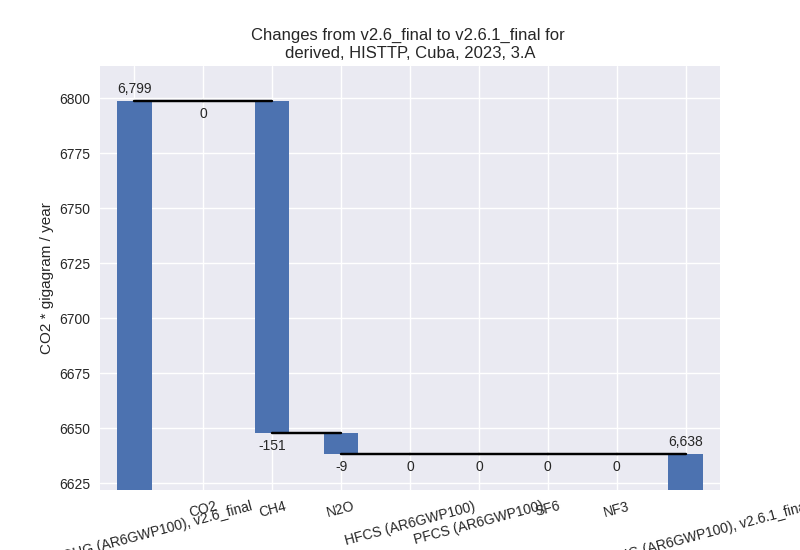
- 5: 3.A, CH4 with -150.89 Gg CO2 / year (-2.3%)
For 1990-2023 the following sector-gas combinations have the highest absolute impact on national total KyotoGHG (AR6GWP100) emissions in 1990-2023 (top 5):
- 1: 4, CH4 with -1296.23 Gg CO2 / year (-24.5%)
- 2: 1.B.2, CH4 with -222.53 Gg CO2 / year (-28.0%)
- 3: 1.B.2, CO2 with 20.37 Gg CO2 / year (8.3%)
- 4: M.AG.ELV, N2O with -16.34 Gg CO2 / year (-0.6%)
- 5: 5, N2O with -11.52 Gg CO2 / year (-5.1%)
Changes in the main sectors for aggregate KyotoGHG (AR6GWP100) are
- 1: Total sectoral emissions in 2022 are 21535.54 Gg CO2 / year which is 57.8% of M.0.EL emissions. 2023 Emissions have changed by -1.1% (-257.61 Gg CO2 / year). 1990-2023 Emissions have changed by -0.8% (-209.30 Gg CO2 / year).
- 2: Total sectoral emissions in 2022 are 1539.11 Gg CO2 / year which is 4.1% of M.0.EL emissions. 2023 Emissions have changed by -0.5% (-7.73 Gg CO2 / year). 1990-2023 Emissions have changed by 0.1% (1.69 Gg CO2 / year).
- M.AG: Total sectoral emissions in 2022 are 9493.73
Gg CO2 / year which is 25.5% of M.0.EL emissions. 2023 Emissions have
changed by -2.3% (-223.71 Gg CO2 /
year). 1990-2023 Emissions have changed by -0.2% (-27.69 Gg CO2 / year). For 2023 the
changes per gas
are:
The changes come from the following subsectors:- 3.A: Total sectoral emissions in 2022 are 6784.40
Gg CO2 / year which is 71.5% of category M.AG emissions. 2023 Emissions
have changed by -2.4% (-160.31 Gg
CO2 / year). 1990-2023 Emissions have changed by -0.2% (-12.97 Gg CO2 / year). For 2023 the
changes per gas
are:
There is no subsector information available in PRIMAP-hist. - M.AG.ELV: Total sectoral emissions in 2022 are
2709.33 Gg CO2 / year which is 28.5% of category M.AG emissions. 2023
Emissions have changed by -2.3%
(-63.41 Gg CO2 / year). 1990-2023 Emissions have changed by -0.3% (-14.71 Gg CO2 / year). For 2023 the
changes per gas
are:
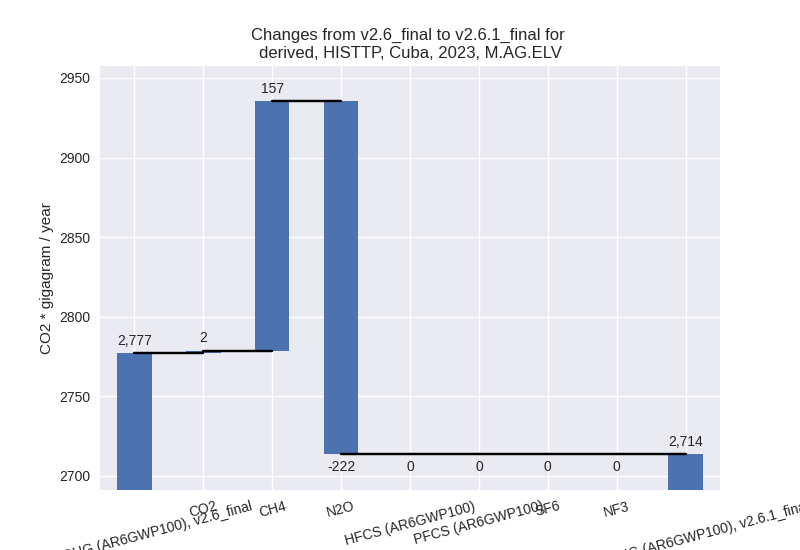
There is no subsector information available in PRIMAP-hist.
- 3.A: Total sectoral emissions in 2022 are 6784.40
Gg CO2 / year which is 71.5% of category M.AG emissions. 2023 Emissions
have changed by -2.4% (-160.31 Gg
CO2 / year). 1990-2023 Emissions have changed by -0.2% (-12.97 Gg CO2 / year). For 2023 the
changes per gas
are:
- 4: Total sectoral emissions in 2022 are 4555.29 Gg
CO2 / year which is 12.2% of M.0.EL emissions. 2023 Emissions have
changed by -22.0% (-1293.26 Gg CO2 /
year). 1990-2023 Emissions have changed by -23.7% (-1295.83 Gg CO2 / year). For 2023
the changes per gas
are:
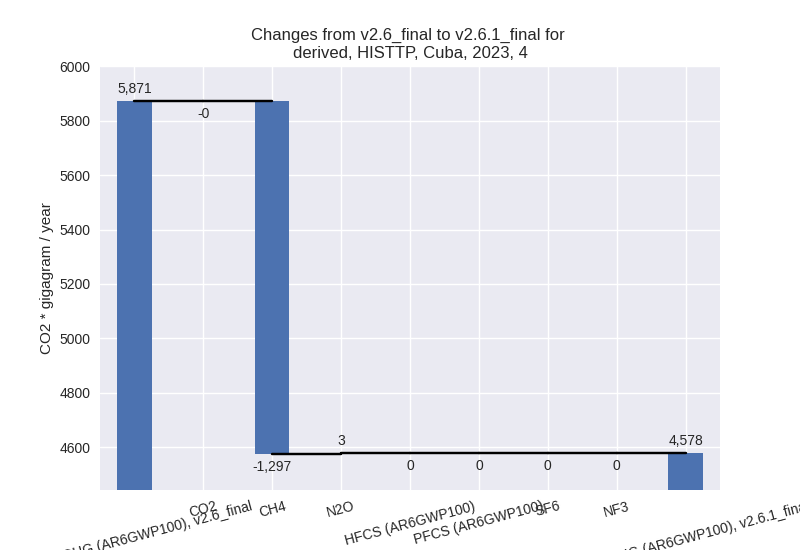
For 1990-2023 the changes per gas are:
- 5: Total sectoral emissions in 2022 are 139.60 Gg
CO2 / year which is 0.4% of M.0.EL emissions. 2023 Emissions have
changed by -0.1% (-0.08 Gg CO2 /
year). 1990-2023 Emissions have changed by -5.1% (-11.52 Gg CO2 / year). For
1990-2023 the changes per gas
are:
