Changes in PRIMAP-hist v2.6.1_final compared to v2.6_final for Czechia
2025-03-19
Johannes Gütschow
Change analysis for Czechia for PRIMAP-hist v2.6.1_final compared to v2.6_final
Overview over emissions by sector and gas
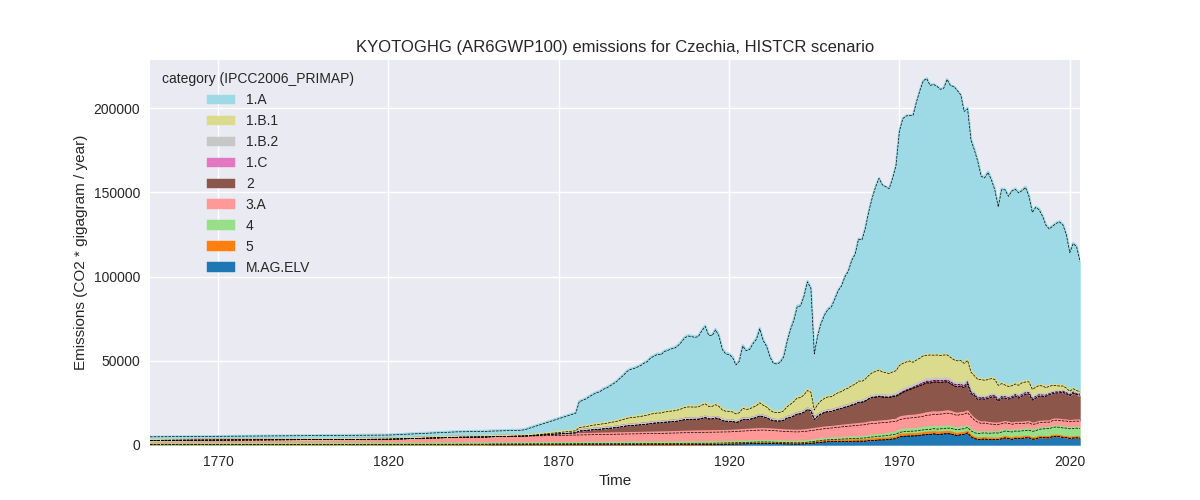
The following figures show the aggregate national total emissions excluding LULUCF AR6GWP100 for the country reported priority scenario. The dotted linesshow the v2.6_final data.

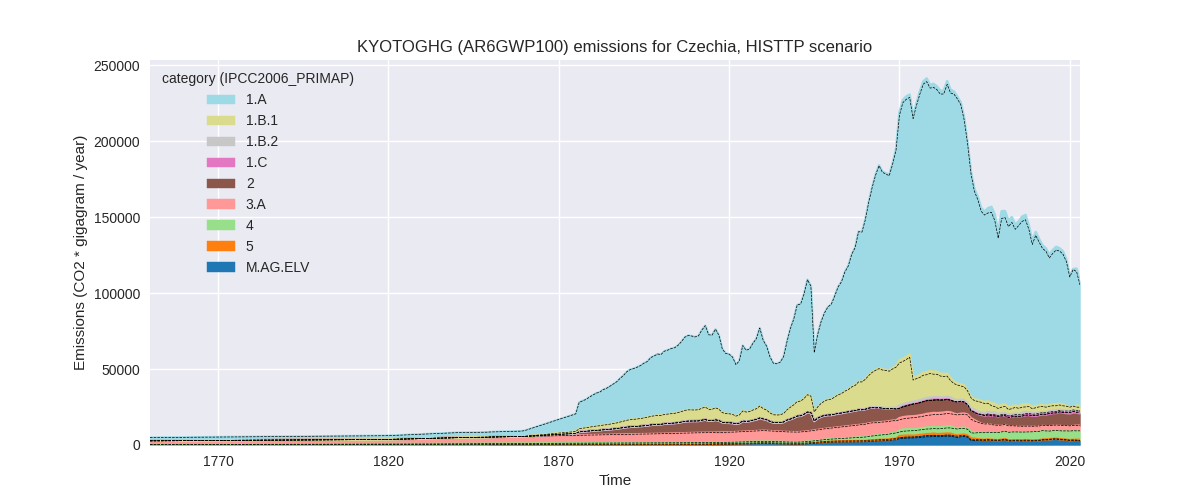
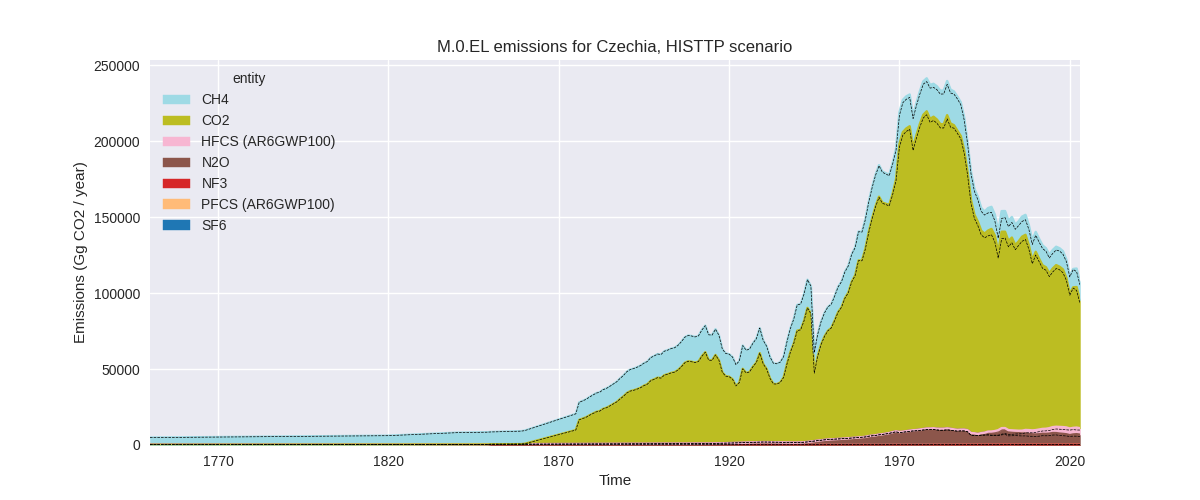
The following figures show the aggregate national total emissions excluding LULUCF AR6GWP100 for the third party priority scenario. The dotted linesshow the v2.6_final data.
Overview over changes
In the country reported priority scenario we have the following changes for aggregate Kyoto GHG and national total emissions excluding LULUCF (M.0.EL):
- Emissions in 2023 have changed by -0.3%% (-274.65 Gg CO2 / year)
- Emissions in 1990-2023 have changed by 0.3%% (393.51 Gg CO2 / year)
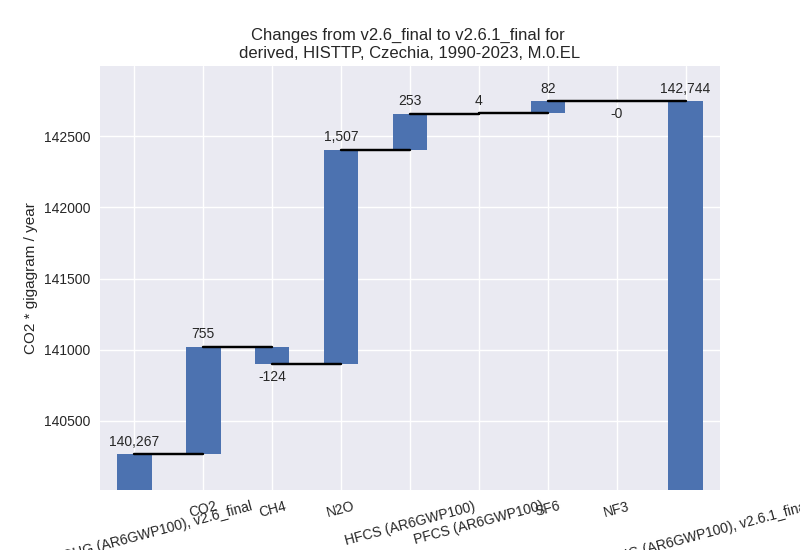
In the third party priority scenario we have the following changes for aggregate Kyoto GHG and national total emissions excluding LULUCF (M.0.EL):
- Emissions in 2023 have changed by 1.6%% (1733.81 Gg CO2 / year)
- Emissions in 1990-2023 have changed by 1.8%% (2477.47 Gg CO2 / year)
Most important changes per scenario and time frame
In the country reported priority scenario the following sector-gas combinations have the highest absolute impact on national total KyotoGHG (AR6GWP100) emissions in 2023 (top 5):
- 1: 2, CO2 with -827.00 Gg CO2 / year (-7.6%)
- 2: 1.B.1, CH4 with 257.02 Gg CO2 / year (18.9%)
- 3: 5, N2O with 236.43 Gg CO2 / year (inf%)
- 4: M.AG.ELV, N2O with 200.05 Gg CO2 / year (5.4%)
- 5: 1.A, CH4 with -77.99 Gg CO2 / year (-6.5%)
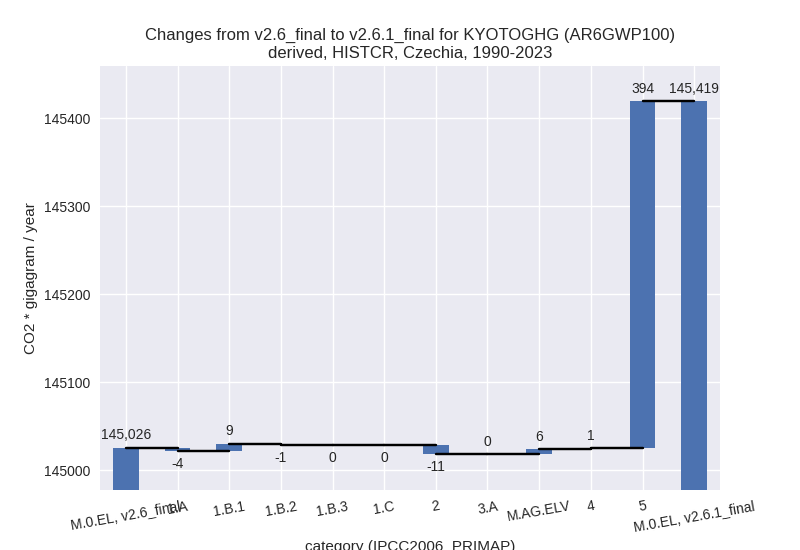
In the country reported priority scenario the following sector-gas combinations have the highest absolute impact on national total KyotoGHG (AR6GWP100) emissions in 1990-2023 (top 5):
- 1: 5, N2O with 394.28 Gg CO2 / year (inf%)
- 2: 2, CO2 with -24.33 Gg CO2 / year (-0.2%)
- 3: 2, HFCS (AR6GWP100) with 14.29 Gg CO2 / year (0.7%)
- 4: 1.B.1, CH4 with 7.56 Gg CO2 / year (0.1%)
- 5: M.AG.ELV, N2O with 5.88 Gg CO2 / year (0.2%)
In the third party priority scenario the following sector-gas combinations have the highest absolute impact on national total KyotoGHG (AR6GWP100) emissions in 2023 (top 5):
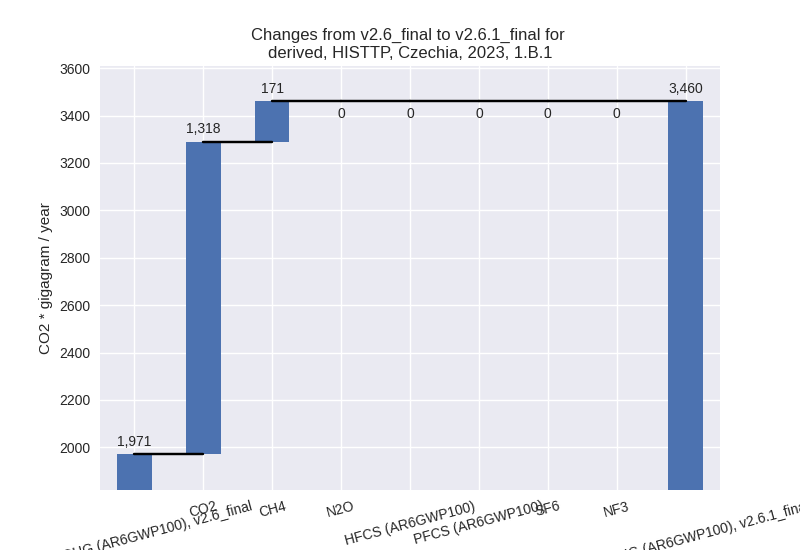
- 1: 1.B.1, CO2 with 1317.89 Gg CO2 / year (132.4%)
- 2: 2, CO2 with -1078.05 Gg CO2 / year (-28.7%)
- 3: 1.A, N2O with 881.13 Gg CO2 / year (85.6%)
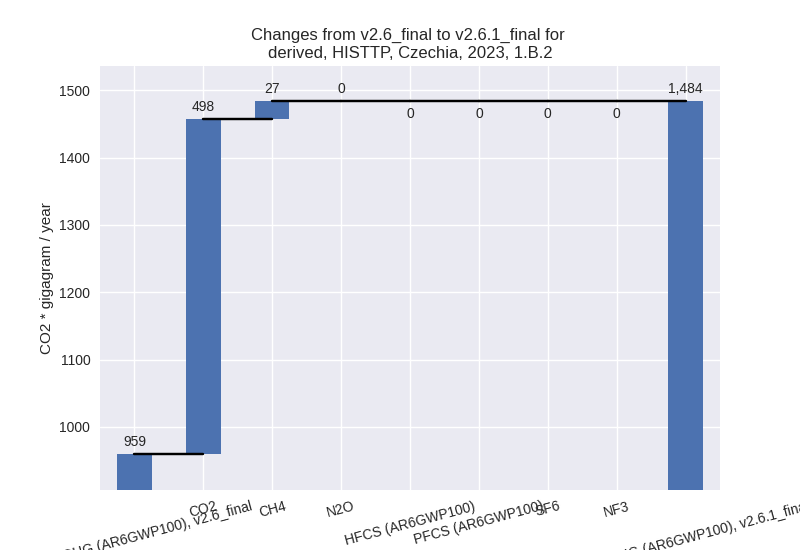
- 4: 1.B.2, CO2 with 498.09 Gg CO2 / year (inf%)
- 5: 4, CH4 with -479.22 Gg CO2 / year (-8.1%)
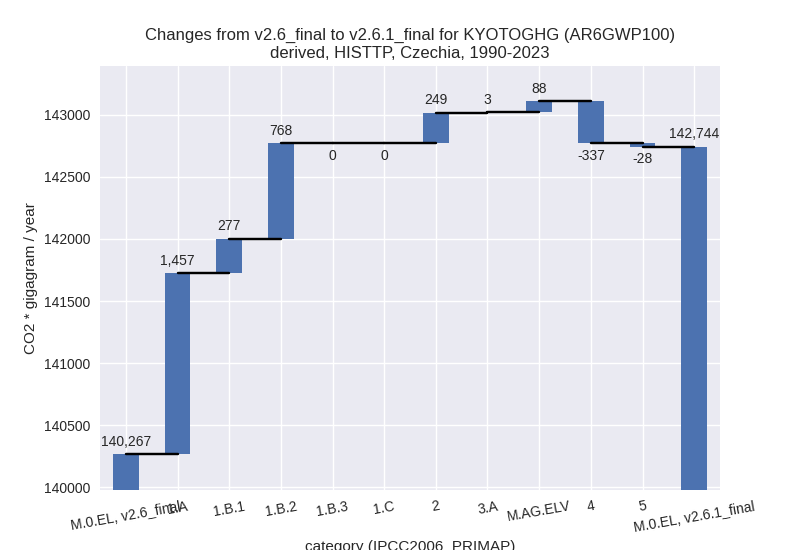
In the third party priority scenario the following sector-gas combinations have the highest absolute impact on national total KyotoGHG (AR6GWP100) emissions in 1990-2023 (top 5):
- 1: 1.A, N2O with 1493.10 Gg CO2 / year (119.7%)
- 2: 1.B.2, CO2 with 763.95 Gg CO2 / year (97332.0%)
- 3: 4, CH4 with -336.66 Gg CO2 / year (-6.7%)
- 4: 2, HFCS (AR6GWP100) with 252.82 Gg CO2 / year (13.0%)
- 5: 1.B.1, CH4 with 241.37 Gg CO2 / year (9.5%)
Notes on data changes
Here we list notes explaining important emissions changes for the country.
- CRT data has been included but replaces official data reported to
the EU which does not show noteworthy differences. Changes in the CR
time-series are small and come from updated third party data (EDGAR,
FAO, Andrew cement) which is used to extrapolate the country reported
data.
- Emissions in sector 5 are in the CR scenario now non-zero because the CRT submissions leave the sector empty while in CRF data used before it was zero. As the sector is missing in country reported data it is filled from EDGAR data.
- Changes in the TP time-series come from updated EDGAR and Andrew cement data. Andrew cement has adjusted data for the latest years while EDGAR has updated full time-series.
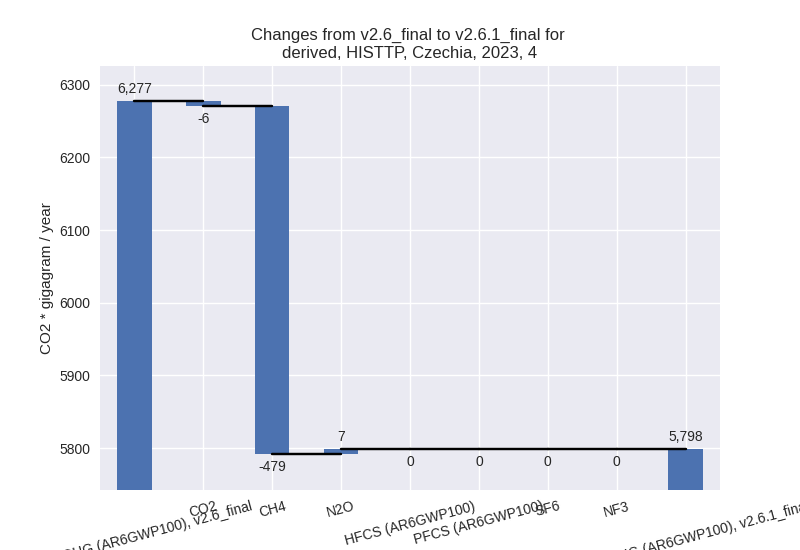
Changes by sector and gas
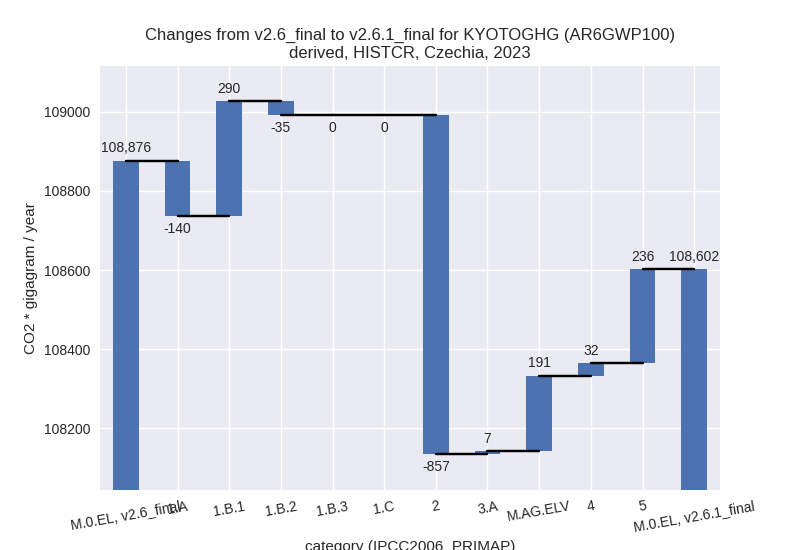
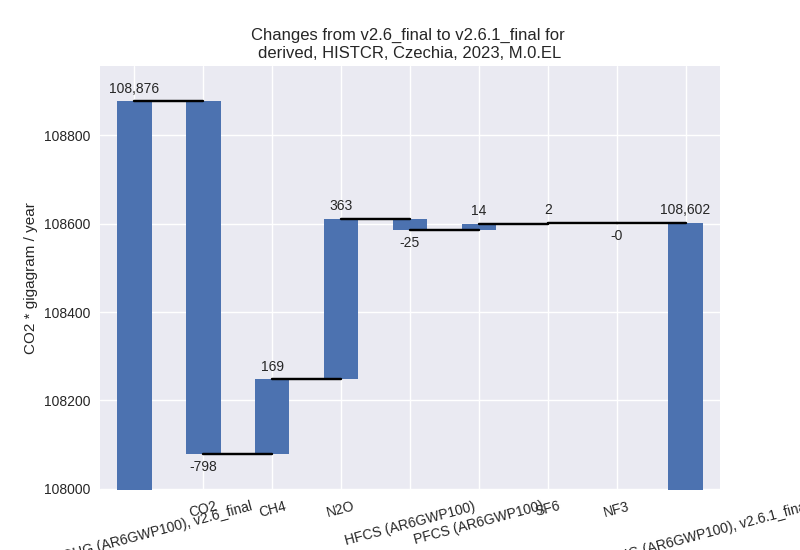
For each scenario and time frame the changes are displayed for all individual sectors and all individual gases. In the sector plot we use aggregate Kyoto GHGs in AR6GWP100. In the gas plot we usenational total emissions without LULUCF.
country reported scenario
2023
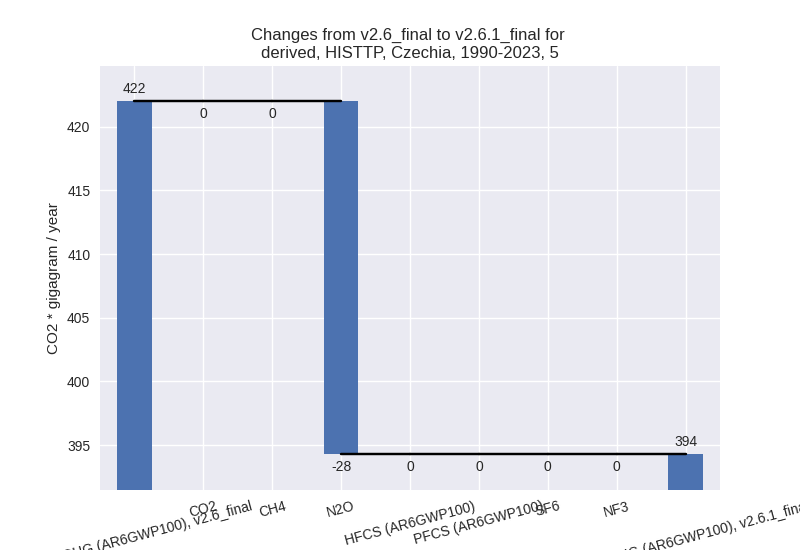
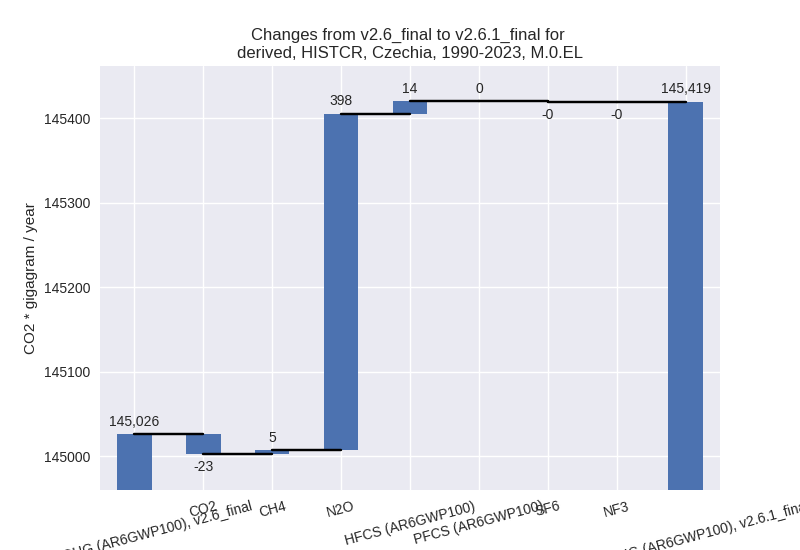
1990-2023
third party scenario
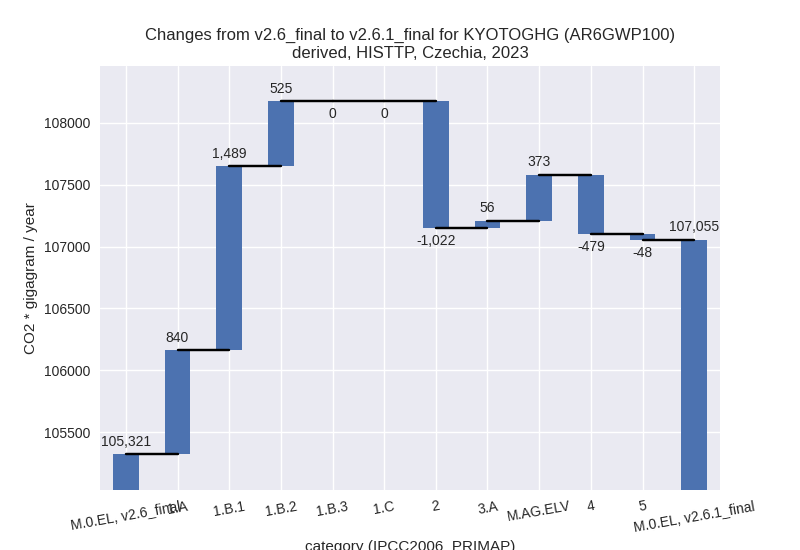
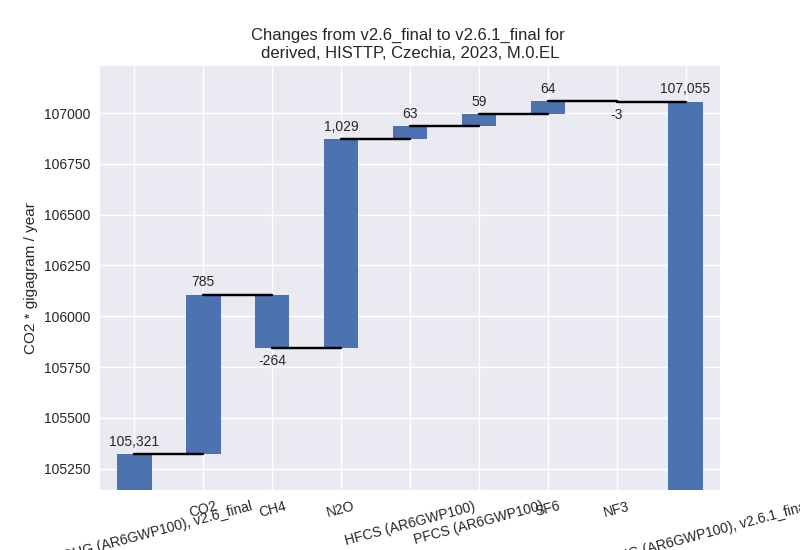
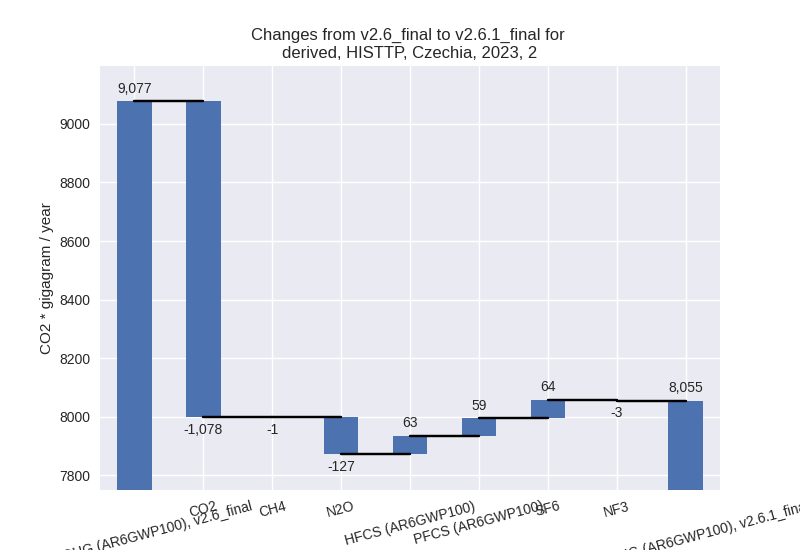
2023
1990-2023
Detailed changes for the scenarios:
country reported scenario (HISTCR):
Most important changes per time frame
For 2023 the following sector-gas combinations have the highest absolute impact on national total KyotoGHG (AR6GWP100) emissions in 2023 (top 5):
- 1: 2, CO2 with -827.00 Gg CO2 / year (-7.6%)
- 2: 1.B.1, CH4 with 257.02 Gg CO2 / year (18.9%)
- 3: 5, N2O with 236.43 Gg CO2 / year (inf%)
- 4: M.AG.ELV, N2O with 200.05 Gg CO2 / year (5.4%)
- 5: 1.A, CH4 with -77.99 Gg CO2 / year (-6.5%)
For 1990-2023 the following sector-gas combinations have the highest absolute impact on national total KyotoGHG (AR6GWP100) emissions in 1990-2023 (top 5):
- 1: 5, N2O with 394.28 Gg CO2 / year (inf%)
- 2: 2, CO2 with -24.33 Gg CO2 / year (-0.2%)
- 3: 2, HFCS (AR6GWP100) with 14.29 Gg CO2 / year (0.7%)
- 4: 1.B.1, CH4 with 7.56 Gg CO2 / year (0.1%)
- 5: M.AG.ELV, N2O with 5.88 Gg CO2 / year (0.2%)
Changes in the main sectors for aggregate KyotoGHG (AR6GWP100) are
- 1: Total sectoral emissions in 2022 are 87911.39 Gg CO2 / year which is 74.4% of M.0.EL emissions. 2023 Emissions have changed by 0.1% (115.12 Gg CO2 / year). 1990-2023 Emissions have changed by 0.0% (3.39 Gg CO2 / year).
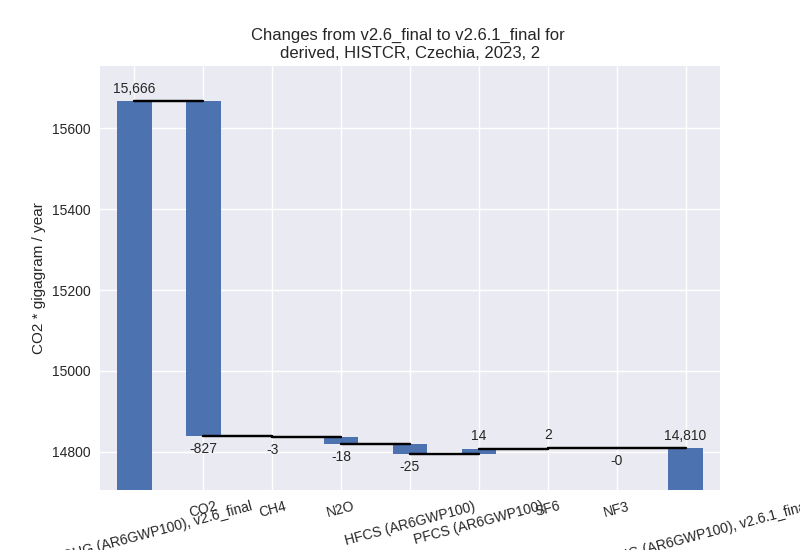
- 2: Total sectoral emissions in 2022 are 15695.54 Gg
CO2 / year which is 13.3% of M.0.EL emissions. 2023 Emissions have
changed by -5.5% (-856.58 Gg CO2 /
year). 1990-2023 Emissions have changed by -0.1% (-10.93 Gg CO2 / year). For 2023 the
changes per gas
are:
- M.AG: Total sectoral emissions in 2022 are 8529.17
Gg CO2 / year which is 7.2% of M.0.EL emissions. 2023 Emissions have
changed by 2.4% (198.46 Gg CO2 /
year). 1990-2023 Emissions have changed by 0.1% (5.84 Gg CO2 / year). For 2023 the
changes per gas
are:
The changes come from the following subsectors:- 3.A: Total sectoral emissions in 2022 are 4238.31 Gg CO2 / year which is 49.7% of category M.AG emissions. 2023 Emissions have changed by 0.2% (7.09 Gg CO2 / year). 1990-2023 Emissions have changed by 0.0% (0.21 Gg CO2 / year).
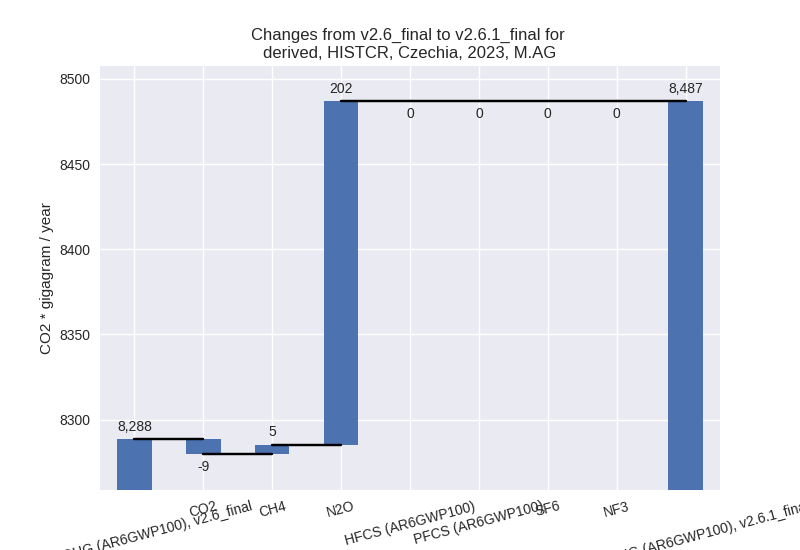
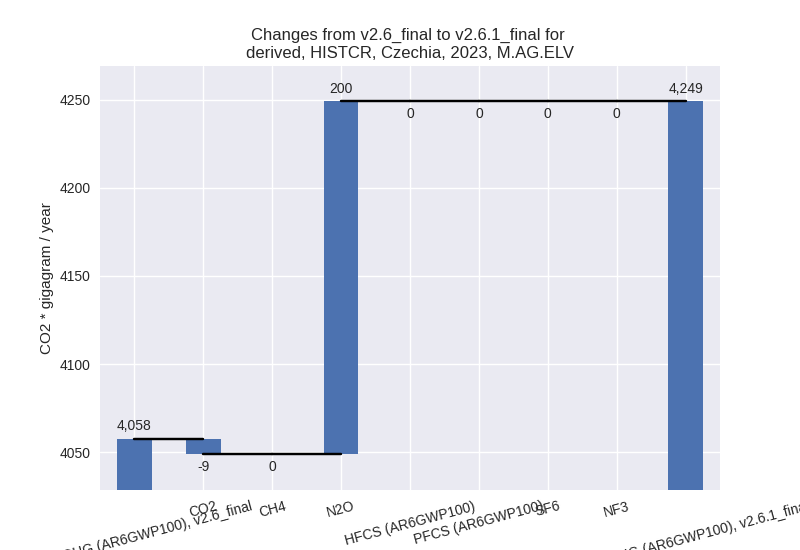
- M.AG.ELV: Total sectoral emissions in 2022 are
4290.86 Gg CO2 / year which is 50.3% of category M.AG emissions. 2023
Emissions have changed by 4.7%
(191.37 Gg CO2 / year). 1990-2023 Emissions have changed by 0.1% (5.63 Gg CO2 / year). For 2023 the
changes per gas
are:
There is no subsector information available in PRIMAP-hist.
- 4: Total sectoral emissions in 2022 are 5690.32 Gg CO2 / year which is 4.8% of M.0.EL emissions. 2023 Emissions have changed by 0.6% (31.93 Gg CO2 / year). 1990-2023 Emissions have changed by 0.0% (0.94 Gg CO2 / year).
- 5: Total sectoral emissions in 2022 are 260.50 Gg
CO2 / year which is 0.2% of M.0.EL emissions. 2023 Emissions have
changed by inf% (236.43 Gg CO2 /
year). 1990-2023 Emissions have changed by inf% (394.28 Gg CO2 / year). For 2023 the
changes per gas
are:

For 1990-2023 the changes per gas are: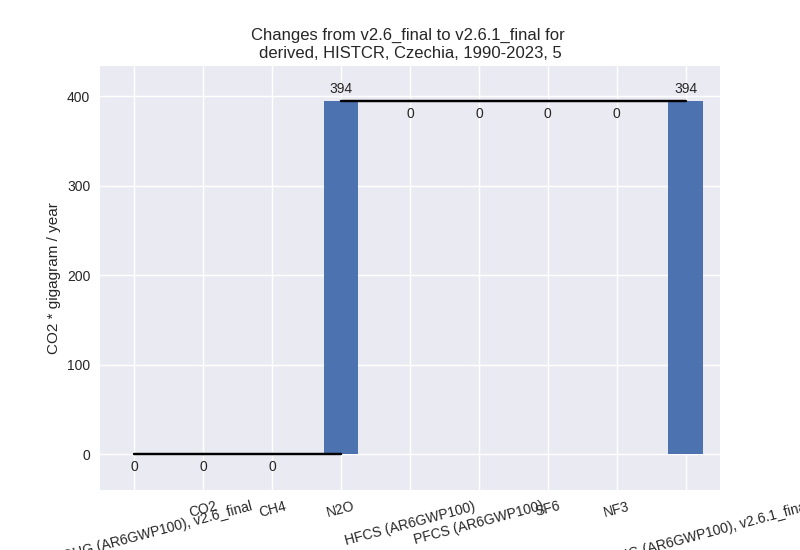
third party scenario (HISTTP):
Most important changes per time frame
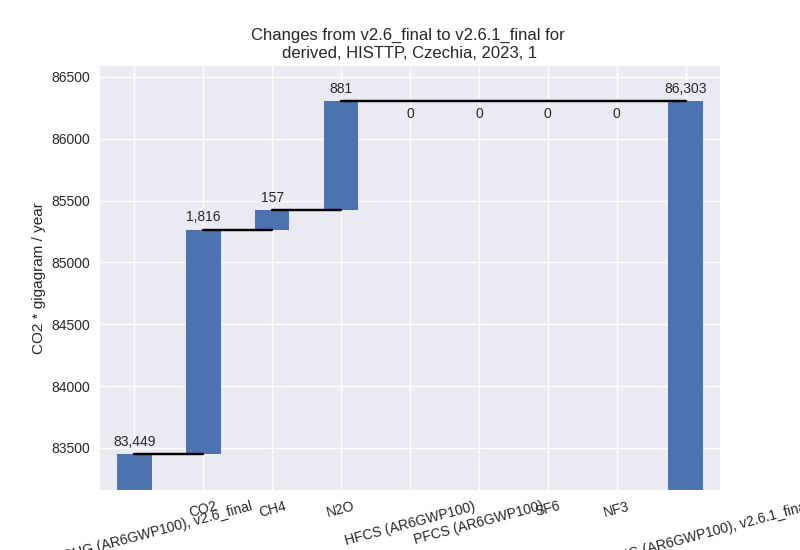
For 2023 the following sector-gas combinations have the highest absolute impact on national total KyotoGHG (AR6GWP100) emissions in 2023 (top 5):
- 1: 1.B.1, CO2 with 1317.89 Gg CO2 / year (132.4%)
- 2: 2, CO2 with -1078.05 Gg CO2 / year (-28.7%)
- 3: 1.A, N2O with 881.13 Gg CO2 / year (85.6%)
- 4: 1.B.2, CO2 with 498.09 Gg CO2 / year (inf%)
- 5: 4, CH4 with -479.22 Gg CO2 / year (-8.1%)
For 1990-2023 the following sector-gas combinations have the highest absolute impact on national total KyotoGHG (AR6GWP100) emissions in 1990-2023 (top 5):
- 1: 1.A, N2O with 1493.10 Gg CO2 / year (119.7%)
- 2: 1.B.2, CO2 with 763.95 Gg CO2 / year (97332.0%)
- 3: 4, CH4 with -336.66 Gg CO2 / year (-6.7%)
- 4: 2, HFCS (AR6GWP100) with 252.82 Gg CO2 / year (13.0%)
- 5: 1.B.1, CH4 with 241.37 Gg CO2 / year (9.5%)
Changes in the main sectors for aggregate KyotoGHG (AR6GWP100) are
- 1: Total sectoral emissions in 2022 are 94833.99 Gg
CO2 / year which is 81.7% of M.0.EL emissions. 2023 Emissions have
changed by 3.4% (2853.95 Gg CO2 /
year). 1990-2023 Emissions have changed by 2.1% (2502.73 Gg CO2 / year). For 2023 the
changes per gas
are:
For 1990-2023 the changes per gas are: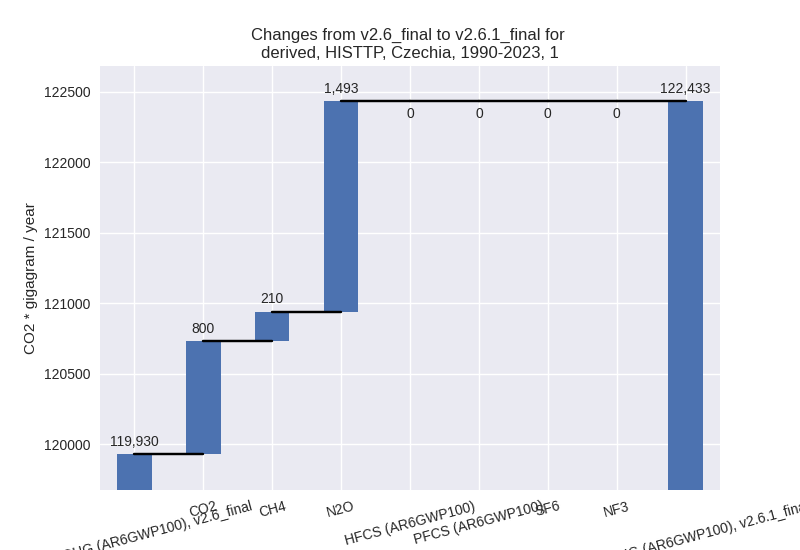
The changes come from the following subsectors:- 1.A: Total sectoral emissions in 2022 are 90190.26 Gg CO2 / year which is 95.1% of category 1 emissions. 2023 Emissions have changed by 1.0% (839.92 Gg CO2 / year). 1990-2023 Emissions have changed by 1.3% (1457.39 Gg CO2 / year).
- 1.B.1: Total sectoral emissions in 2022 are 3169.31
Gg CO2 / year which is 3.3% of category 1 emissions. 2023 Emissions have
changed by 75.6% (1489.27 Gg CO2 /
year). 1990-2023 Emissions have changed by 5.8% (277.37 Gg CO2 / year). For 2023 the
changes per gas
are:
For 1990-2023 the changes per gas are: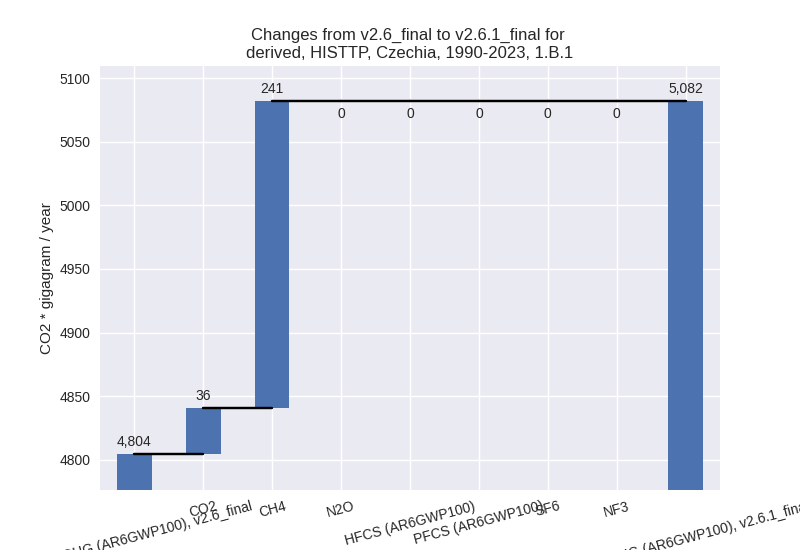
There is no subsector information available in PRIMAP-hist. - 1.B.2: Total sectoral emissions in 2022 are 1474.42
Gg CO2 / year which is 1.6% of category 1 emissions. 2023 Emissions have
changed by 54.7% (524.77 Gg CO2 /
year). 1990-2023 Emissions have changed by 93.3% (767.97 Gg CO2 / year). For 2023 the
changes per gas
are:
For 1990-2023 the changes per gas are: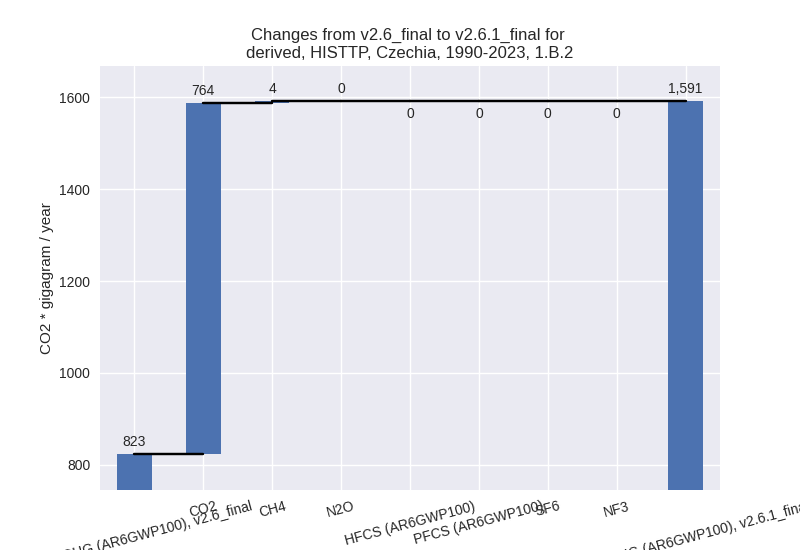
There is no subsector information available in PRIMAP-hist.
- 2: Total sectoral emissions in 2022 are 8605.04 Gg
CO2 / year which is 7.4% of M.0.EL emissions. 2023 Emissions have
changed by -11.3% (-1022.50 Gg CO2 /
year). 1990-2023 Emissions have changed by 3.6% (248.71 Gg CO2 / year). For 2023 the
changes per gas
are:
For 1990-2023 the changes per gas are: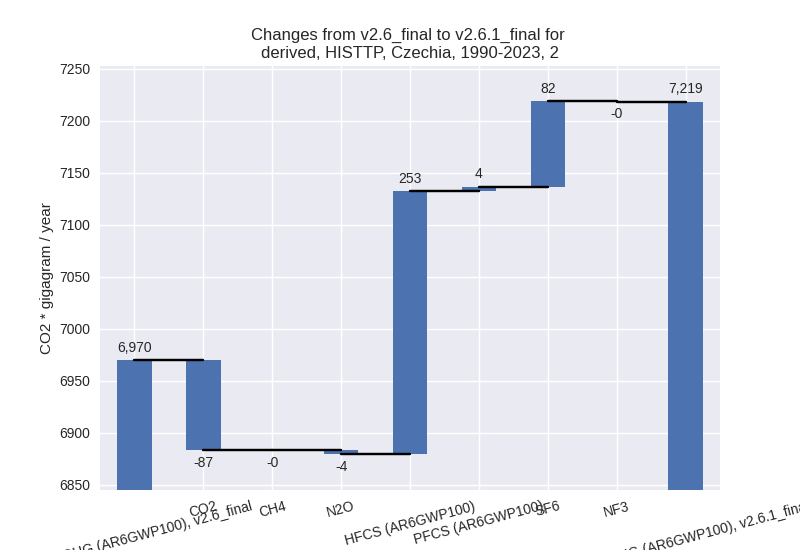
- M.AG: Total sectoral emissions in 2022 are 6684.17
Gg CO2 / year which is 5.8% of M.0.EL emissions. 2023 Emissions have
changed by 6.9% (428.93 Gg CO2 /
year). 1990-2023 Emissions have changed by 1.2% (90.55 Gg CO2 / year). For 2023 the
changes per gas
are:
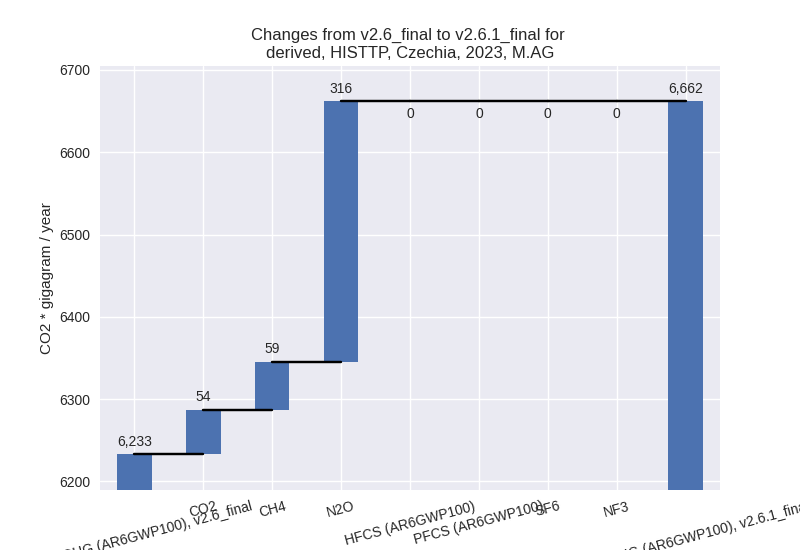
The changes come from the following subsectors:- 3.A: Total sectoral emissions in 2022 are 3504.16 Gg CO2 / year which is 52.4% of category M.AG emissions. 2023 Emissions have changed by 1.6% (56.13 Gg CO2 / year). 1990-2023 Emissions have changed by 0.1% (3.05 Gg CO2 / year).
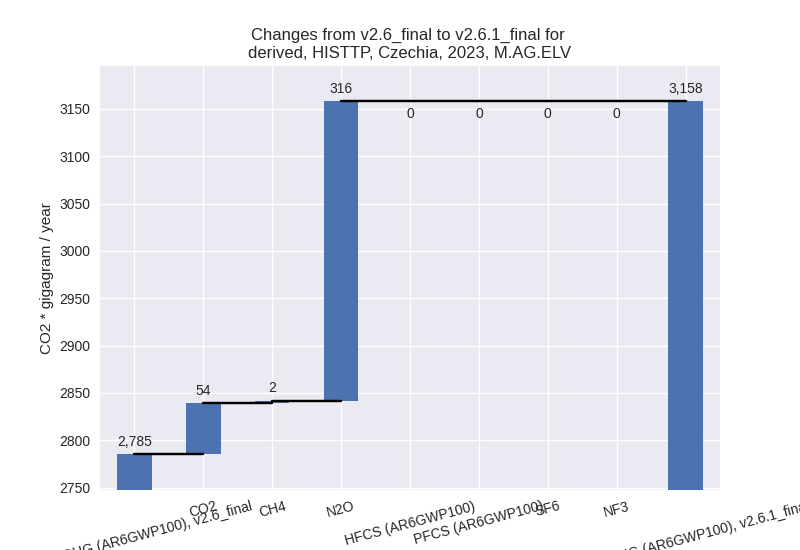
- M.AG.ELV: Total sectoral emissions in 2022 are
3180.01 Gg CO2 / year which is 47.6% of category M.AG emissions. 2023
Emissions have changed by 13.4%
(372.80 Gg CO2 / year). 1990-2023 Emissions have changed by 2.8% (87.50 Gg CO2 / year). For 2023 the
changes per gas
are:
For 1990-2023 the changes per gas are: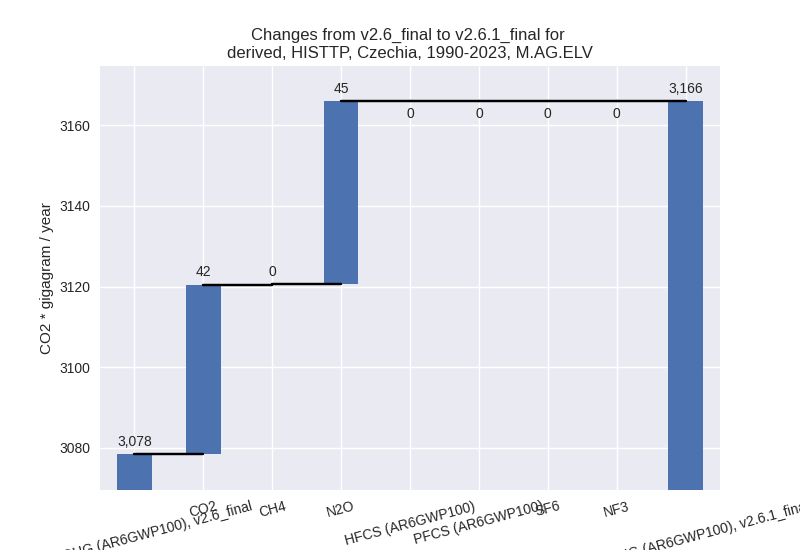
There is no subsector information available in PRIMAP-hist.
- 4: Total sectoral emissions in 2022 are 5738.59 Gg
CO2 / year which is 4.9% of M.0.EL emissions. 2023 Emissions have
changed by -7.6% (-478.76 Gg CO2 /
year). 1990-2023 Emissions have changed by -6.3% (-336.80 Gg CO2 / year). For 2023
the changes per gas
are:
For 1990-2023 the changes per gas are: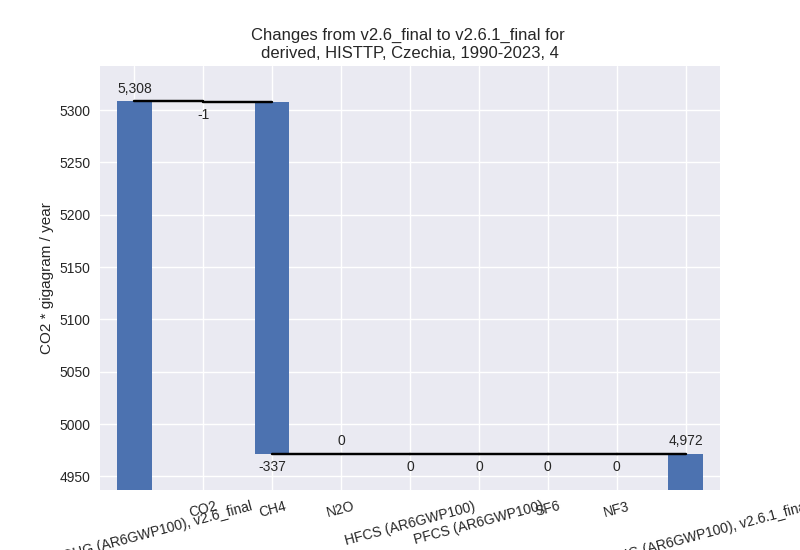
- 5: Total sectoral emissions in 2022 are 260.50 Gg
CO2 / year which is 0.2% of M.0.EL emissions. 2023 Emissions have
changed by -16.8% (-47.80 Gg CO2 /
year). 1990-2023 Emissions have changed by -6.6% (-27.73 Gg CO2 / year). For 2023 the
changes per gas
are:

For 1990-2023 the changes per gas are: