Changes in PRIMAP-hist v2.6.1_final compared to v2.6_final for Ecuador
2025-03-19
Johannes Gütschow
Change analysis for Ecuador for PRIMAP-hist v2.6.1_final compared to v2.6_final
Overview over emissions by sector and gas
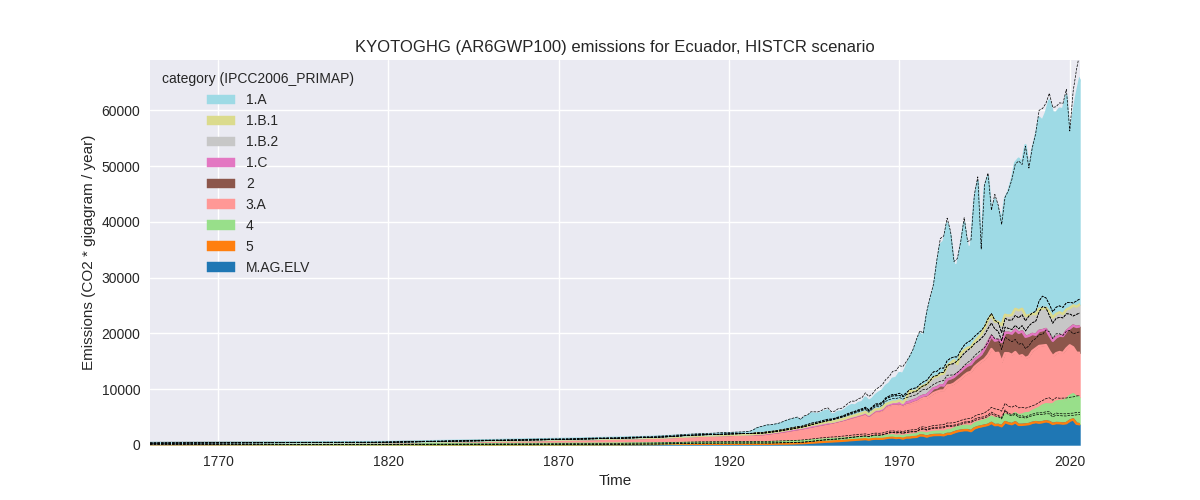
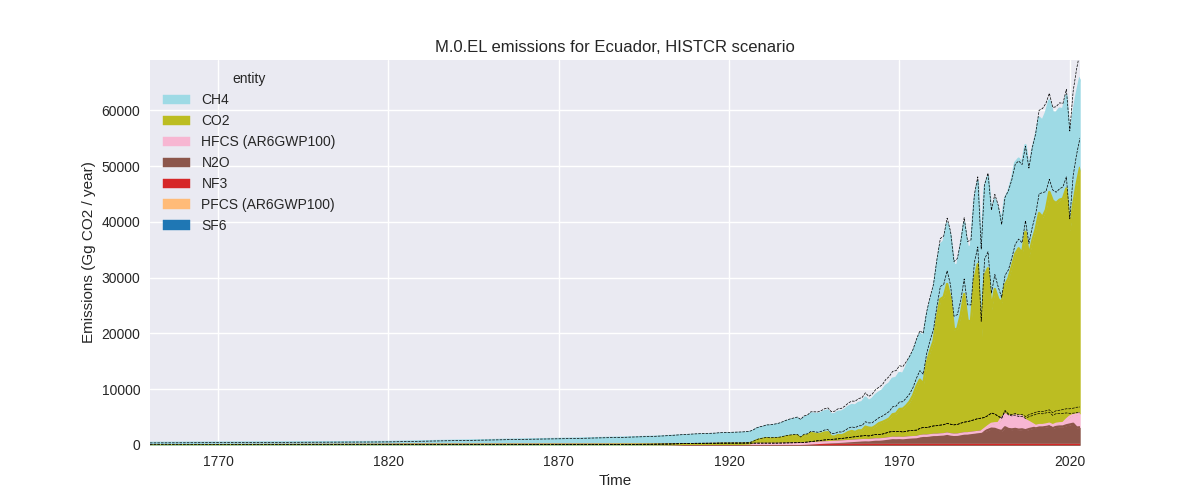
The following figures show the aggregate national total emissions excluding LULUCF AR6GWP100 for the country reported priority scenario. The dotted linesshow the v2.6_final data.
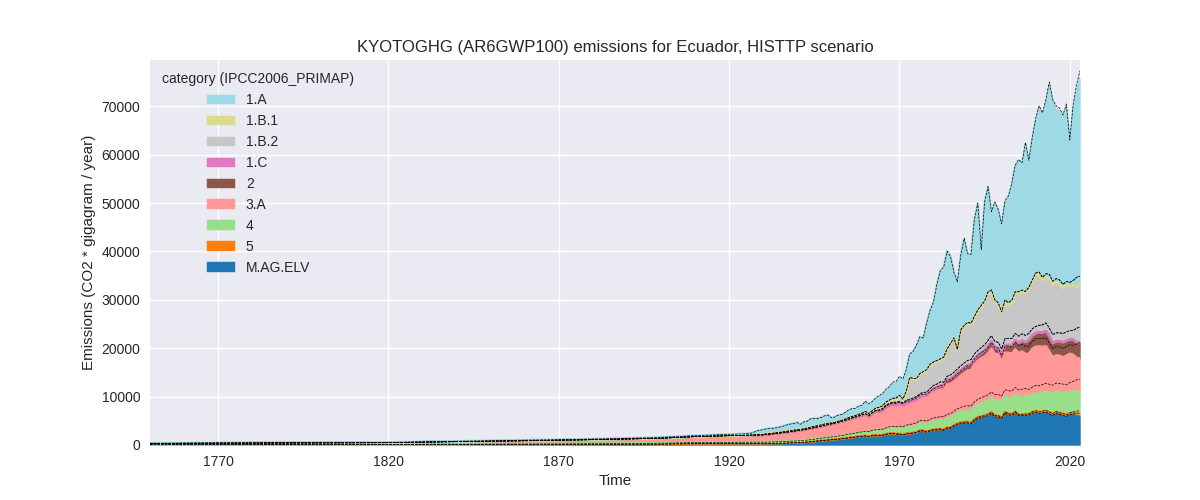
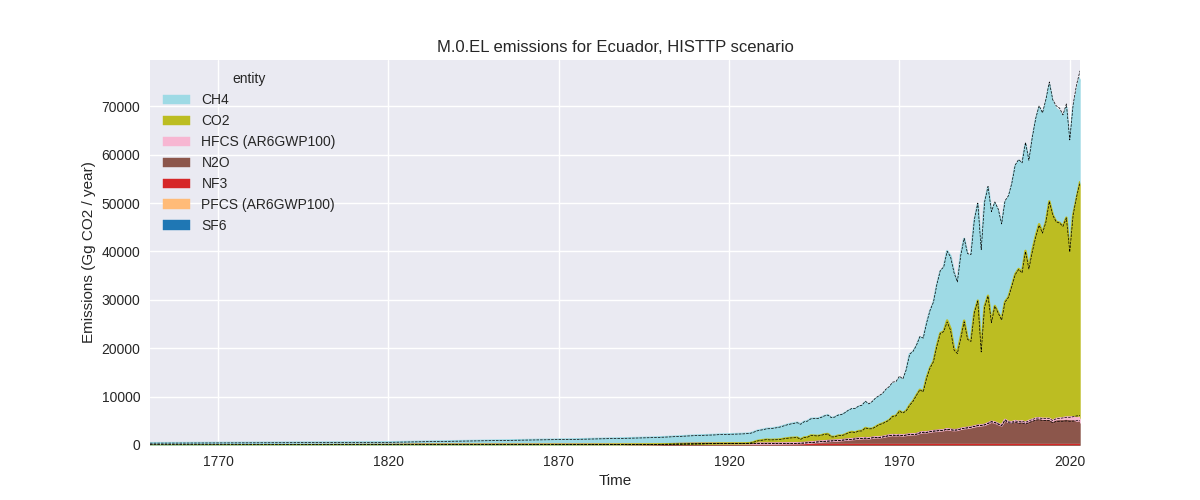
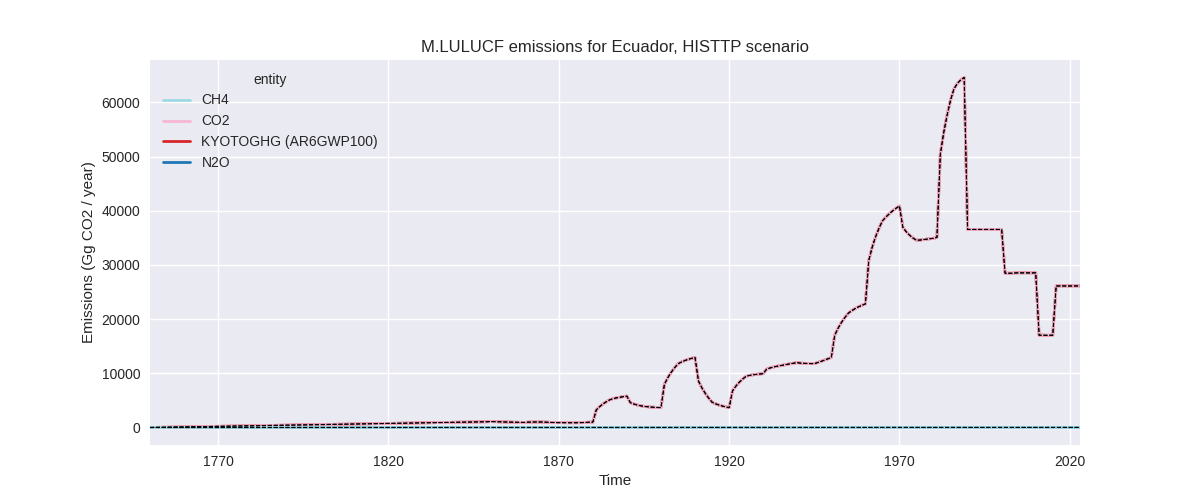
The following figures show the aggregate national total emissions excluding LULUCF AR6GWP100 for the third party priority scenario. The dotted linesshow the v2.6_final data.
Overview over changes
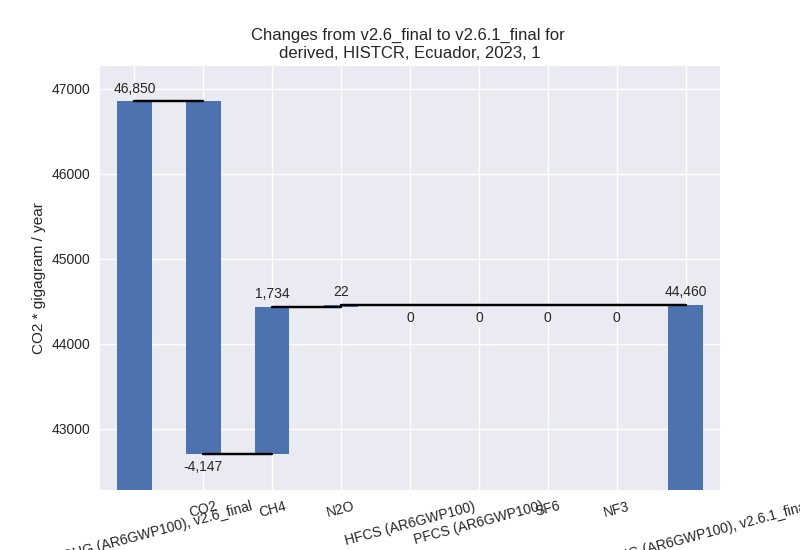
In the country reported priority scenario we have the following changes for aggregate Kyoto GHG and national total emissions excluding LULUCF (M.0.EL):
- Emissions in 2023 have changed by -6.7%% (-4746.52 Gg CO2 / year)
- Emissions in 1990-2023 have changed by -1.9%% (-995.02 Gg CO2 / year)
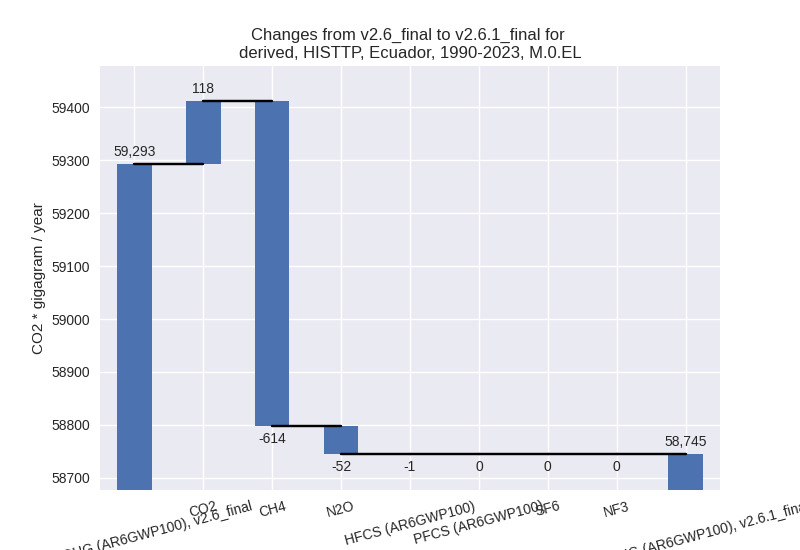
In the third party priority scenario we have the following changes for aggregate Kyoto GHG and national total emissions excluding LULUCF (M.0.EL):
- Emissions in 2023 have changed by -2.0%% (-1551.94 Gg CO2 / year)
- Emissions in 1990-2023 have changed by -0.9%% (-548.04 Gg CO2 / year)
Most important changes per scenario and time frame
In the country reported priority scenario the following sector-gas combinations have the highest absolute impact on national total KyotoGHG (AR6GWP100) emissions in 2023 (top 5):
- 1: 1.A, CO2 with -3786.87 Gg CO2 / year (-8.7%)
- 2: 3.A, CH4 with -3479.32 Gg CO2 / year (-31.1%)
- 3: M.AG.ELV, N2O with -2210.11 Gg CO2 / year (-48.4%)
- 4: 4, CH4 with 1833.17 Gg CO2 / year (65.7%)
- 5: 1.B.2, CH4 with 1722.86 Gg CO2 / year (297.8%)
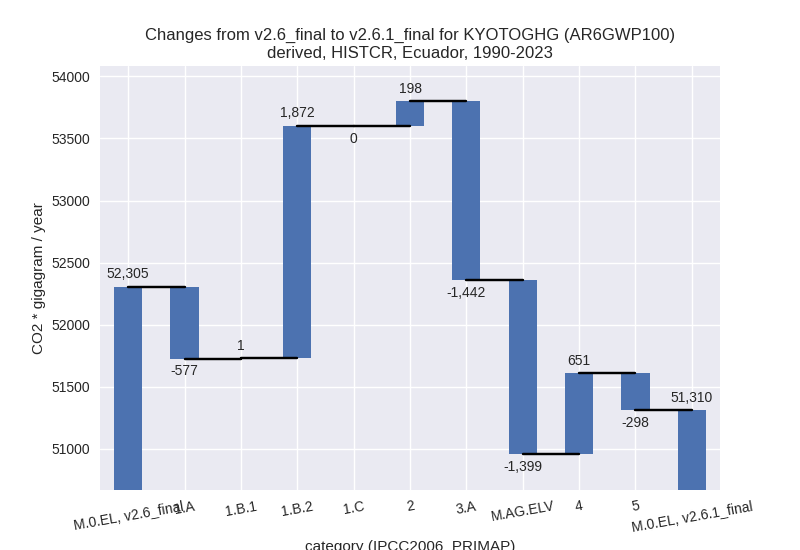
In the country reported priority scenario the following sector-gas combinations have the highest absolute impact on national total KyotoGHG (AR6GWP100) emissions in 1990-2023 (top 5):
- 1: M.AG.ELV, N2O with -2089.43 Gg CO2 / year (-48.0%)
- 2: 1.B.2, CH4 with 1779.93 Gg CO2 / year (301.6%)
- 3: 3.A, CH4 with -1442.07 Gg CO2 / year (-12.7%)
- 4: 2, HFCS (AR6GWP100) with 761.92 Gg CO2 / year (225.5%)
- 5: M.AG.ELV, CH4 with 689.94 Gg CO2 / year (114.6%)
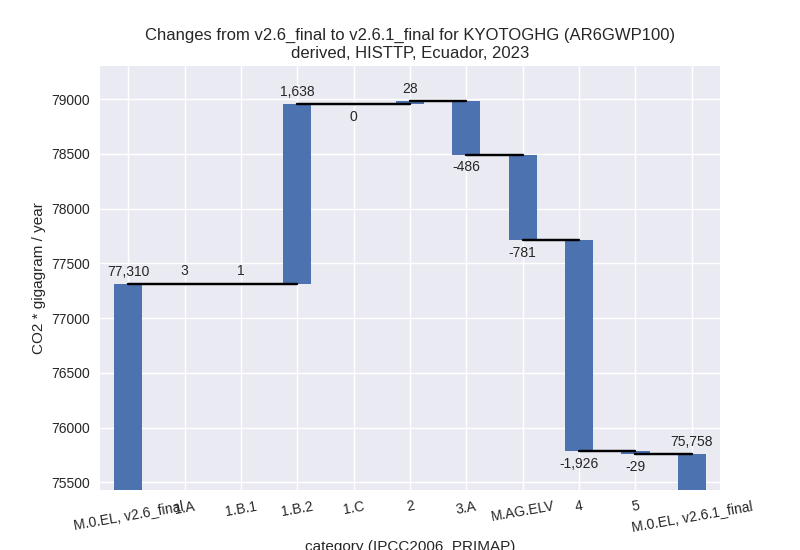
In the third party priority scenario the following sector-gas combinations have the highest absolute impact on national total KyotoGHG (AR6GWP100) emissions in 2023 (top 5):
- 1: 4, CH4 with -1933.17 Gg CO2 / year (-30.5%)
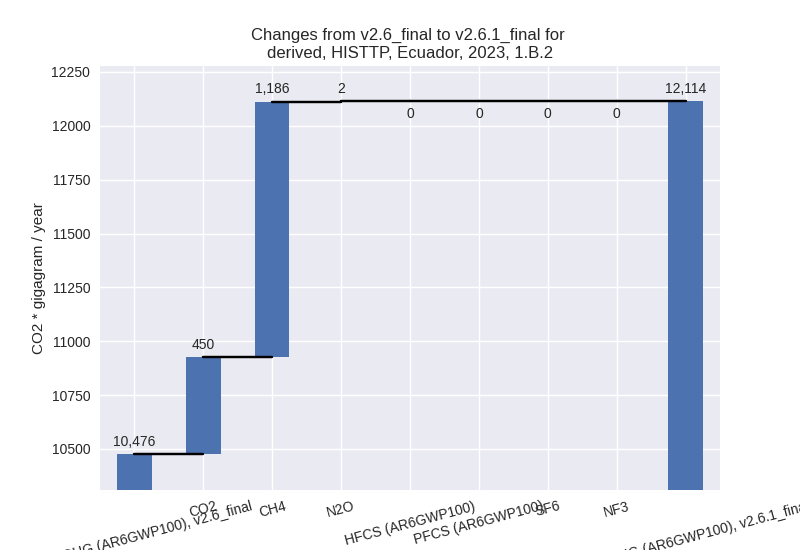
- 2: 1.B.2, CH4 with 1185.99 Gg CO2 / year (17.1%)
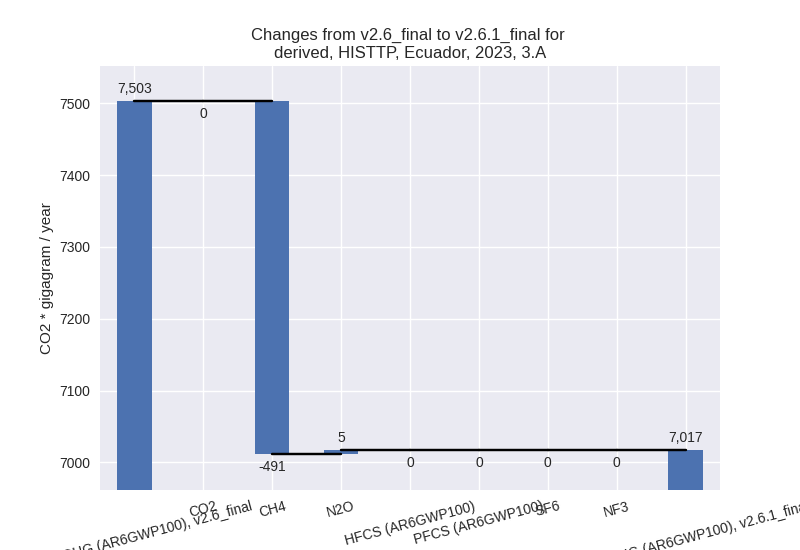
- 3: 3.A, CH4 with -491.46 Gg CO2 / year (-6.7%)
- 4: 1.B.2, CO2 with 450.04 Gg CO2 / year (12.8%)
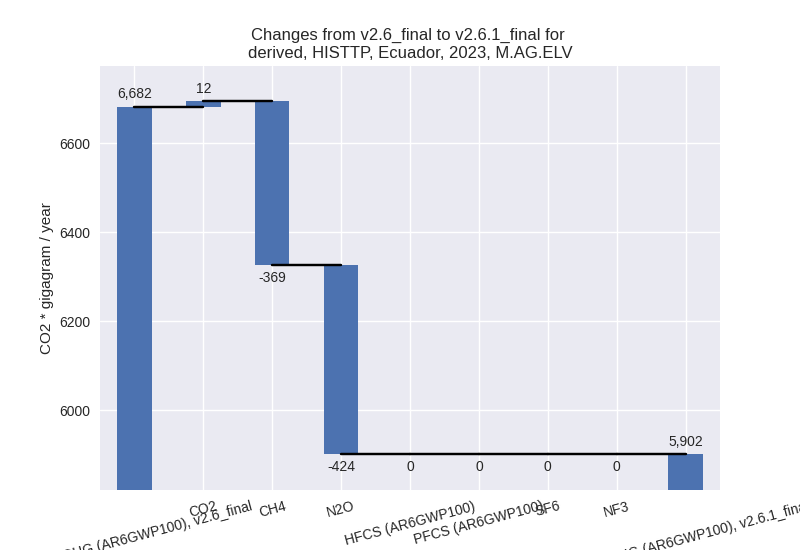
- 5: M.AG.ELV, N2O with -423.97 Gg CO2 / year (-10.9%)
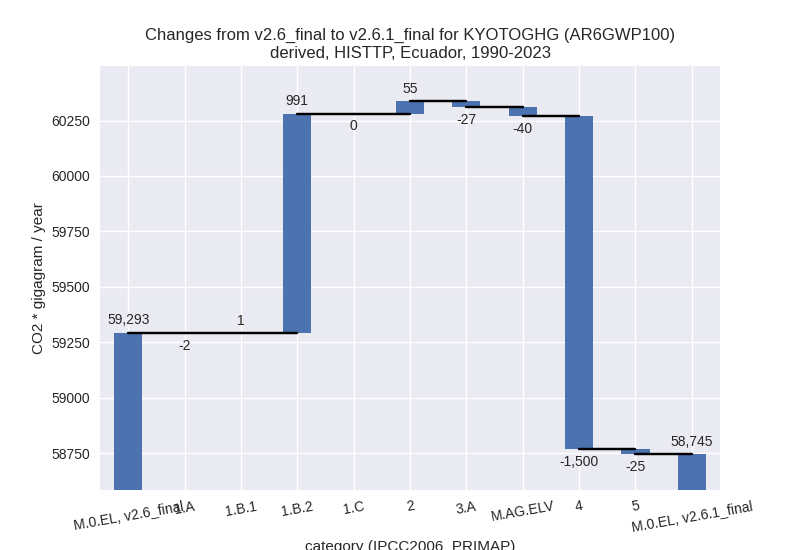
In the third party priority scenario the following sector-gas combinations have the highest absolute impact on national total KyotoGHG (AR6GWP100) emissions in 1990-2023 (top 5):
- 1: 4, CH4 with -1500.88 Gg CO2 / year (-30.7%)
- 2: 1.B.2, CH4 with 929.66 Gg CO2 / year (14.1%)
- 3: 1.B.2, CO2 with 60.34 Gg CO2 / year (2.1%)
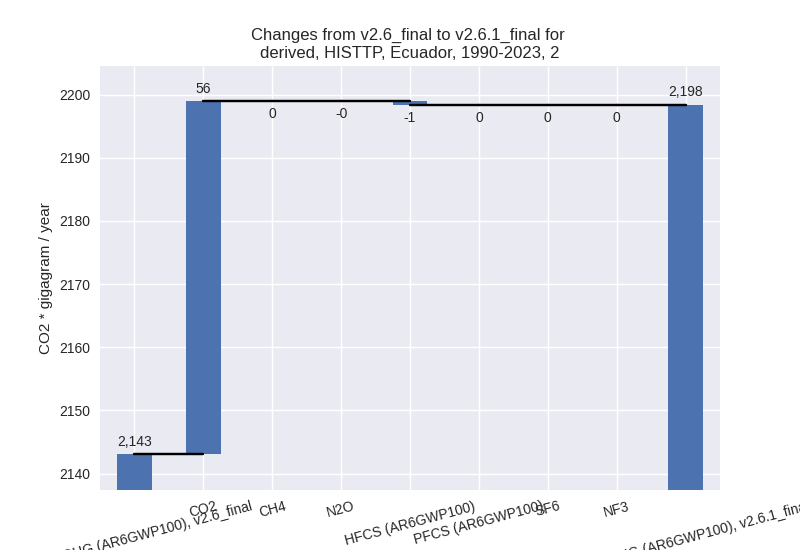
- 4: 2, CO2 with 55.89 Gg CO2 / year (3.1%)
- 5: M.AG.ELV, N2O with -28.53 Gg CO2 / year (-0.8%)
Notes on data changes
Here we list notes explaining important emissions changes for the country.
- CRT data from BTR1 covering 1994, 2000, 2006, 2010, 2012, 2014,
2016, 2018, and 2020-2022 has been included. Is replaces and extends NIR
data. The new country reported data is lower in total.
- Cumulative emissions in the CR scenario are lower in the agricultural sector and higher for fugitive and f-gas emissions. 2023 emissions are lower in total with an additional contribution from energy CO2 where CRT data is lower than EI for the latest years.
- Cumulative emissions in the TP scenario are lower as well. The main influence is waste CH4 which is partly offset by higher fugitive CH4 in 1.B.2. Both changes come directly from new EDGAR data. For 2023 we additionally have lower agricultural emissions due to a decline in FAO data for 2022 and higher fugitive CO2 (from EDGAR)
Changes by sector and gas
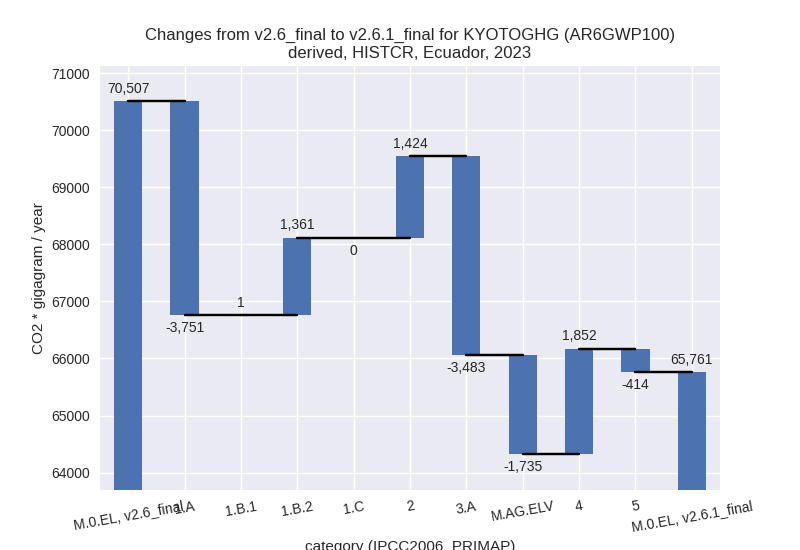
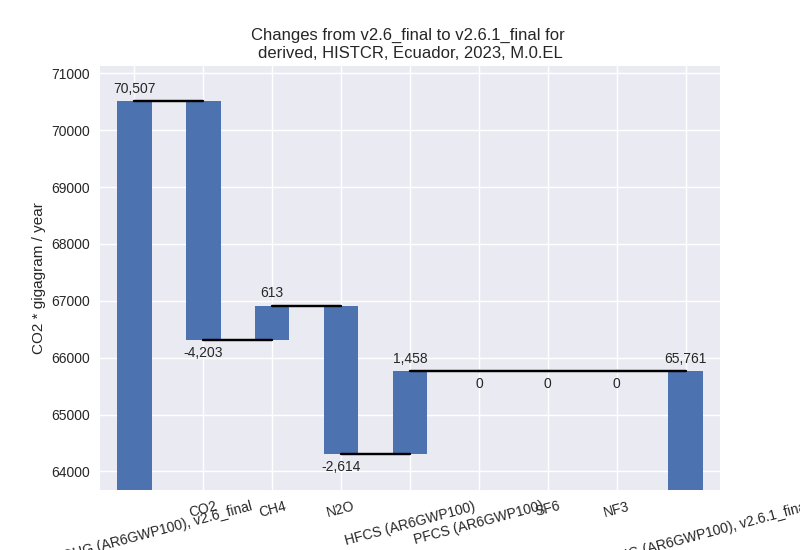
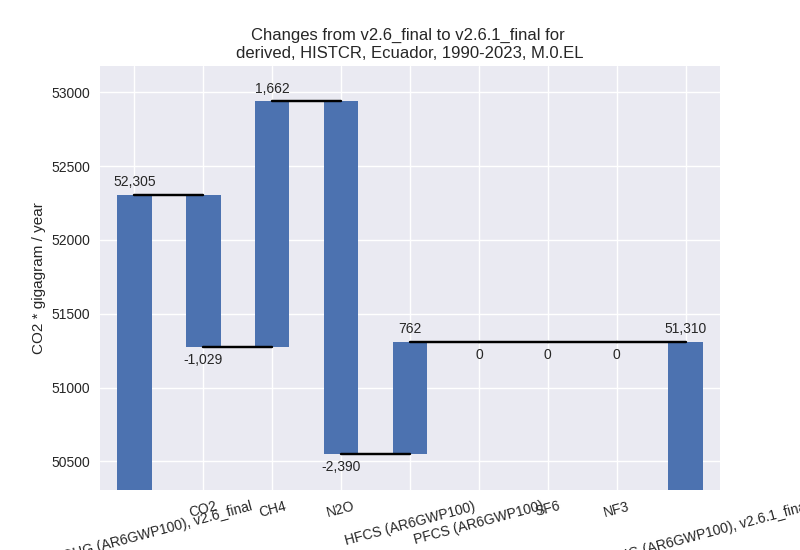
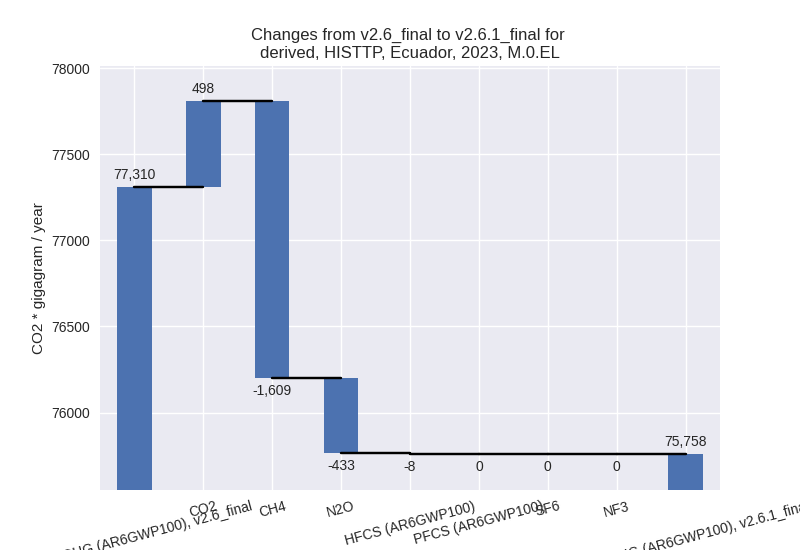
For each scenario and time frame the changes are displayed for all individual sectors and all individual gases. In the sector plot we use aggregate Kyoto GHGs in AR6GWP100. In the gas plot we usenational total emissions without LULUCF.
country reported scenario
2023
1990-2023
third party scenario
2023
1990-2023
Detailed changes for the scenarios:
country reported scenario (HISTCR):
Most important changes per time frame
For 2023 the following sector-gas combinations have the highest absolute impact on national total KyotoGHG (AR6GWP100) emissions in 2023 (top 5):
- 1: 1.A, CO2 with -3786.87 Gg CO2 / year (-8.7%)
- 2: 3.A, CH4 with -3479.32 Gg CO2 / year (-31.1%)
- 3: M.AG.ELV, N2O with -2210.11 Gg CO2 / year (-48.4%)
- 4: 4, CH4 with 1833.17 Gg CO2 / year (65.7%)
- 5: 1.B.2, CH4 with 1722.86 Gg CO2 / year (297.8%)
For 1990-2023 the following sector-gas combinations have the highest absolute impact on national total KyotoGHG (AR6GWP100) emissions in 1990-2023 (top 5):
- 1: M.AG.ELV, N2O with -2089.43 Gg CO2 / year (-48.0%)
- 2: 1.B.2, CH4 with 1779.93 Gg CO2 / year (301.6%)
- 3: 3.A, CH4 with -1442.07 Gg CO2 / year (-12.7%)
- 4: 2, HFCS (AR6GWP100) with 761.92 Gg CO2 / year (225.5%)
- 5: M.AG.ELV, CH4 with 689.94 Gg CO2 / year (114.6%)
Changes in the main sectors for aggregate KyotoGHG (AR6GWP100) are
- 1: Total sectoral emissions in 2022 are 41675.73 Gg
CO2 / year which is 66.3% of M.0.EL emissions. 2023 Emissions have
changed by -5.1% (-2390.22 Gg CO2 /
year). 1990-2023 Emissions have changed by 4.2% (1295.09 Gg CO2 / year). For 2023 the
changes per gas
are:
For 1990-2023 the changes per gas are: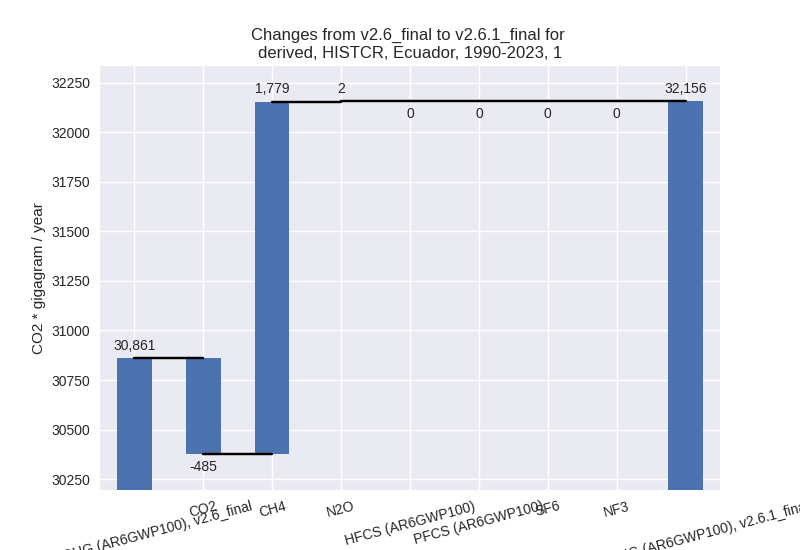
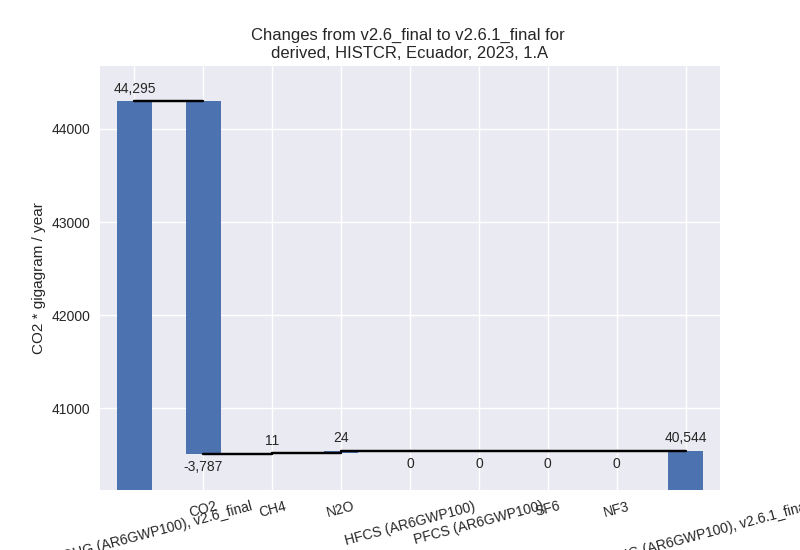
The changes come from the following subsectors:- 1.A: Total sectoral emissions in 2022 are 38021.31
Gg CO2 / year which is 91.2% of category 1 emissions. 2023 Emissions
have changed by -8.5% (-3751.35 Gg
CO2 / year). 1990-2023 Emissions have changed by -2.0% (-577.41 Gg CO2 / year). For 2023
the changes per gas
are:
There is no subsector information available in PRIMAP-hist. - 1.B.1: Total sectoral emissions in 2022 are 0.54 Gg
CO2 / year which is 0.0% of category 1 emissions. 2023 Emissions have
changed by inf% (0.54 Gg CO2 /
year). 1990-2023 Emissions have changed by inf% (0.54 Gg CO2 / year). For 2023 the
changes per gas
are:
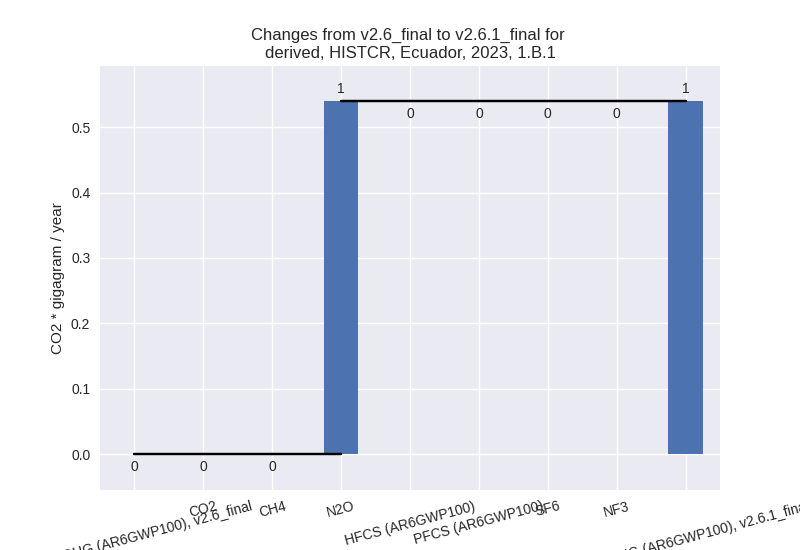
For 1990-2023 the changes per gas are:
There is no subsector information available in PRIMAP-hist. - 1.B.2: Total sectoral emissions in 2022 are 3653.89
Gg CO2 / year which is 8.8% of category 1 emissions. 2023 Emissions have
changed by 53.2% (1360.60 Gg CO2 /
year). 1990-2023 Emissions have changed by 104.2% (1871.96 Gg CO2 / year). For 2023
the changes per gas
are:
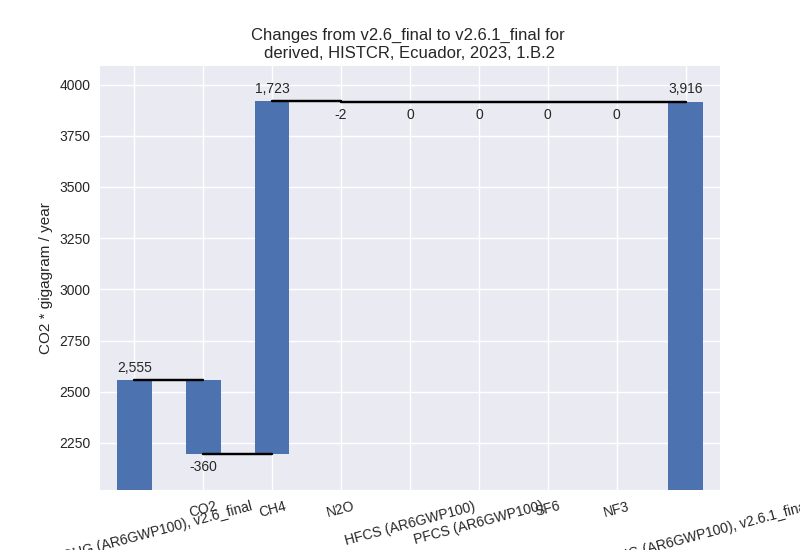
For 1990-2023 the changes per gas are:
There is no subsector information available in PRIMAP-hist.
- 1.A: Total sectoral emissions in 2022 are 38021.31
Gg CO2 / year which is 91.2% of category 1 emissions. 2023 Emissions
have changed by -8.5% (-3751.35 Gg
CO2 / year). 1990-2023 Emissions have changed by -2.0% (-577.41 Gg CO2 / year). For 2023
the changes per gas
are:
- 2: Total sectoral emissions in 2022 are 4615.46 Gg
CO2 / year which is 7.3% of M.0.EL emissions. 2023 Emissions have
changed by 42.4% (1423.64 Gg CO2 /
year). 1990-2023 Emissions have changed by 7.2% (198.23 Gg CO2 / year). For 2023 the
changes per gas
are:
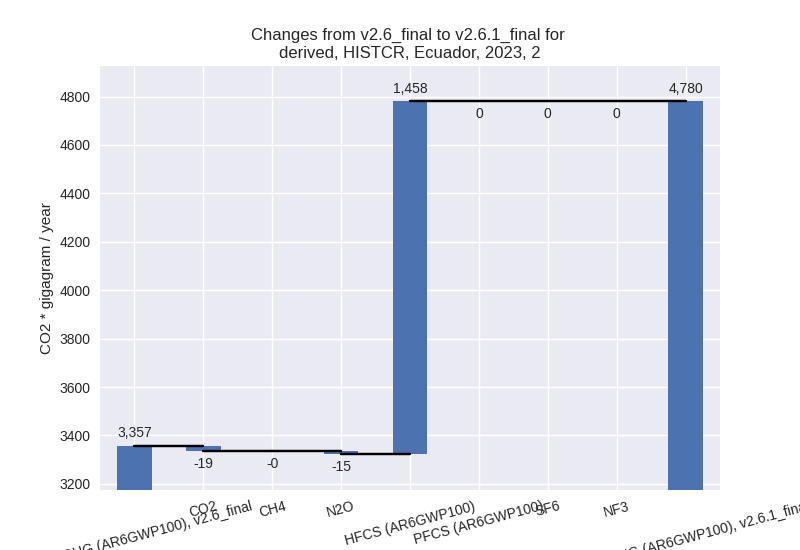
For 1990-2023 the changes per gas are: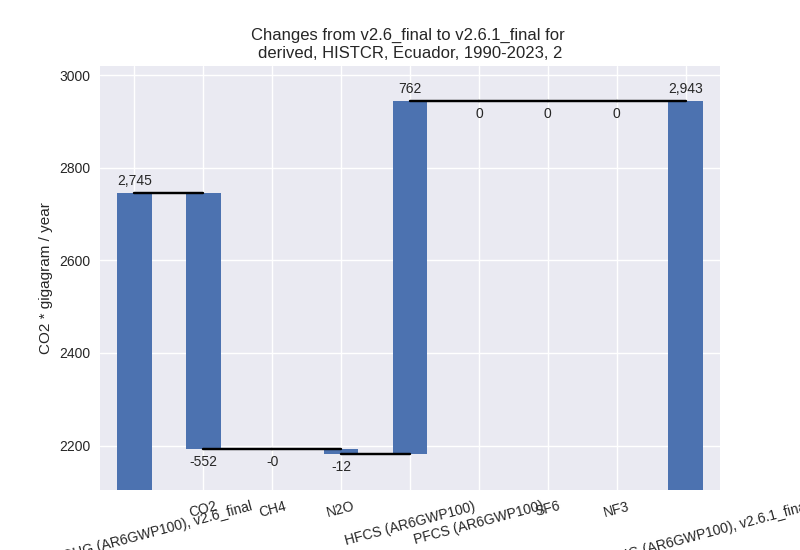
- M.AG: Total sectoral emissions in 2022 are 11772.54
Gg CO2 / year which is 18.7% of M.0.EL emissions. 2023 Emissions have
changed by -30.9% (-5217.78 Gg CO2 /
year). 1990-2023 Emissions have changed by -17.0% (-2840.98 Gg CO2 / year). For 2023
the changes per gas
are:
For 1990-2023 the changes per gas are: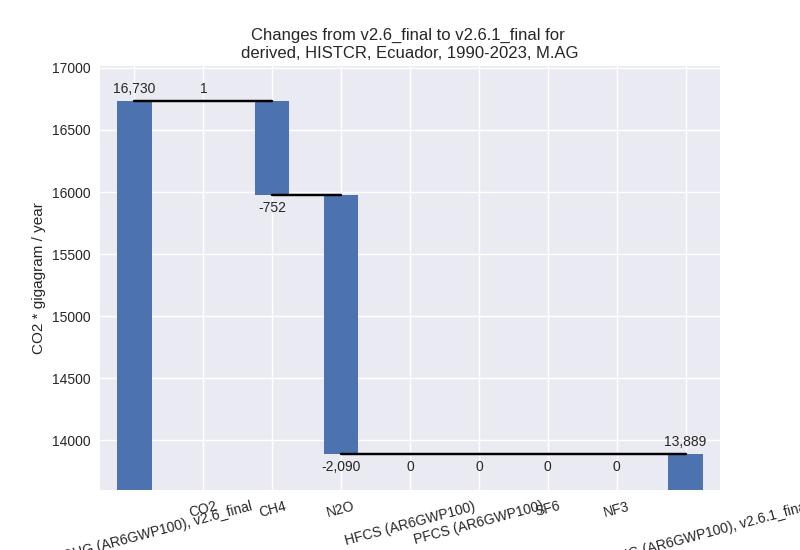
The changes come from the following subsectors:- 3.A: Total sectoral emissions in 2022 are 7958.63
Gg CO2 / year which is 67.6% of category M.AG emissions. 2023 Emissions
have changed by -30.4% (-3482.89 Gg
CO2 / year). 1990-2023 Emissions have changed by -12.4% (-1442.40 Gg CO2 / year). For 2023
the changes per gas
are:

For 1990-2023 the changes per gas are:
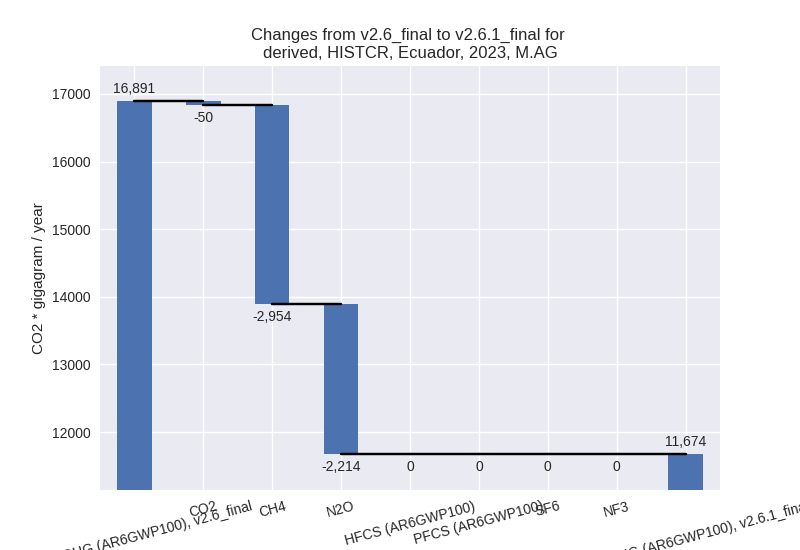
There is no subsector information available in PRIMAP-hist. - M.AG.ELV: Total sectoral emissions in 2022 are
3813.91 Gg CO2 / year which is 32.4% of category M.AG emissions. 2023
Emissions have changed by -31.8%
(-1734.88 Gg CO2 / year). 1990-2023 Emissions have changed by -27.2% (-1398.58 Gg CO2 / year). For 2023
the changes per gas
are:
For 1990-2023 the changes per gas are: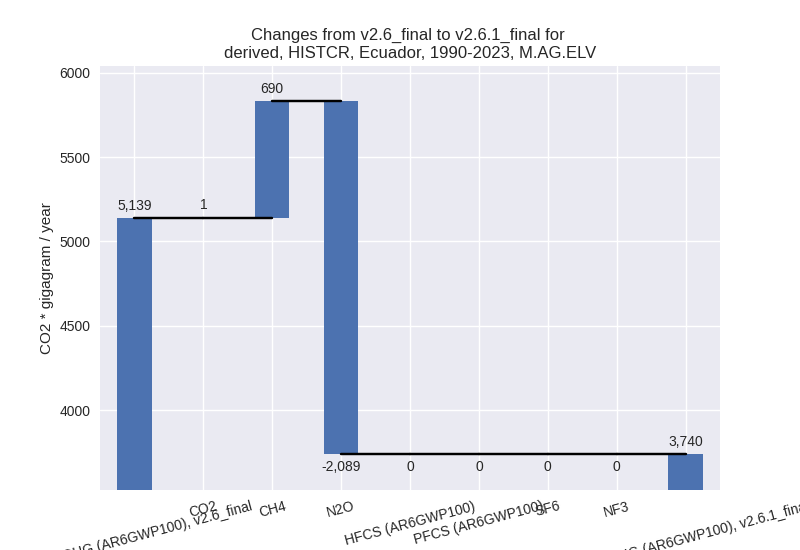
There is no subsector information available in PRIMAP-hist.
- 3.A: Total sectoral emissions in 2022 are 7958.63
Gg CO2 / year which is 67.6% of category M.AG emissions. 2023 Emissions
have changed by -30.4% (-3482.89 Gg
CO2 / year). 1990-2023 Emissions have changed by -12.4% (-1442.40 Gg CO2 / year). For 2023
the changes per gas
are:
- 4: Total sectoral emissions in 2022 are 4780.09 Gg
CO2 / year which is 7.6% of M.0.EL emissions. 2023 Emissions have
changed by 61.8% (1851.78 Gg CO2 /
year). 1990-2023 Emissions have changed by 39.0% (650.98 Gg CO2 / year). For 2023 the
changes per gas
are:

For 1990-2023 the changes per gas are: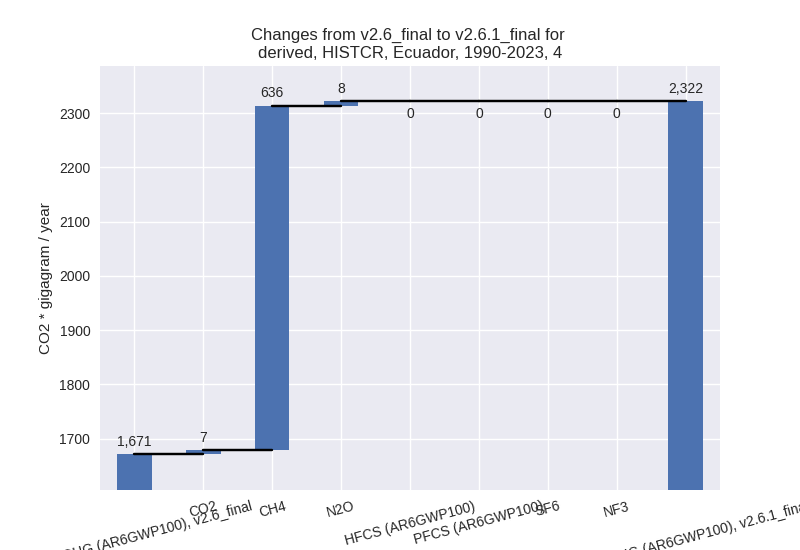
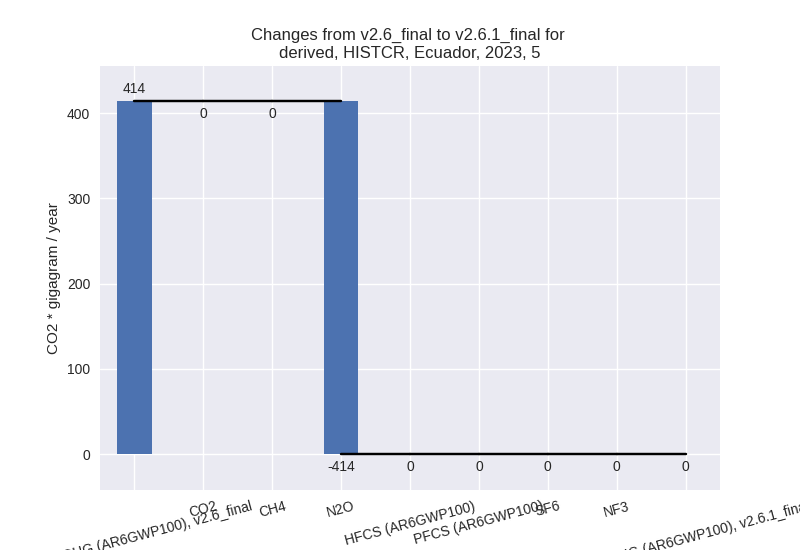
- 5: Total sectoral emissions in 2022 are 0.00 Gg CO2
/ year which is 0.0% of M.0.EL emissions. 2023 Emissions have changed by
-100.0% (-413.96 Gg CO2 / year).
1990-2023 Emissions have changed by -100.0% (-298.35 Gg CO2 / year). For 2023
the changes per gas
are:
For 1990-2023 the changes per gas are: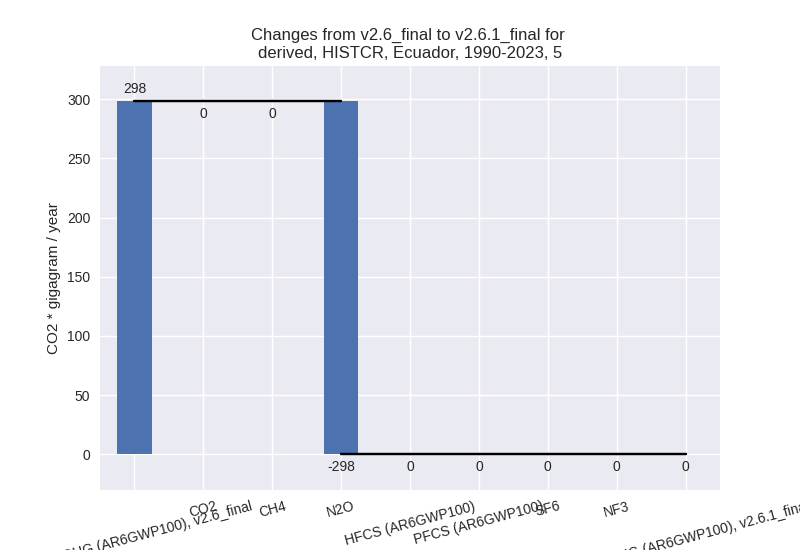
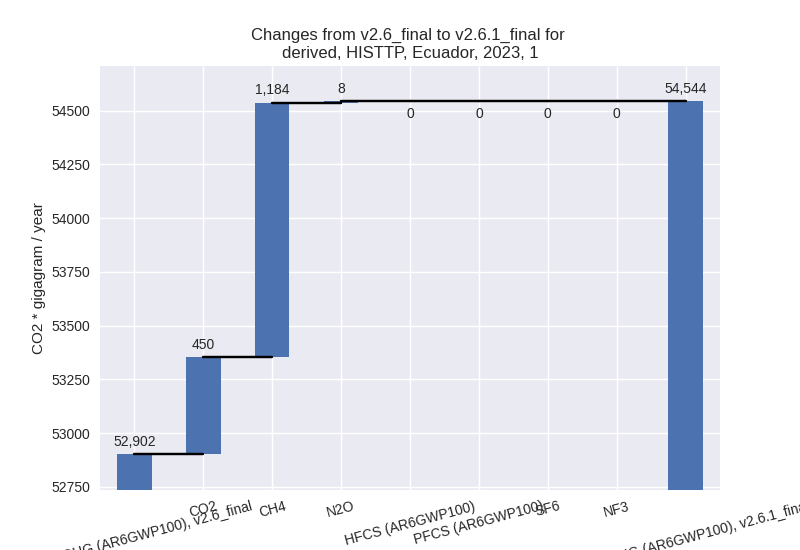
third party scenario (HISTTP):
Most important changes per time frame
For 2023 the following sector-gas combinations have the highest absolute impact on national total KyotoGHG (AR6GWP100) emissions in 2023 (top 5):
- 1: 4, CH4 with -1933.17 Gg CO2 / year (-30.5%)
- 2: 1.B.2, CH4 with 1185.99 Gg CO2 / year (17.1%)
- 3: 3.A, CH4 with -491.46 Gg CO2 / year (-6.7%)
- 4: 1.B.2, CO2 with 450.04 Gg CO2 / year (12.8%)
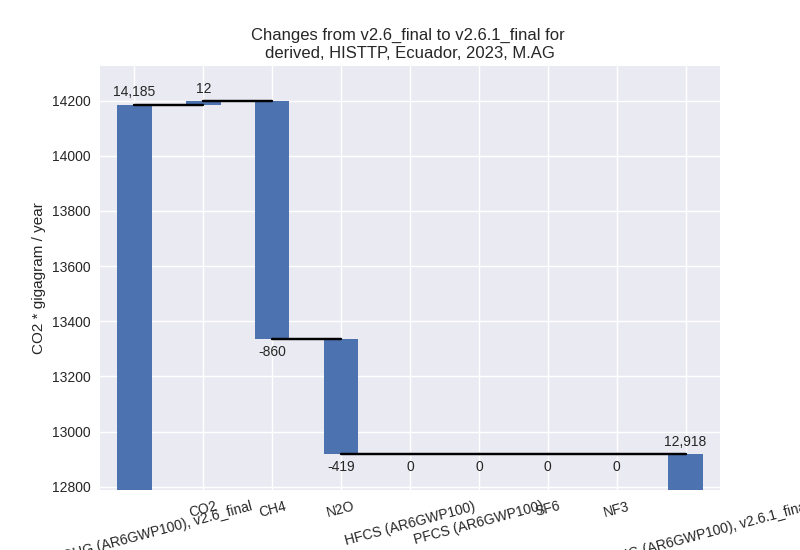
- 5: M.AG.ELV, N2O with -423.97 Gg CO2 / year (-10.9%)
For 1990-2023 the following sector-gas combinations have the highest absolute impact on national total KyotoGHG (AR6GWP100) emissions in 1990-2023 (top 5):
- 1: 4, CH4 with -1500.88 Gg CO2 / year (-30.7%)
- 2: 1.B.2, CH4 with 929.66 Gg CO2 / year (14.1%)
- 3: 1.B.2, CO2 with 60.34 Gg CO2 / year (2.1%)
- 4: 2, CO2 with 55.89 Gg CO2 / year (3.1%)
- 5: M.AG.ELV, N2O with -28.53 Gg CO2 / year (-0.8%)
Changes in the main sectors for aggregate KyotoGHG (AR6GWP100) are
- 1: Total sectoral emissions in 2022 are 51282.73 Gg
CO2 / year which is 70.7% of M.0.EL emissions. 2023 Emissions have
changed by 3.1% (1642.12 Gg CO2 /
year). 1990-2023 Emissions have changed by 2.7% (988.94 Gg CO2 / year). For 2023 the
changes per gas
are:
For 1990-2023 the changes per gas are: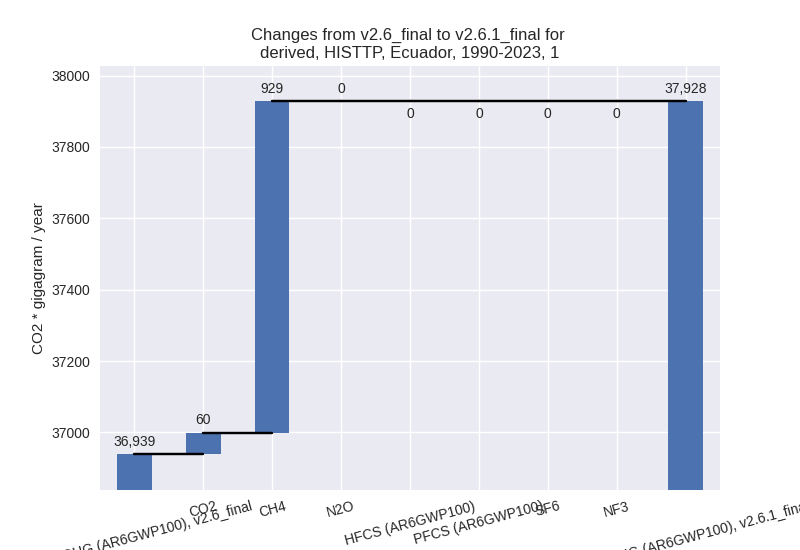
The changes come from the following subsectors:- 1.A: Total sectoral emissions in 2022 are 39788.03 Gg CO2 / year which is 77.6% of category 1 emissions. 2023 Emissions have changed by 0.0% (3.24 Gg CO2 / year). 1990-2023 Emissions have changed by -0.0% (-2.46 Gg CO2 / year).
- 1.B.1: Total sectoral emissions in 2022 are 0.54 Gg
CO2 / year which is 0.0% of category 1 emissions. 2023 Emissions have
changed by inf% (0.54 Gg CO2 /
year). 1990-2023 Emissions have changed by inf% (0.54 Gg CO2 / year). For 2023 the
changes per gas
are:
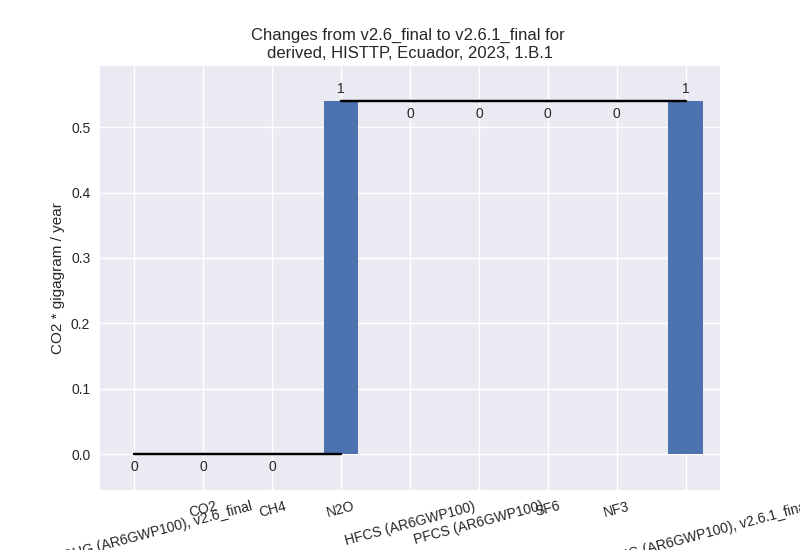
For 1990-2023 the changes per gas are: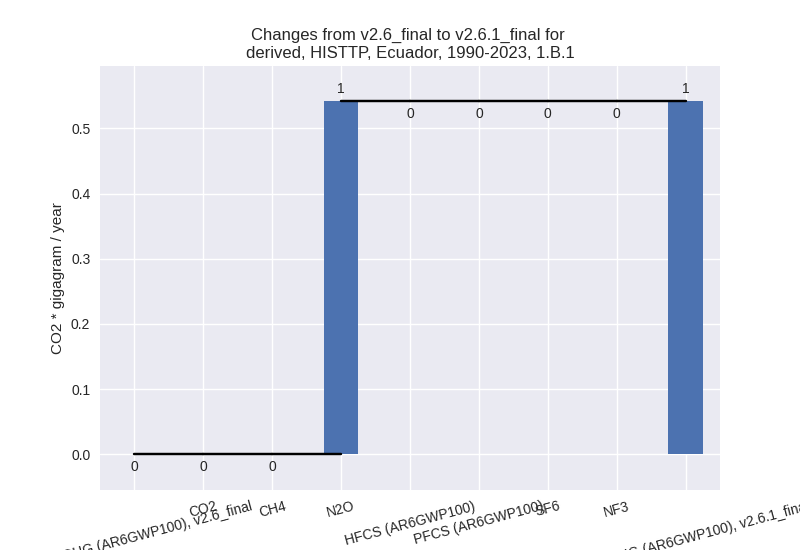
There is no subsector information available in PRIMAP-hist. - 1.B.2: Total sectoral emissions in 2022 are
11494.16 Gg CO2 / year which is 22.4% of category 1 emissions. 2023
Emissions have changed by 15.6%
(1638.35 Gg CO2 / year). 1990-2023 Emissions have changed by 10.5% (990.85 Gg CO2 / year). For 2023 the
changes per gas
are:
For 1990-2023 the changes per gas are: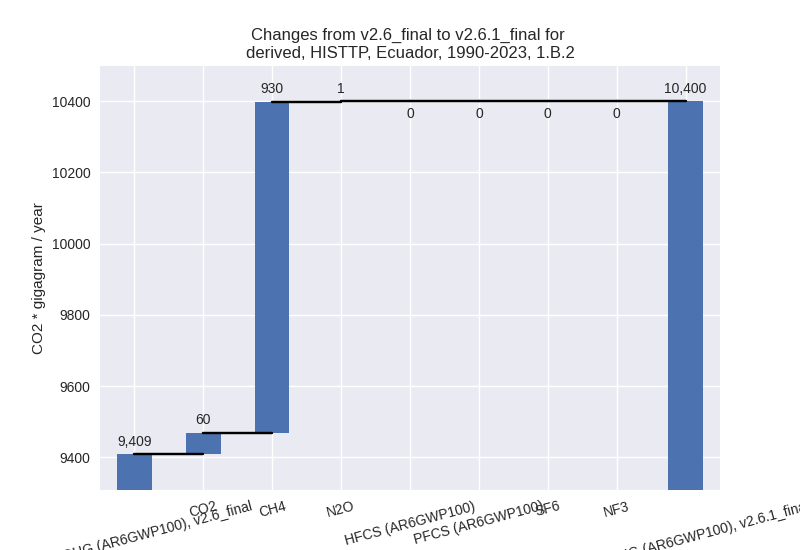
There is no subsector information available in PRIMAP-hist.
- 2: Total sectoral emissions in 2022 are 3233.20 Gg
CO2 / year which is 4.5% of M.0.EL emissions. 2023 Emissions have
changed by 0.9% (28.01 Gg CO2 /
year). 1990-2023 Emissions have changed by 2.6% (55.34 Gg CO2 / year). For 1990-2023
the changes per gas
are:
- M.AG: Total sectoral emissions in 2022 are 13075.91
Gg CO2 / year which is 18.0% of M.0.EL emissions. 2023 Emissions have
changed by -8.9% (-1266.91 Gg CO2 /
year). 1990-2023 Emissions have changed by -0.5% (-67.33 Gg CO2 / year). For 2023 the
changes per gas
are:
The changes come from the following subsectors:- 3.A: Total sectoral emissions in 2022 are 7018.66
Gg CO2 / year which is 53.7% of category M.AG emissions. 2023 Emissions
have changed by -6.5% (-486.02 Gg
CO2 / year). 1990-2023 Emissions have changed by -0.3% (-27.05 Gg CO2 / year). For 2023 the
changes per gas
are:
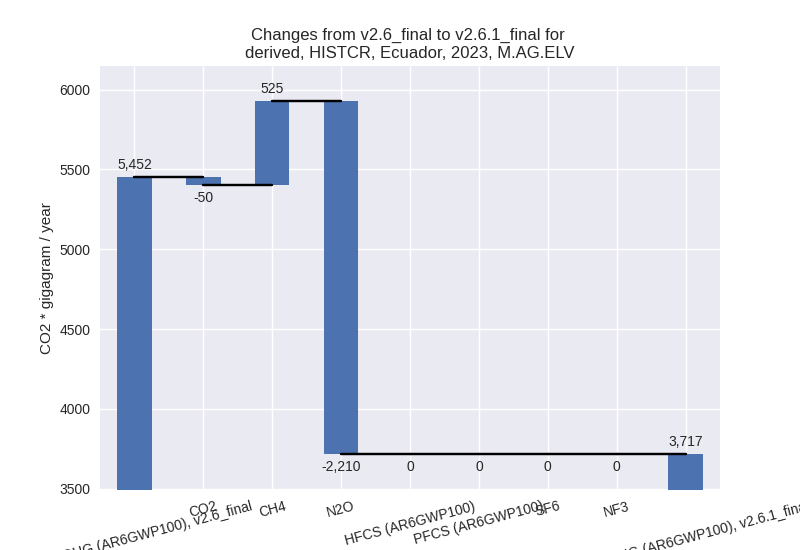
There is no subsector information available in PRIMAP-hist. - M.AG.ELV: Total sectoral emissions in 2022 are
6057.26 Gg CO2 / year which is 46.3% of category M.AG emissions. 2023
Emissions have changed by -11.7%
(-780.89 Gg CO2 / year). 1990-2023 Emissions have changed by -0.7% (-40.29 Gg CO2 / year). For 2023 the
changes per gas
are:
There is no subsector information available in PRIMAP-hist.
- 3.A: Total sectoral emissions in 2022 are 7018.66
Gg CO2 / year which is 53.7% of category M.AG emissions. 2023 Emissions
have changed by -6.5% (-486.02 Gg
CO2 / year). 1990-2023 Emissions have changed by -0.3% (-27.05 Gg CO2 / year). For 2023 the
changes per gas
are:
- 4: Total sectoral emissions in 2022 are 4544.90 Gg
CO2 / year which is 6.3% of M.0.EL emissions. 2023 Emissions have
changed by -29.5% (-1925.97 Gg CO2 /
year). 1990-2023 Emissions have changed by -29.8% (-1500.38 Gg CO2 / year). For 2023
the changes per gas
are:

For 1990-2023 the changes per gas are: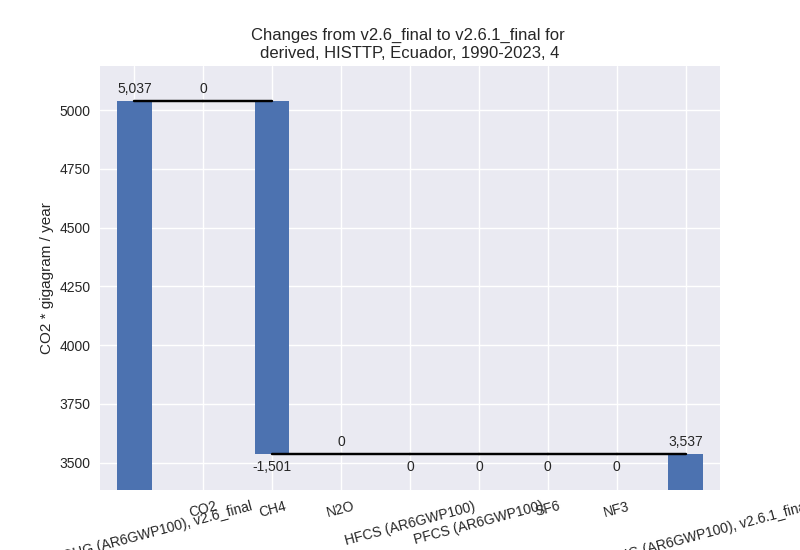
- 5: Total sectoral emissions in 2022 are 362.62 Gg
CO2 / year which is 0.5% of M.0.EL emissions. 2023 Emissions have
changed by -7.1% (-29.19 Gg CO2 /
year). 1990-2023 Emissions have changed by -8.2% (-24.61 Gg CO2 / year). For 2023 the
changes per gas
are:
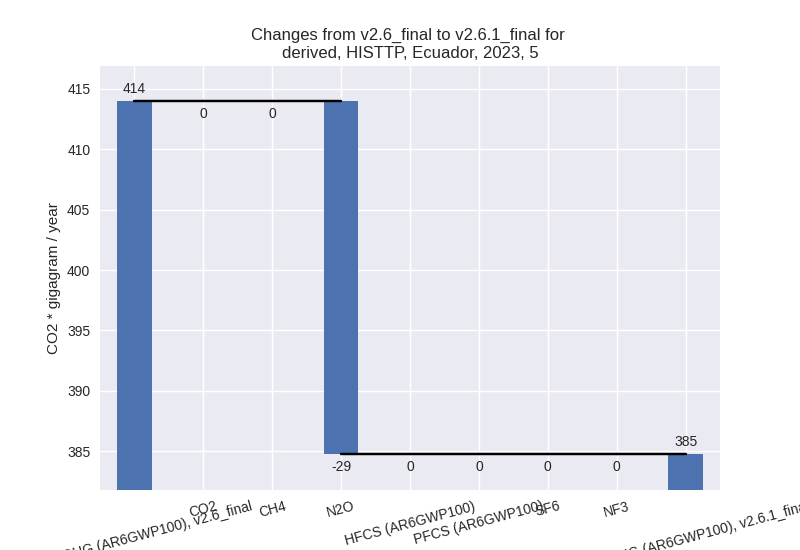
For 1990-2023 the changes per gas are: