Changes in PRIMAP-hist v2.6.1_final compared to v2.6_final for Egypt
2025-03-19
Johannes Gütschow
Change analysis for Egypt for PRIMAP-hist v2.6.1_final compared to v2.6_final
Overview over emissions by sector and gas
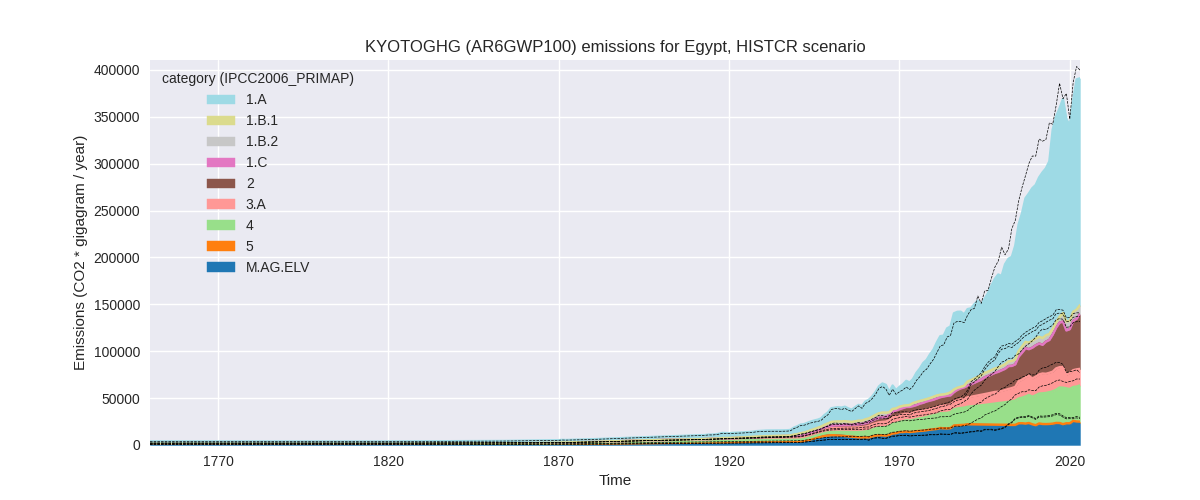
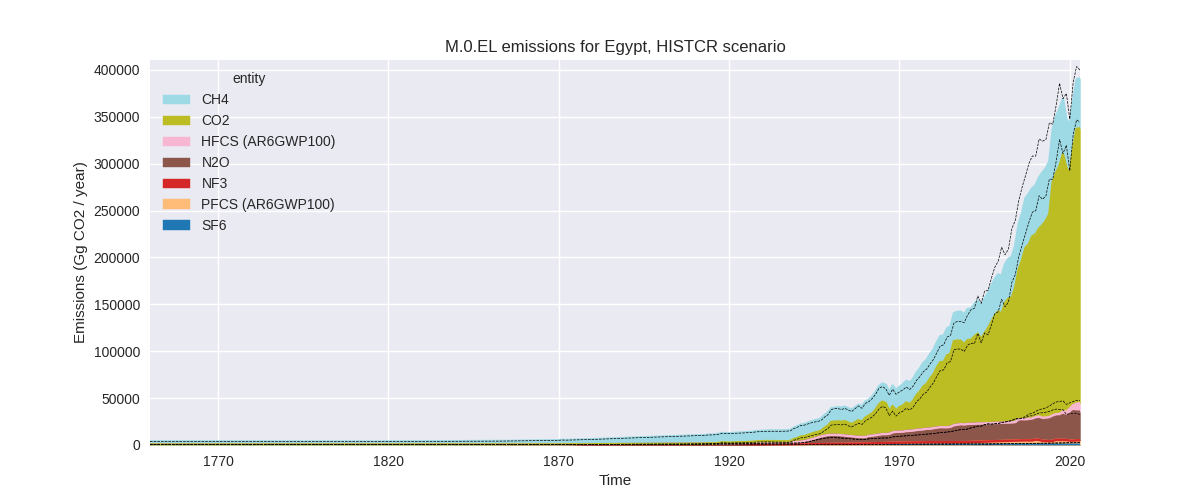
The following figures show the aggregate national total emissions excluding LULUCF AR6GWP100 for the country reported priority scenario. The dotted linesshow the v2.6_final data.
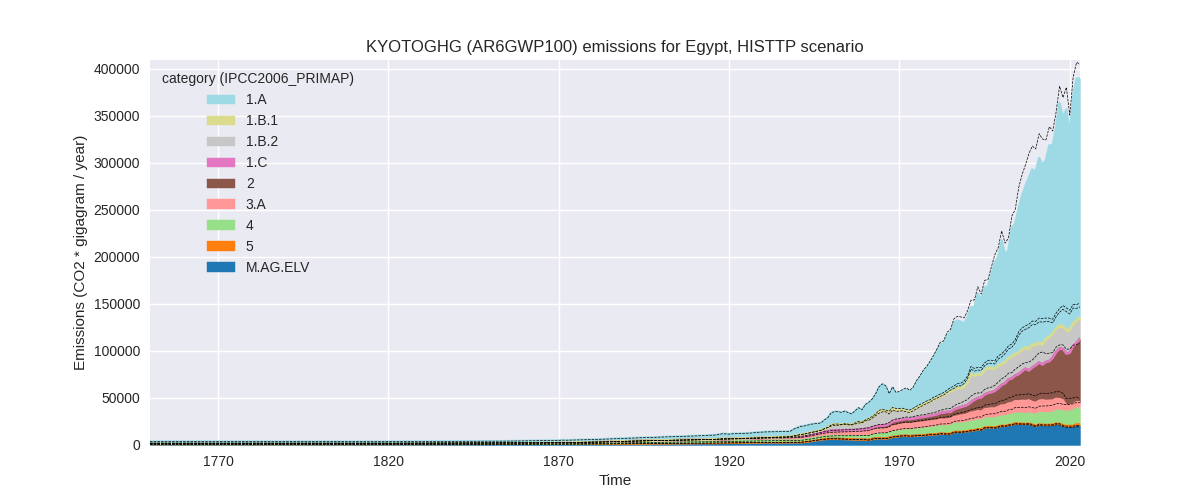
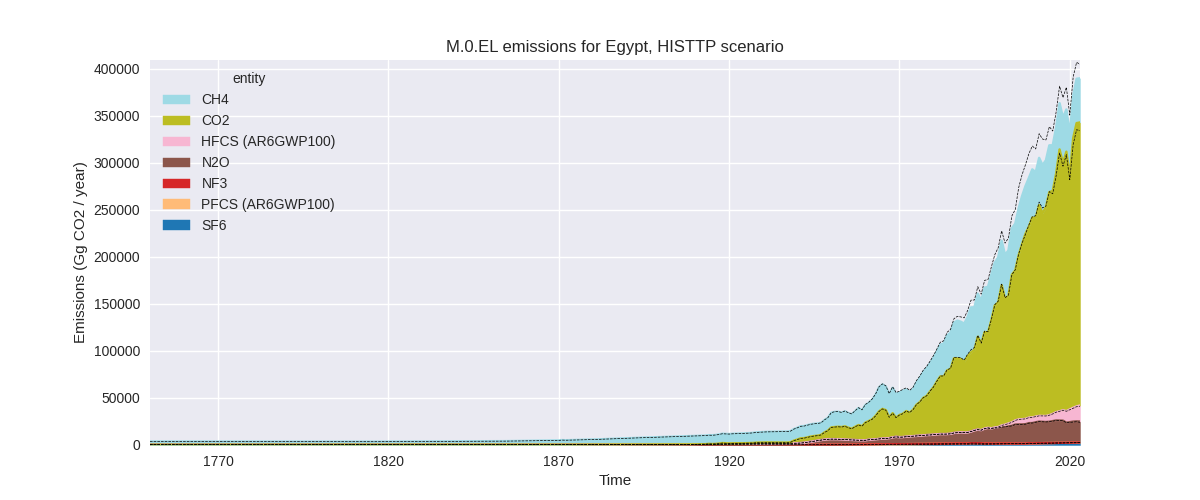
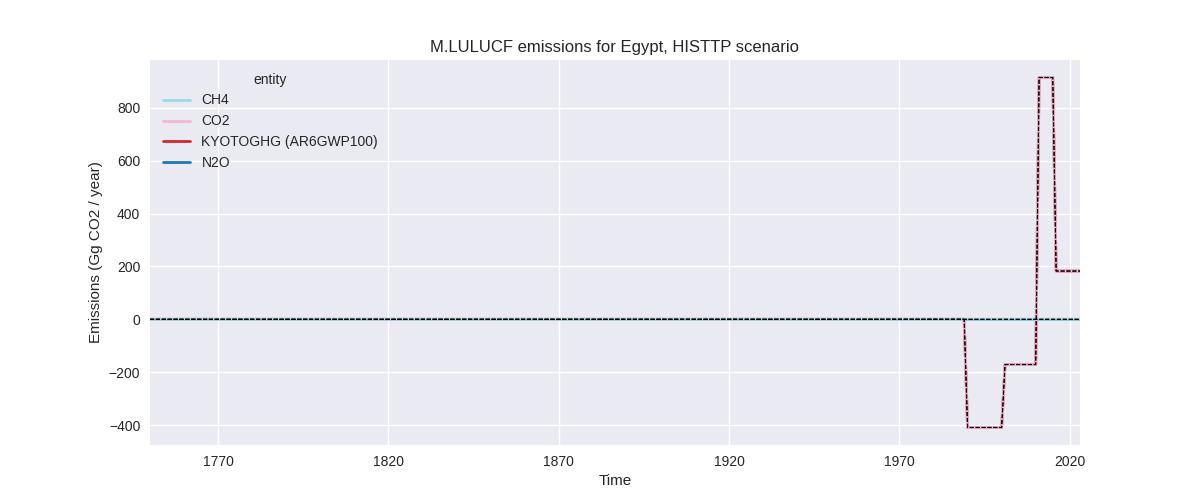
The following figures show the aggregate national total emissions excluding LULUCF AR6GWP100 for the third party priority scenario. The dotted linesshow the v2.6_final data.
Overview over changes
In the country reported priority scenario we have the following changes for aggregate Kyoto GHG and national total emissions excluding LULUCF (M.0.EL):
- Emissions in 2023 have changed by -2.2%% (-8748.98 Gg CO2 / year)
- Emissions in 1990-2023 have changed by -6.4%% (-17358.20 Gg CO2 / year)
In the third party priority scenario we have the following changes for aggregate Kyoto GHG and national total emissions excluding LULUCF (M.0.EL):
- Emissions in 2023 have changed by -3.7%% (-14868.66 Gg CO2 / year)
- Emissions in 1990-2023 have changed by -5.9%% (-16157.07 Gg CO2 / year)
Most important changes per scenario and time frame
In the country reported priority scenario the following sector-gas combinations have the highest absolute impact on national total KyotoGHG (AR6GWP100) emissions in 2023 (top 5):
- 1: 1.A, CO2 with -17440.41 Gg CO2 / year (-6.8%)
- 2: 2, CO2 with 10426.01 Gg CO2 / year (31.8%)
- 3: 3.A, CH4 with 5810.58 Gg CO2 / year (133.4%)
- 4: 2, HFCS (AR6GWP100) with -5696.57 Gg CO2 / year (-38.5%)
- 5: 3.A, N2O with 5053.78 Gg CO2 / year (209.1%)
In the country reported priority scenario the following sector-gas combinations have the highest absolute impact on national total KyotoGHG (AR6GWP100) emissions in 1990-2023 (top 5):
- 1: 1.A, CO2 with -8430.25 Gg CO2 / year (-5.5%)
- 2: 1.B.2, CH4 with -5445.29 Gg CO2 / year (-83.4%)
- 3: 2, PFCS (AR6GWP100) with 3795.52 Gg CO2 / year (791.4%)
- 4: 1.B.1, CH4 with -3478.75 Gg CO2 / year (-100.0%)
- 5: 2, N2O with -2909.94 Gg CO2 / year (-75.3%)
In the third party priority scenario the following sector-gas combinations have the highest absolute impact on national total KyotoGHG (AR6GWP100) emissions in 2023 (top 5):
- 1: 1.B.2, CH4 with -19423.64 Gg CO2 / year (-56.7%)
- 2: 2, CO2 with 8340.62 Gg CO2 / year (24.3%)
- 3: 4, CH4 with -7433.74 Gg CO2 / year (-32.8%)
- 4: 3.A, CH4 with 2513.49 Gg CO2 / year (69.1%)
- 5: M.AG.ELV, N2O with 1158.55 Gg CO2 / year (10.2%)
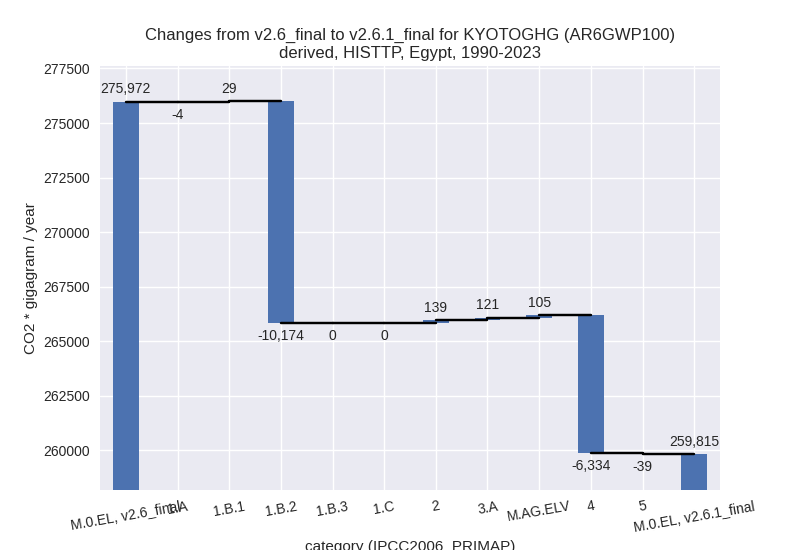
In the third party priority scenario the following sector-gas combinations have the highest absolute impact on national total KyotoGHG (AR6GWP100) emissions in 1990-2023 (top 5):
- 1: 1.B.2, CH4 with -10175.91 Gg CO2 / year (-36.6%)
- 2: 4, CH4 with -6334.48 Gg CO2 / year (-38.7%)
- 3: 2, CO2 with 147.88 Gg CO2 / year (0.7%)
- 4: 3.A, CH4 with 118.36 Gg CO2 / year (1.1%)
- 5: M.AG.ELV, N2O with 84.88 Gg CO2 / year (0.7%)
Notes on data changes
Here we list notes explaining important emissions changes for the country.
- CRT data from BTR1 has been added If covers 1990-2022 and replaces and extends BUR1 and DI data.
- Overall 2023 changes are small because higher individual sector
changes cancel.
- Lower emissions in the energy CO2 sector come from lower 2020-2022 growth rates in CRT than in EI data.
- HFC emissions are much lower in the CRT data than in previous country reported inventories.
- Livestock emissions are higher because CRT data is higher than FAO that was used to extrapolate older country inventories.
- CO2 from mineral industry is higher in the new country reported data.
- For cumulative emissions energy CO2, CH4 from 1.B.2 and 1.B.1 are the main causes for lower emission partly offset by higher PFC emissions. All changes are due to the CRT data.
- The changes in the TP time series are mostly due to lower data for CH4 in 1.B.2 and the waste sector in the new EDGAR data.
Changes by sector and gas
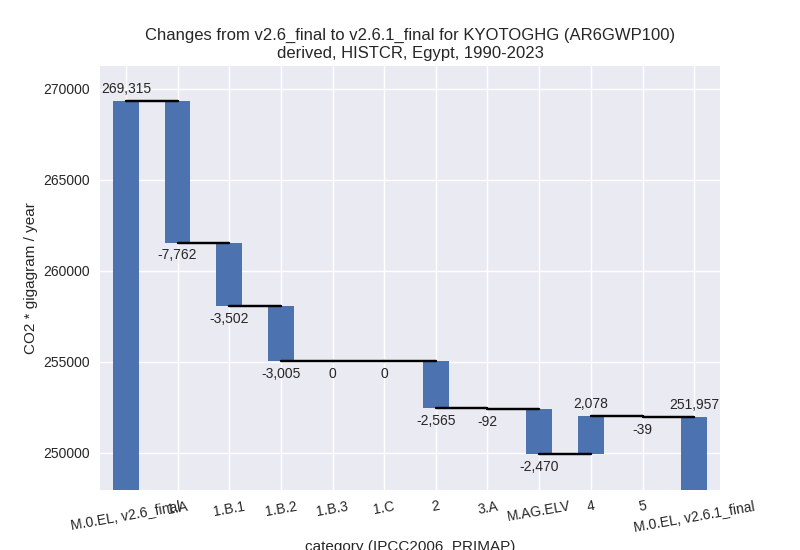
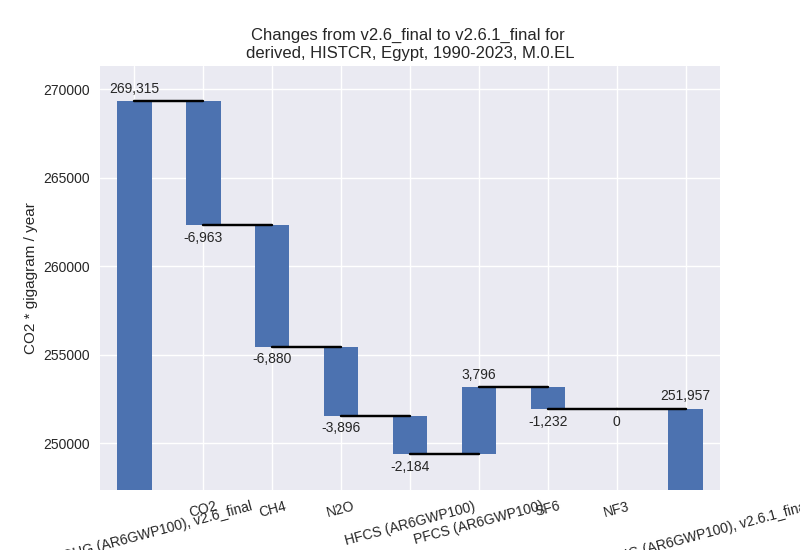
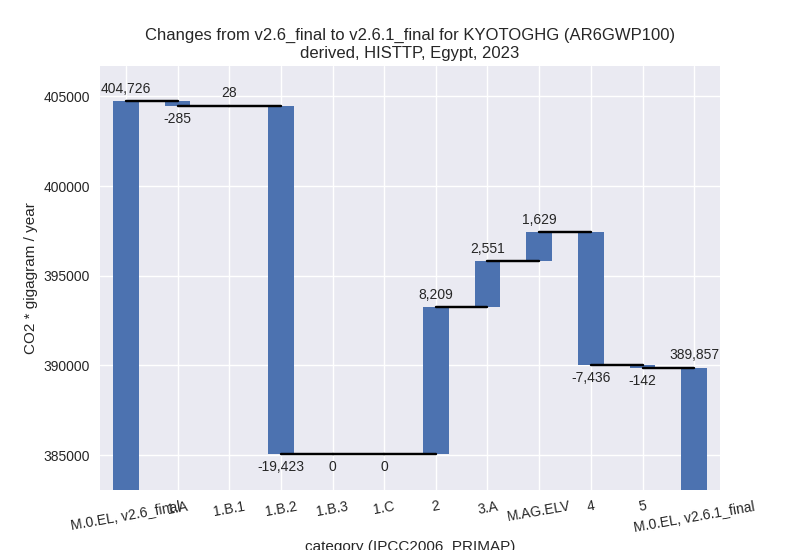
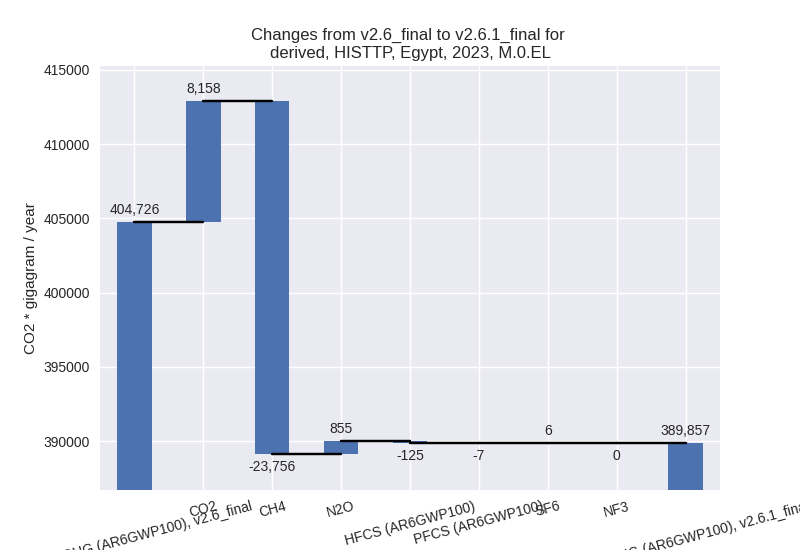
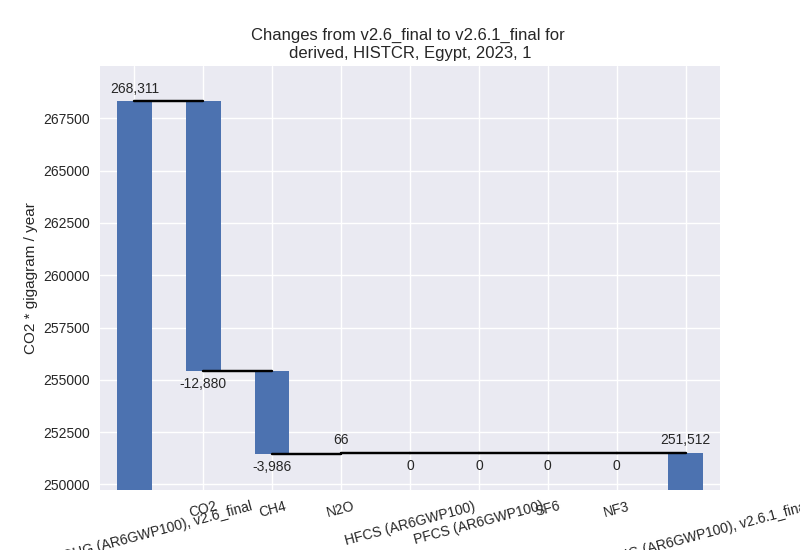
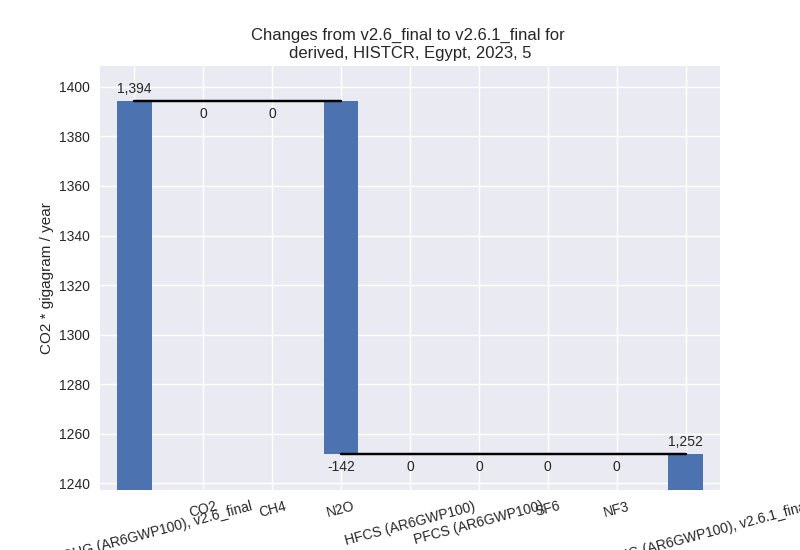
For each scenario and time frame the changes are displayed for all individual sectors and all individual gases. In the sector plot we use aggregate Kyoto GHGs in AR6GWP100. In the gas plot we usenational total emissions without LULUCF.
country reported scenario
2023
1990-2023
third party scenario
2023
1990-2023

Detailed changes for the scenarios:
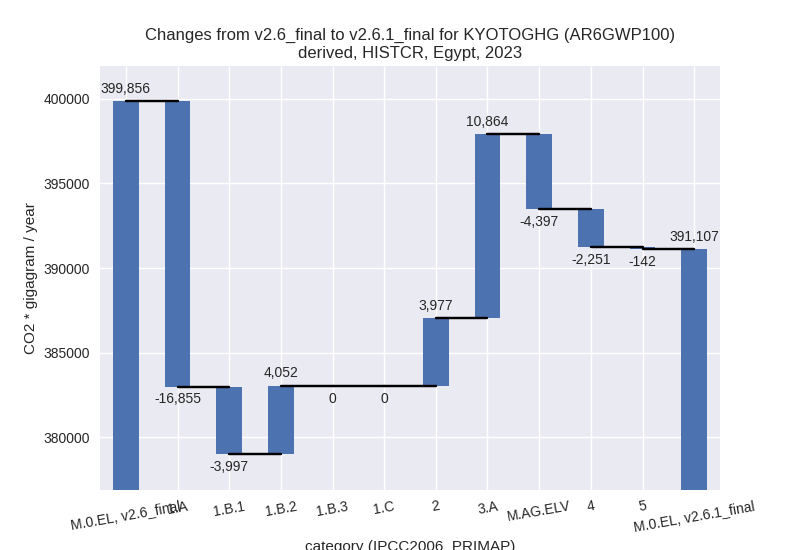
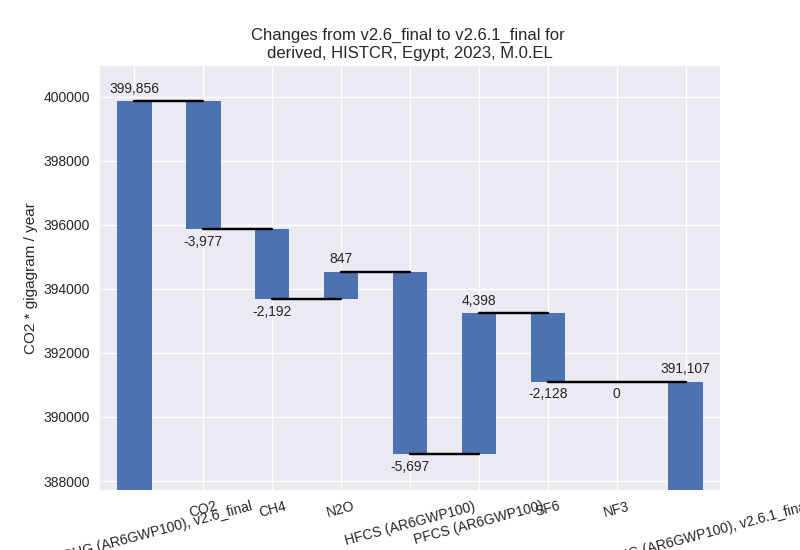
country reported scenario (HISTCR):
Most important changes per time frame
For 2023 the following sector-gas combinations have the highest absolute impact on national total KyotoGHG (AR6GWP100) emissions in 2023 (top 5):
- 1: 1.A, CO2 with -17440.41 Gg CO2 / year (-6.8%)
- 2: 2, CO2 with 10426.01 Gg CO2 / year (31.8%)
- 3: 3.A, CH4 with 5810.58 Gg CO2 / year (133.4%)
- 4: 2, HFCS (AR6GWP100) with -5696.57 Gg CO2 / year (-38.5%)
- 5: 3.A, N2O with 5053.78 Gg CO2 / year (209.1%)
For 1990-2023 the following sector-gas combinations have the highest absolute impact on national total KyotoGHG (AR6GWP100) emissions in 1990-2023 (top 5):
- 1: 1.A, CO2 with -8430.25 Gg CO2 / year (-5.5%)
- 2: 1.B.2, CH4 with -5445.29 Gg CO2 / year (-83.4%)
- 3: 2, PFCS (AR6GWP100) with 3795.52 Gg CO2 / year (791.4%)
- 4: 1.B.1, CH4 with -3478.75 Gg CO2 / year (-100.0%)
- 5: 2, N2O with -2909.94 Gg CO2 / year (-75.3%)
Changes in the main sectors for aggregate KyotoGHG (AR6GWP100) are
- 1: Total sectoral emissions in 2022 are 255272.04
Gg CO2 / year which is 65.5% of M.0.EL emissions. 2023 Emissions have
changed by -6.3% (-16799.62 Gg CO2 /
year). 1990-2023 Emissions have changed by -8.5% (-14269.30 Gg CO2 / year). For 2023
the changes per gas
are:
For 1990-2023 the changes per gas are: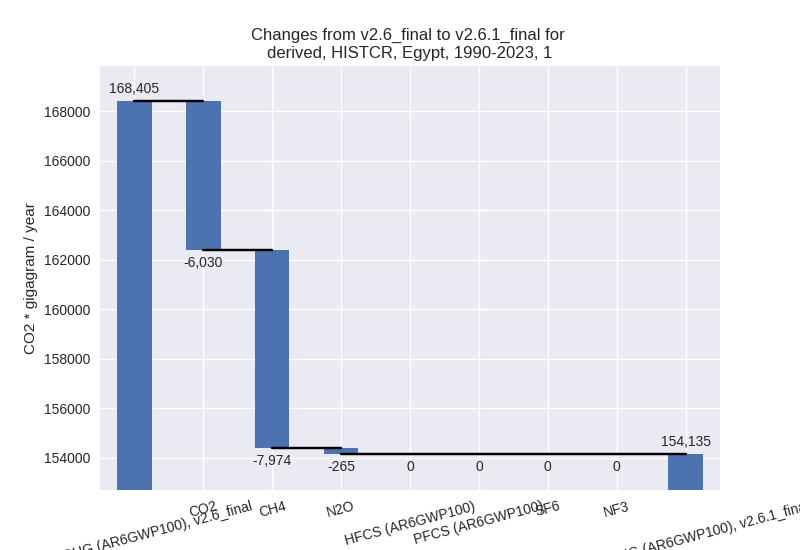
The changes come from the following subsectors:- 1.A: Total sectoral emissions in 2022 are 245657.80
Gg CO2 / year which is 96.2% of category 1 emissions. 2023 Emissions
have changed by -6.5% (-16854.89 Gg
CO2 / year). 1990-2023 Emissions have changed by -5.0% (-7762.17 Gg CO2 / year). For 2023
the changes per gas
are:
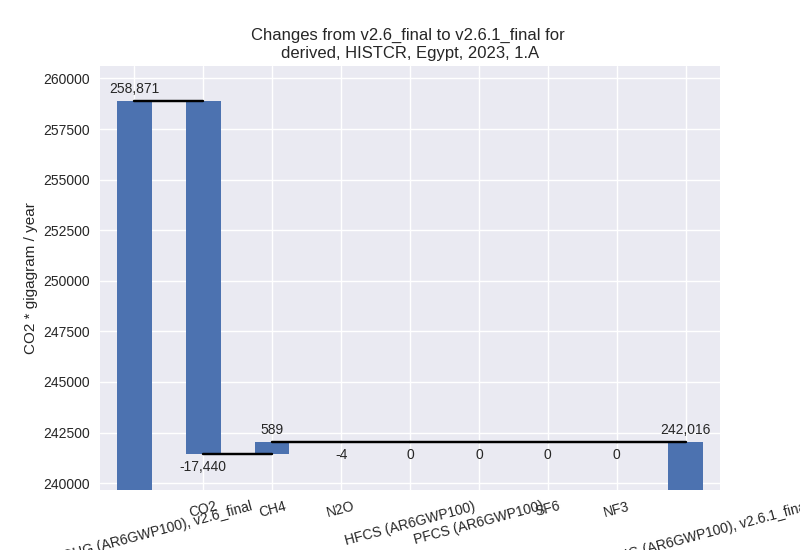
For 1990-2023 the changes per gas are: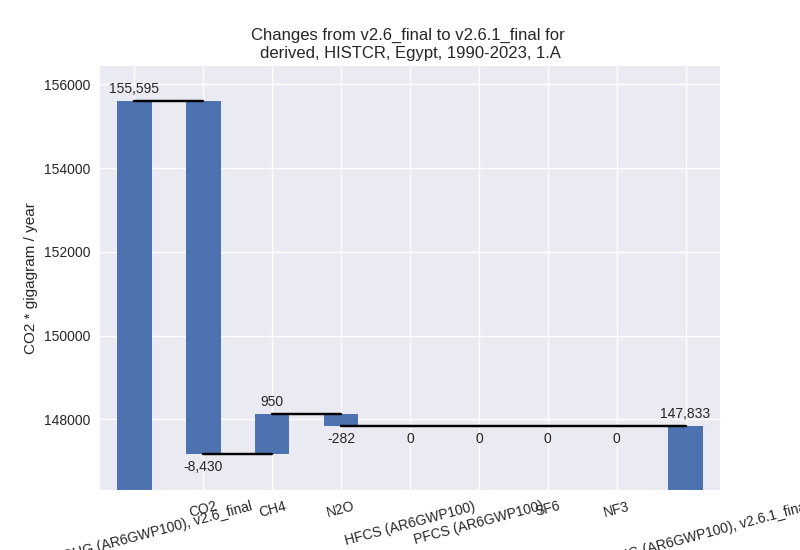
There is no subsector information available in PRIMAP-hist. - 1.B.1: Total sectoral emissions in 2022 are 52.97
Gg CO2 / year which is 0.0% of category 1 emissions. 2023 Emissions have
changed by -98.7% (-3997.07 Gg CO2 /
year). 1990-2023 Emissions have changed by -98.7% (-3502.26 Gg CO2 / year). For 2023
the changes per gas
are:
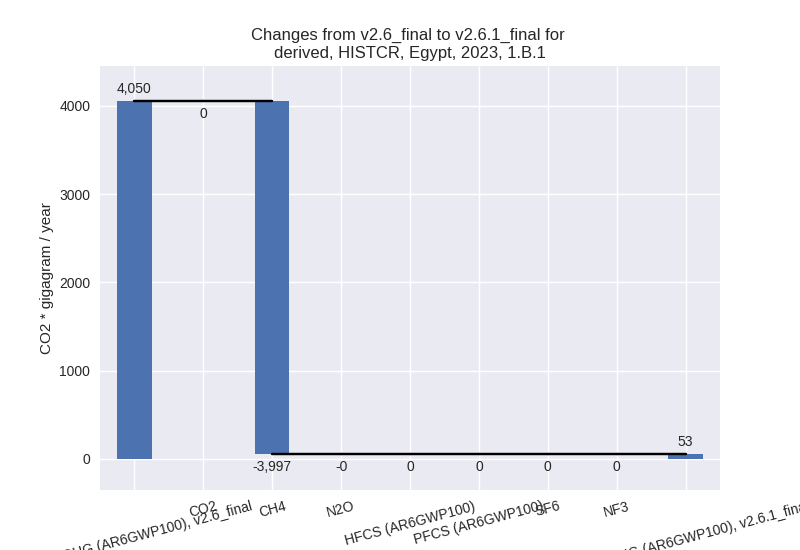
For 1990-2023 the changes per gas are:
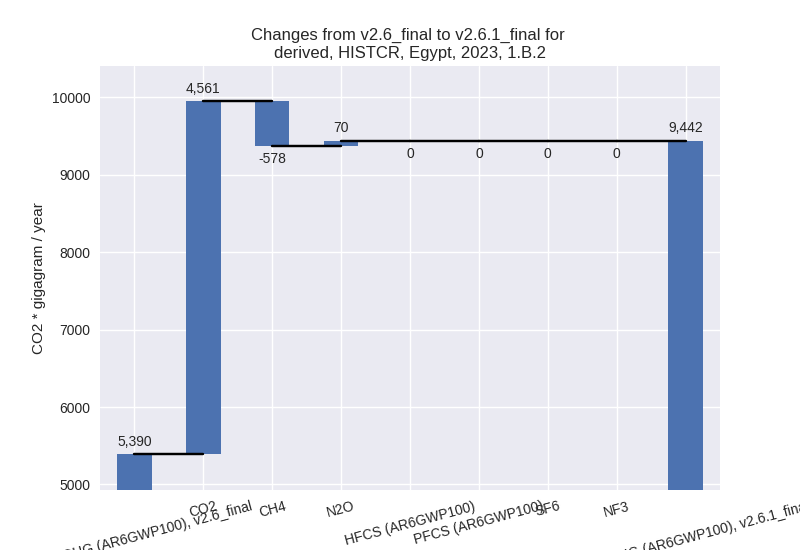
There is no subsector information available in PRIMAP-hist. - 1.B.2: Total sectoral emissions in 2022 are 9561.27
Gg CO2 / year which is 3.7% of category 1 emissions. 2023 Emissions have
changed by 75.2% (4052.34 Gg CO2 /
year). 1990-2023 Emissions have changed by -32.4% (-3004.87 Gg CO2 / year). For 2023
the changes per gas
are:
For 1990-2023 the changes per gas are: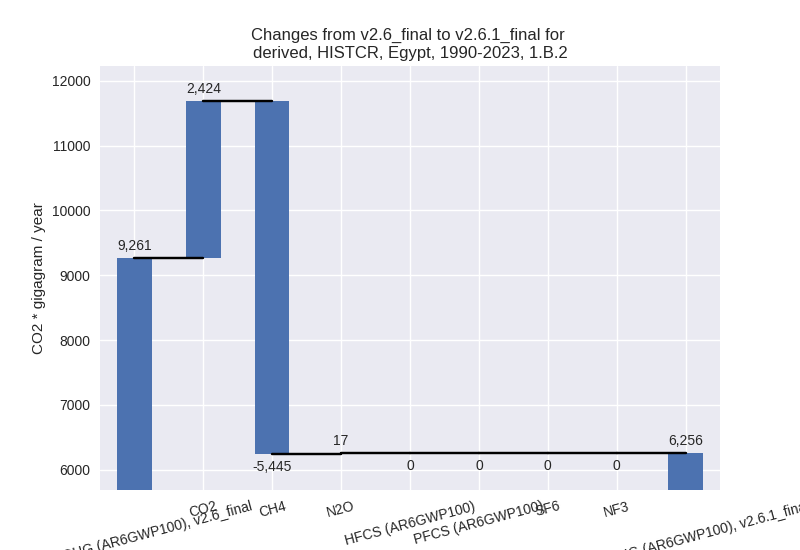
There is no subsector information available in PRIMAP-hist.
- 1.A: Total sectoral emissions in 2022 are 245657.80
Gg CO2 / year which is 96.2% of category 1 emissions. 2023 Emissions
have changed by -6.5% (-16854.89 Gg
CO2 / year). 1990-2023 Emissions have changed by -5.0% (-7762.17 Gg CO2 / year). For 2023
the changes per gas
are:
- 2: Total sectoral emissions in 2022 are 53999.45 Gg
CO2 / year which is 13.8% of M.0.EL emissions. 2023 Emissions have
changed by 7.3% (3977.27 Gg CO2 /
year). 1990-2023 Emissions have changed by -7.8% (-2564.86 Gg CO2 / year). For 2023
the changes per gas
are:
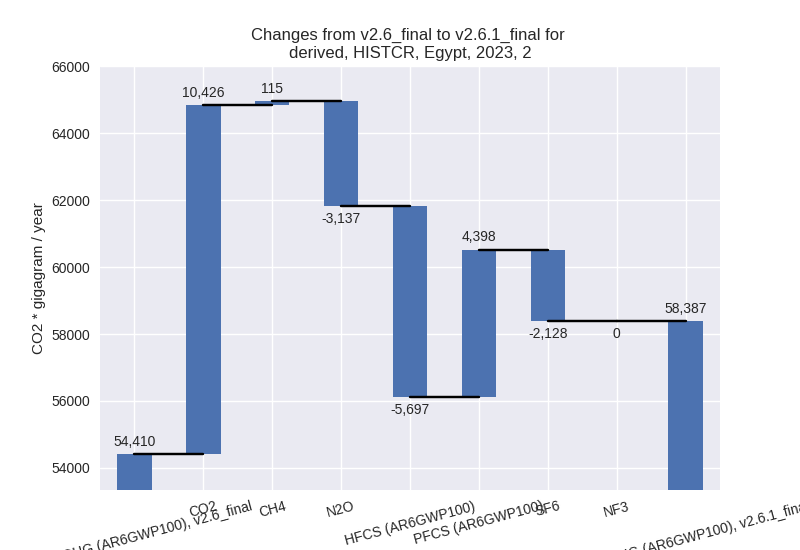
For 1990-2023 the changes per gas are: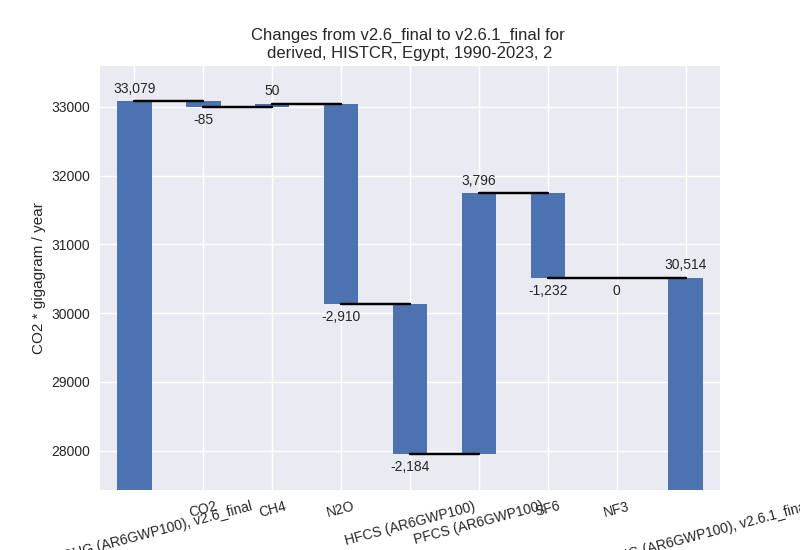
- M.AG: Total sectoral emissions in 2022 are 42240.50
Gg CO2 / year which is 10.8% of M.0.EL emissions. 2023 Emissions have
changed by 18.6% (6467.08 Gg CO2 /
year). 1990-2023 Emissions have changed by -6.3% (-2562.46 Gg CO2 / year). For 2023
the changes per gas
are:
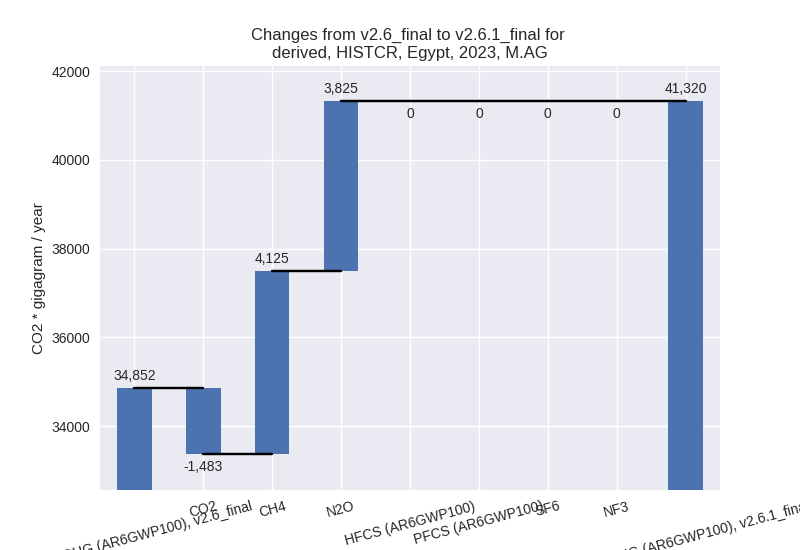
For 1990-2023 the changes per gas are: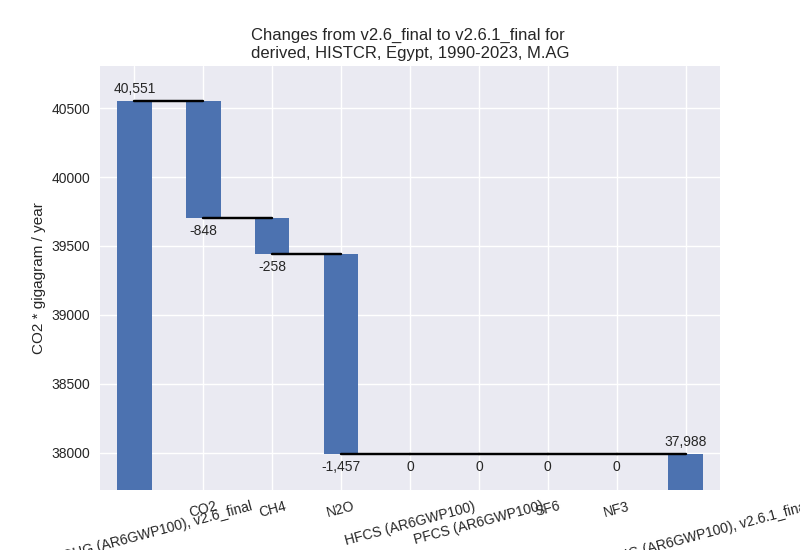
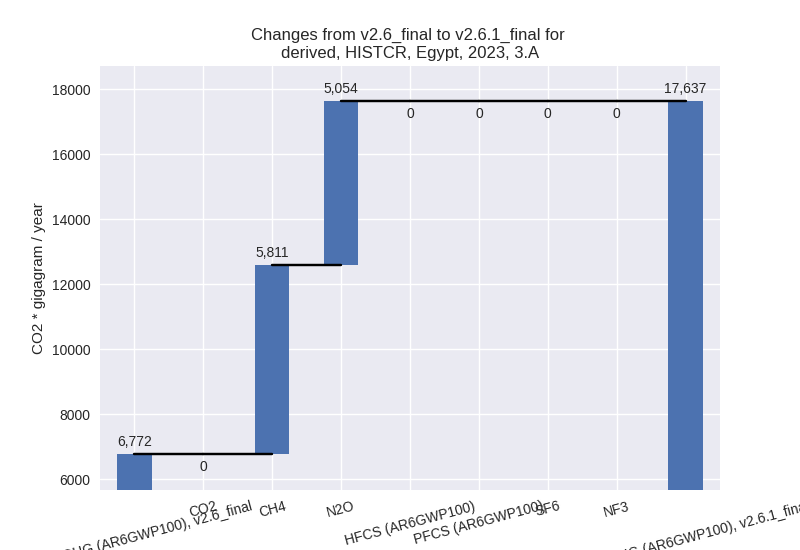
The changes come from the following subsectors:- 3.A: Total sectoral emissions in 2022 are 18387.98
Gg CO2 / year which is 43.5% of category M.AG emissions. 2023 Emissions
have changed by 160.4% (10864.35 Gg
CO2 / year). 1990-2023 Emissions have changed by -0.6% (-92.32 Gg CO2 / year). For 2023 the
changes per gas
are:
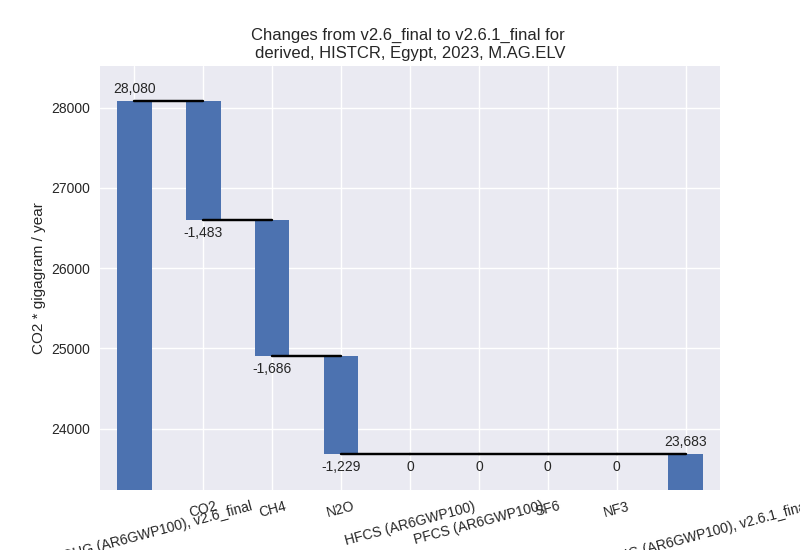
There is no subsector information available in PRIMAP-hist. - M.AG.ELV: Total sectoral emissions in 2022 are
23852.52 Gg CO2 / year which is 56.5% of category M.AG emissions. 2023
Emissions have changed by -15.7%
(-4397.27 Gg CO2 / year). 1990-2023 Emissions have changed by -10.2% (-2470.14 Gg CO2 / year). For 2023
the changes per gas
are:
For 1990-2023 the changes per gas are: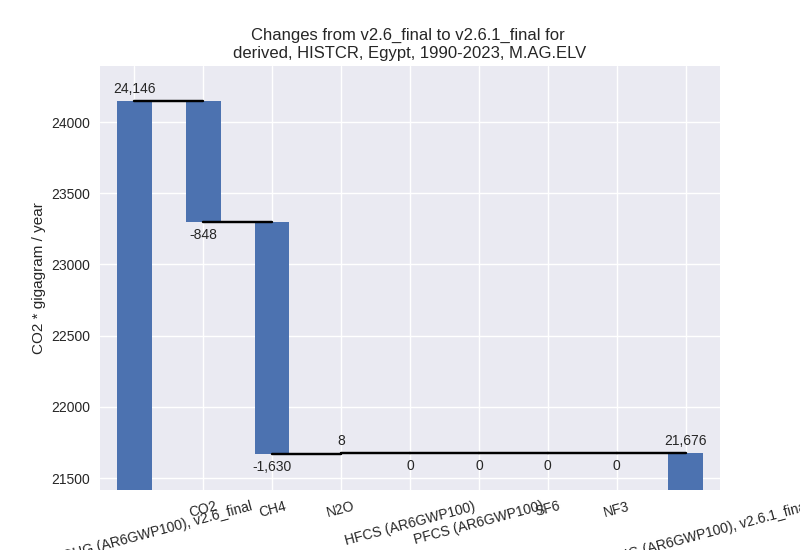
There is no subsector information available in PRIMAP-hist.
- 3.A: Total sectoral emissions in 2022 are 18387.98
Gg CO2 / year which is 43.5% of category M.AG emissions. 2023 Emissions
have changed by 160.4% (10864.35 Gg
CO2 / year). 1990-2023 Emissions have changed by -0.6% (-92.32 Gg CO2 / year). For 2023 the
changes per gas
are:
- 4: Total sectoral emissions in 2022 are 37191.70 Gg
CO2 / year which is 9.5% of M.0.EL emissions. 2023 Emissions have
changed by -5.5% (-2251.29 Gg CO2 /
year). 1990-2023 Emissions have changed by 7.9% (2077.84 Gg CO2 / year). For 2023 the
changes per gas
are:
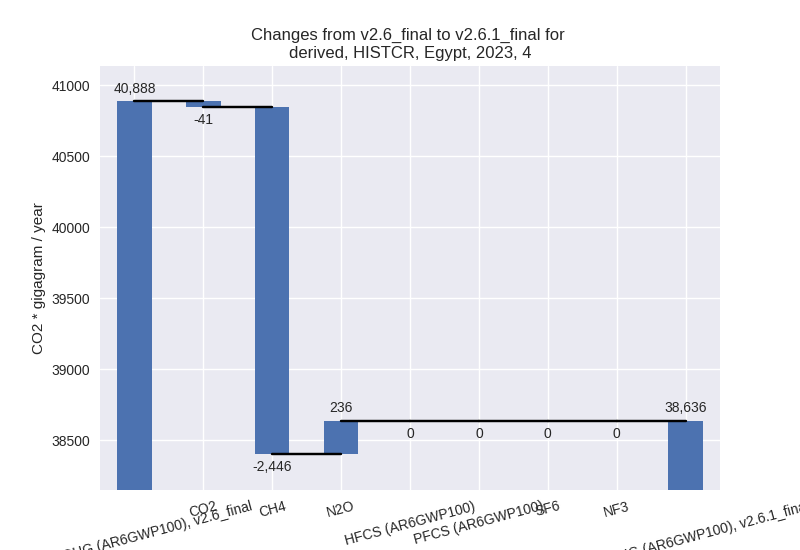
For 1990-2023 the changes per gas are: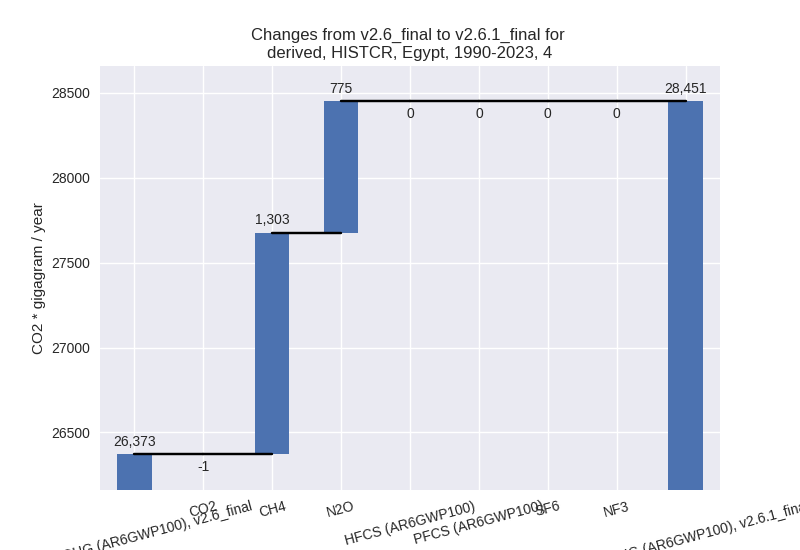
- 5: Total sectoral emissions in 2022 are 1247.52 Gg
CO2 / year which is 0.3% of M.0.EL emissions. 2023 Emissions have
changed by -10.2% (-142.42 Gg CO2 /
year). 1990-2023 Emissions have changed by -4.3% (-39.42 Gg CO2 / year). For 2023 the
changes per gas
are:
For 1990-2023 the changes per gas are:
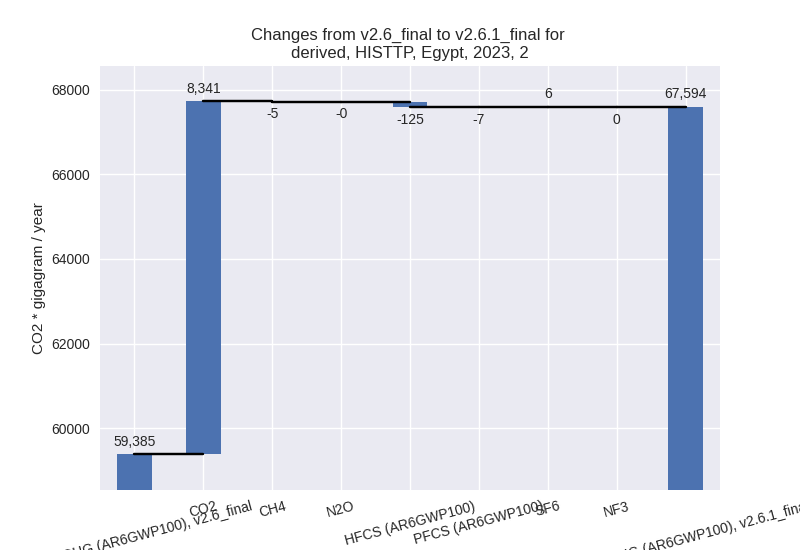
third party scenario (HISTTP):
Most important changes per time frame
For 2023 the following sector-gas combinations have the highest absolute impact on national total KyotoGHG (AR6GWP100) emissions in 2023 (top 5):
- 1: 1.B.2, CH4 with -19423.64 Gg CO2 / year (-56.7%)
- 2: 2, CO2 with 8340.62 Gg CO2 / year (24.3%)
- 3: 4, CH4 with -7433.74 Gg CO2 / year (-32.8%)
- 4: 3.A, CH4 with 2513.49 Gg CO2 / year (69.1%)
- 5: M.AG.ELV, N2O with 1158.55 Gg CO2 / year (10.2%)
For 1990-2023 the following sector-gas combinations have the highest absolute impact on national total KyotoGHG (AR6GWP100) emissions in 1990-2023 (top 5):
- 1: 1.B.2, CH4 with -10175.91 Gg CO2 / year (-36.6%)
- 2: 4, CH4 with -6334.48 Gg CO2 / year (-38.7%)
- 3: 2, CO2 with 147.88 Gg CO2 / year (0.7%)
- 4: 3.A, CH4 with 118.36 Gg CO2 / year (1.1%)
- 5: M.AG.ELV, N2O with 84.88 Gg CO2 / year (0.7%)
Changes in the main sectors for aggregate KyotoGHG (AR6GWP100) are
- 1: Total sectoral emissions in 2022 are 281115.57
Gg CO2 / year which is 72.2% of M.0.EL emissions. 2023 Emissions have
changed by -6.6% (-19680.08 Gg CO2 /
year). 1990-2023 Emissions have changed by -5.3% (-10149.88 Gg CO2 / year). For 2023
the changes per gas
are:

For 1990-2023 the changes per gas are: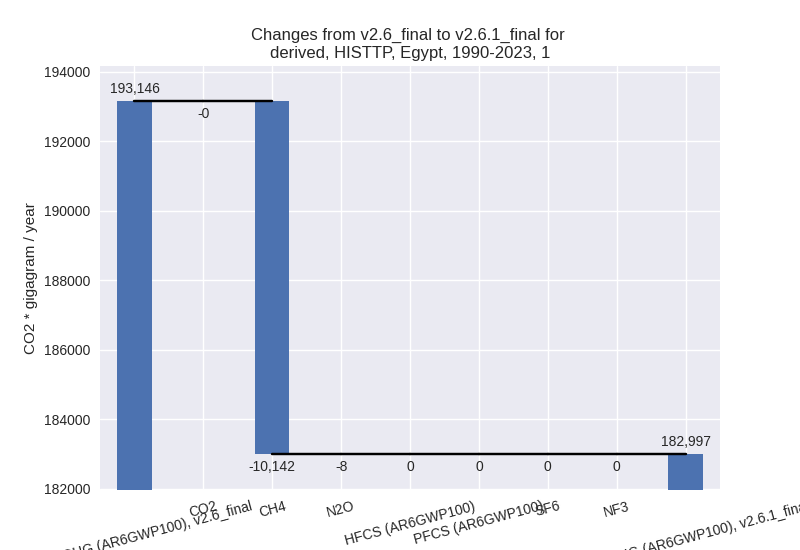
The changes come from the following subsectors:- 1.A: Total sectoral emissions in 2022 are 257298.03 Gg CO2 / year which is 91.5% of category 1 emissions. 2023 Emissions have changed by -0.1% (-285.39 Gg CO2 / year). 1990-2023 Emissions have changed by -0.0% (-4.22 Gg CO2 / year).
- 1.B.1: Total sectoral emissions in 2022 are 4077.96 Gg CO2 / year which is 1.5% of category 1 emissions. 2023 Emissions have changed by 0.7% (27.99 Gg CO2 / year). 1990-2023 Emissions have changed by 0.8% (28.84 Gg CO2 / year).
- 1.B.2: Total sectoral emissions in 2022 are
19739.58 Gg CO2 / year which is 7.0% of category 1 emissions. 2023
Emissions have changed by -50.2%
(-19422.68 Gg CO2 / year). 1990-2023 Emissions have changed by -33.0% (-10174.50 Gg CO2 / year). For 2023
the changes per gas
are:

For 1990-2023 the changes per gas are: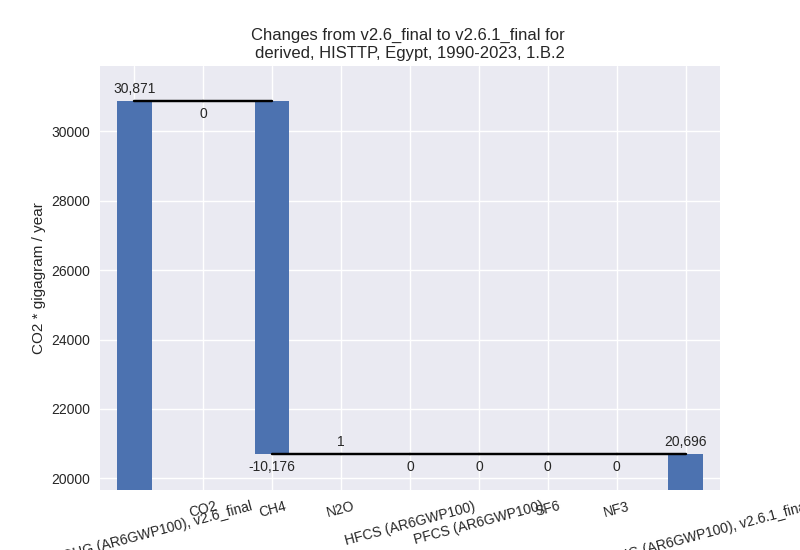
There is no subsector information available in PRIMAP-hist.
- 2: Total sectoral emissions in 2022 are 62755.99 Gg
CO2 / year which is 16.1% of M.0.EL emissions. 2023 Emissions have
changed by 13.8% (8209.27 Gg CO2 /
year). 1990-2023 Emissions have changed by 0.4% (139.33 Gg CO2 / year). For 2023 the
changes per gas
are:
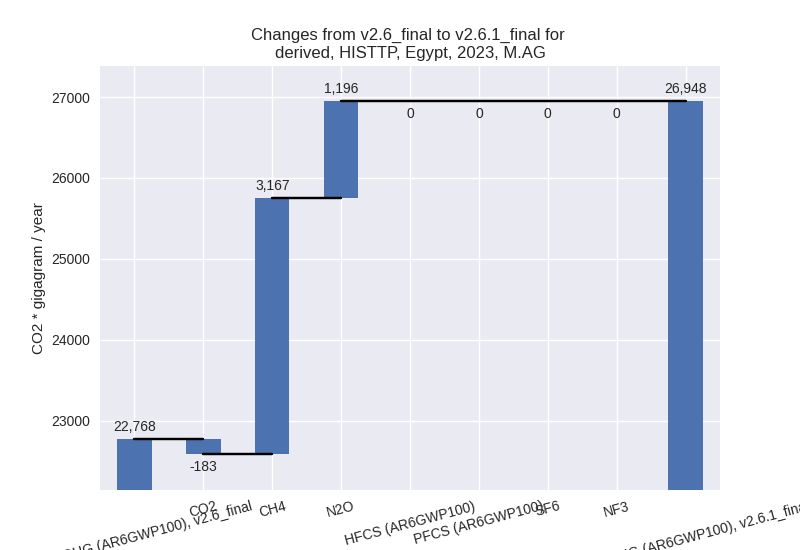
- M.AG: Total sectoral emissions in 2022 are 27631.83
Gg CO2 / year which is 7.1% of M.0.EL emissions. 2023 Emissions have
changed by 18.4% (4180.16 Gg CO2 /
year). 1990-2023 Emissions have changed by 0.7% (226.56 Gg CO2 / year). For 2023 the
changes per gas
are:
The changes come from the following subsectors:- 3.A: Total sectoral emissions in 2022 are 6888.85
Gg CO2 / year which is 24.9% of category M.AG emissions. 2023 Emissions
have changed by 69.1% (2550.85 Gg
CO2 / year). 1990-2023 Emissions have changed by 1.1% (121.29 Gg CO2 / year). For 2023 the
changes per gas
are:
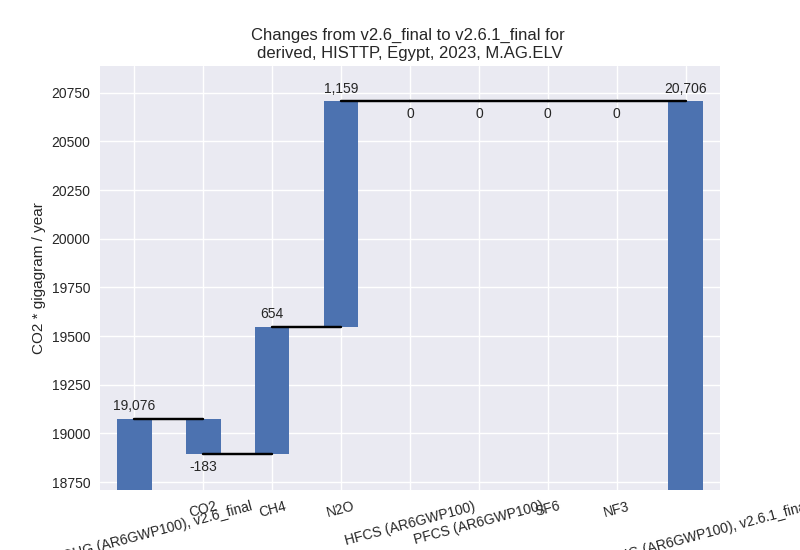
There is no subsector information available in PRIMAP-hist. - M.AG.ELV: Total sectoral emissions in 2022 are
20742.98 Gg CO2 / year which is 75.1% of category M.AG emissions. 2023
Emissions have changed by 8.5%
(1629.31 Gg CO2 / year). 1990-2023 Emissions have changed by 0.5% (105.27 Gg CO2 / year). For 2023 the
changes per gas
are:
There is no subsector information available in PRIMAP-hist.
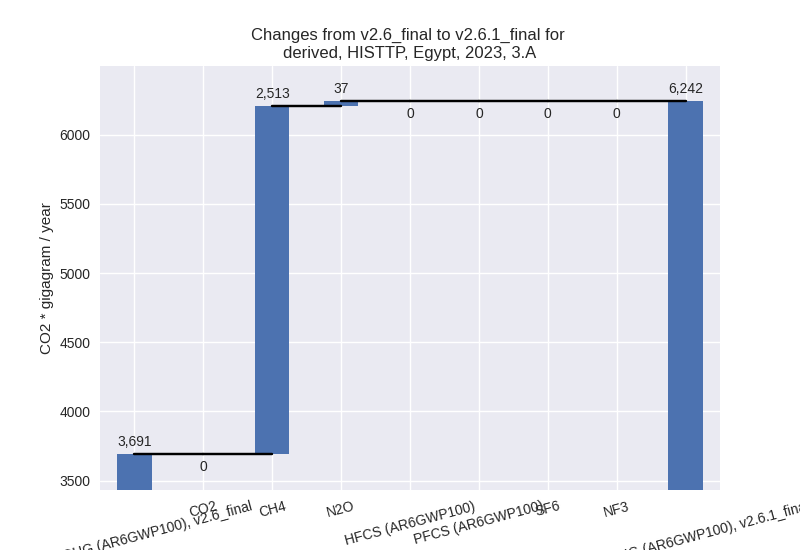
- 3.A: Total sectoral emissions in 2022 are 6888.85
Gg CO2 / year which is 24.9% of category M.AG emissions. 2023 Emissions
have changed by 69.1% (2550.85 Gg
CO2 / year). 1990-2023 Emissions have changed by 1.1% (121.29 Gg CO2 / year). For 2023 the
changes per gas
are:
- 4: Total sectoral emissions in 2022 are 16639.00 Gg
CO2 / year which is 4.3% of M.0.EL emissions. 2023 Emissions have
changed by -30.1% (-7435.59 Gg CO2 /
year). 1990-2023 Emissions have changed by -35.5% (-6333.67 Gg CO2 / year). For 2023
the changes per gas
are:

For 1990-2023 the changes per gas are:
- 5: Total sectoral emissions in 2022 are 1247.52 Gg
CO2 / year which is 0.3% of M.0.EL emissions. 2023 Emissions have
changed by -10.2% (-142.42 Gg CO2 /
year). 1990-2023 Emissions have changed by -4.3% (-39.42 Gg CO2 / year). For 2023 the
changes per gas
are:

For 1990-2023 the changes per gas are: