Changes in PRIMAP-hist v2.6.1_final compared to v2.6_final for Spain
2025-03-19
Johannes Gütschow
Change analysis for Spain for PRIMAP-hist v2.6.1_final compared to v2.6_final
Overview over emissions by sector and gas
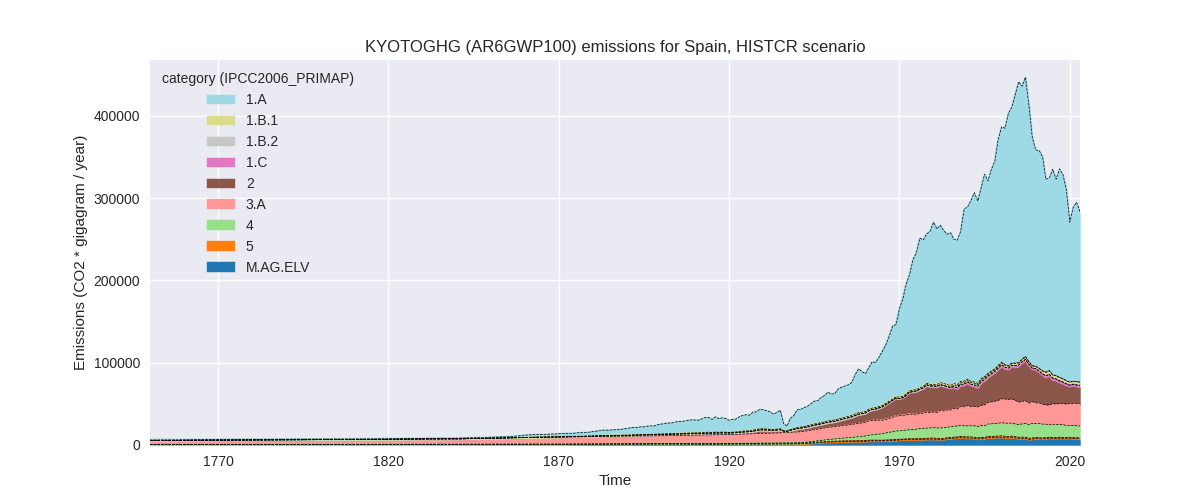
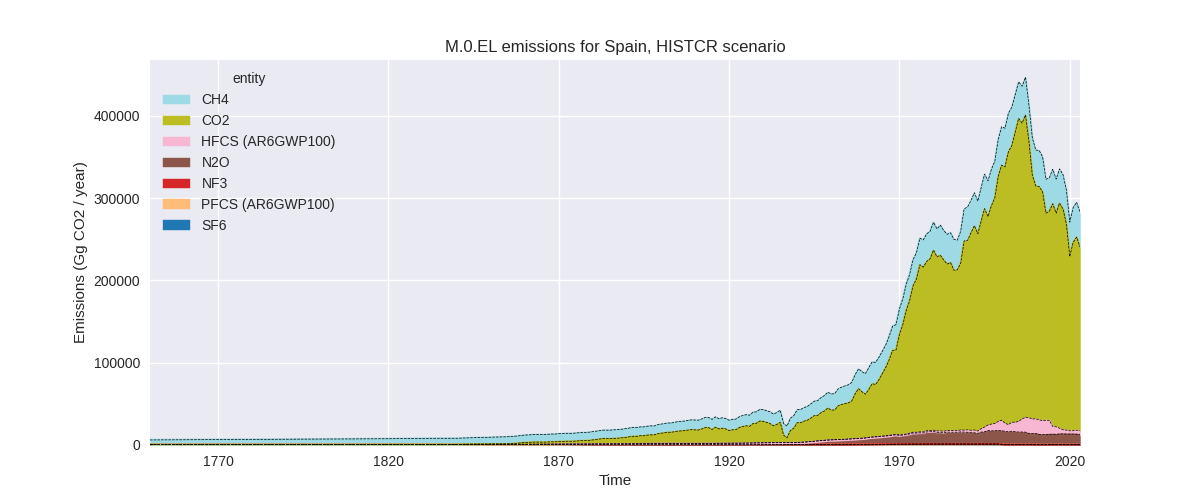
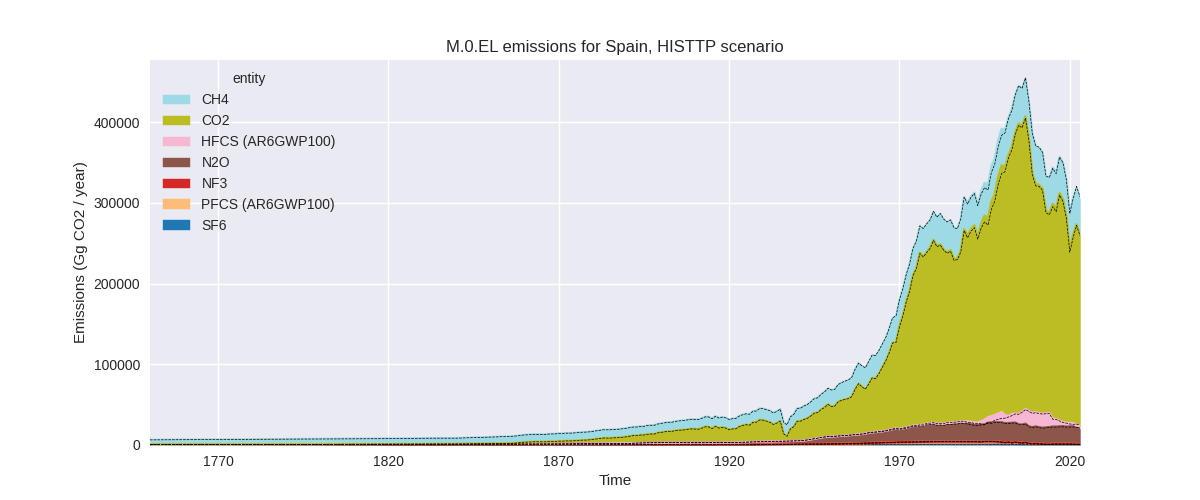
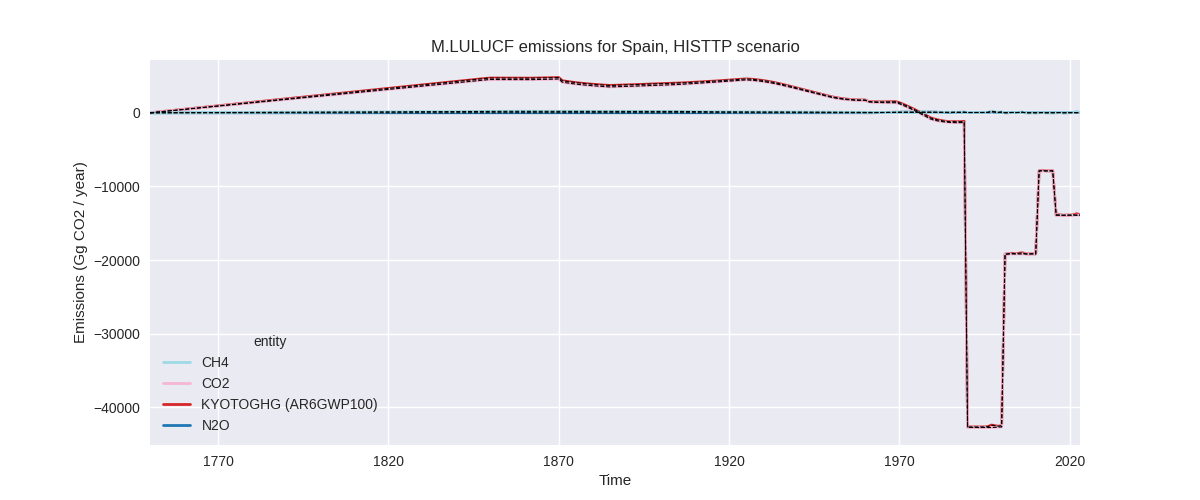
The following figures show the aggregate national total emissions excluding LULUCF AR6GWP100 for the country reported priority scenario. The dotted linesshow the v2.6_final data.
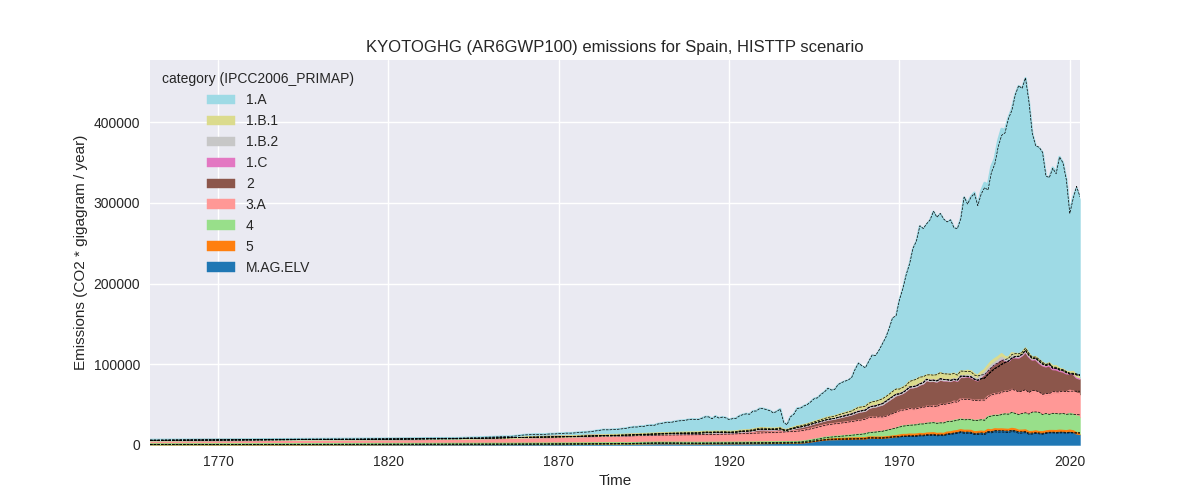
The following figures show the aggregate national total emissions excluding LULUCF AR6GWP100 for the third party priority scenario. The dotted linesshow the v2.6_final data.
Overview over changes
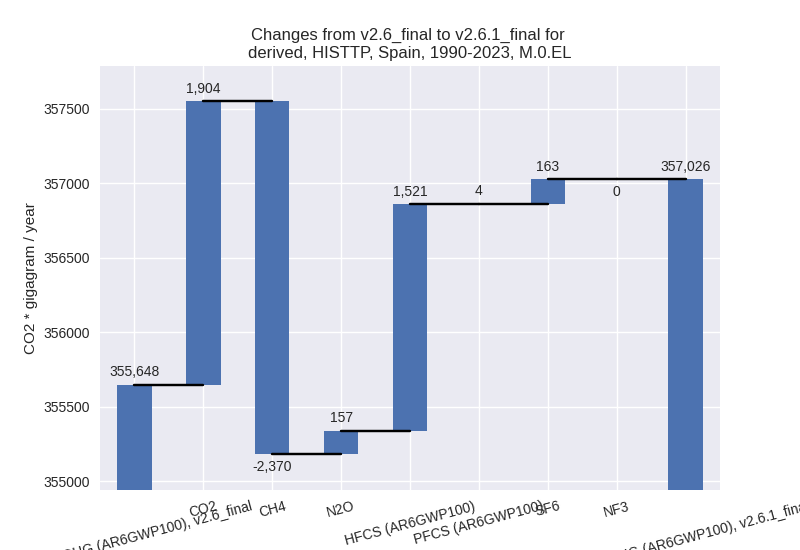
In the country reported priority scenario we have the following changes for aggregate Kyoto GHG and national total emissions excluding LULUCF (M.0.EL):
- Emissions in 2023 have changed by -0.7%% (-2012.88 Gg CO2 / year)
- Emissions in 1990-2023 have changed by -0.4%% (-1497.30 Gg CO2 / year)
In the third party priority scenario we have the following changes for aggregate Kyoto GHG and national total emissions excluding LULUCF (M.0.EL):
- Emissions in 2023 have changed by -1.0%% (-3149.76 Gg CO2 / year)
- Emissions in 1990-2023 have changed by 0.4%% (1378.68 Gg CO2 / year)
Most important changes per scenario and time frame
In the country reported priority scenario the following sector-gas combinations have the highest absolute impact on national total KyotoGHG (AR6GWP100) emissions in 2023 (top 5):
- 1: 5, N2O with -760.17 Gg CO2 / year (-100.0%)
- 2: 3.A, CH4 with -554.44 Gg CO2 / year (-2.1%)
- 3: 4, CH4 with -463.64 Gg CO2 / year (-3.5%)
- 4: M.AG.ELV, N2O with -337.71 Gg CO2 / year (-4.8%)
- 5: 2, CO2 with -292.98 Gg CO2 / year (-1.8%)
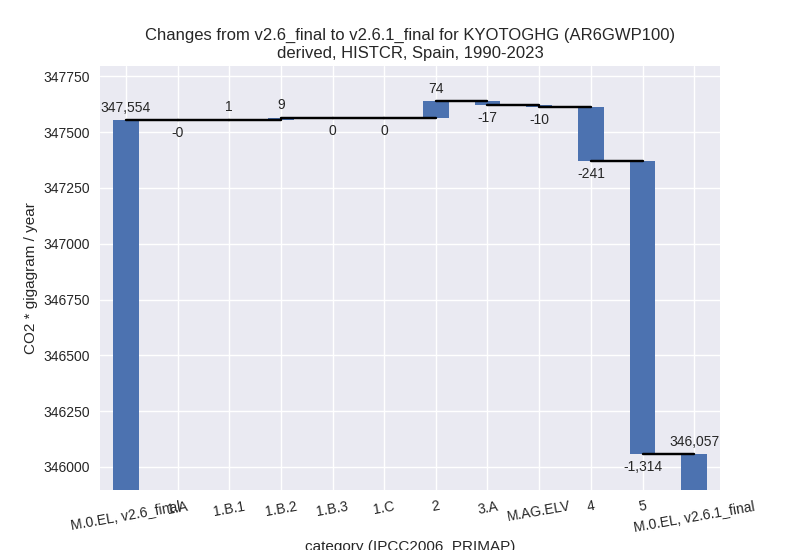
In the country reported priority scenario the following sector-gas combinations have the highest absolute impact on national total KyotoGHG (AR6GWP100) emissions in 1990-2023 (top 5):
- 1: 5, N2O with -1313.97 Gg CO2 / year (-100.0%)
- 2: 4, CH4 with -236.32 Gg CO2 / year (-1.7%)
- 3: 2, HFCS (AR6GWP100) with 120.76 Gg CO2 / year (1.2%)
- 4: 2, PFCS (AR6GWP100) with -34.37 Gg CO2 / year (-8.8%)
- 5: 3.A, CH4 with -16.31 Gg CO2 / year (-0.1%)
In the third party priority scenario the following sector-gas combinations have the highest absolute impact on national total KyotoGHG (AR6GWP100) emissions in 2023 (top 5):
- 1: 4, CH4 with -2619.84 Gg CO2 / year (-15.1%)
- 2: M.AG.ELV, N2O with -2094.52 Gg CO2 / year (-15.6%)
- 3: 4, CO2 with 1096.33 Gg CO2 / year (35.6%)
- 4: 3.A, CH4 with -1068.85 Gg CO2 / year (-3.9%)
- 5: M.AG.ELV, CO2 with 888.54 Gg CO2 / year (190119.9%)
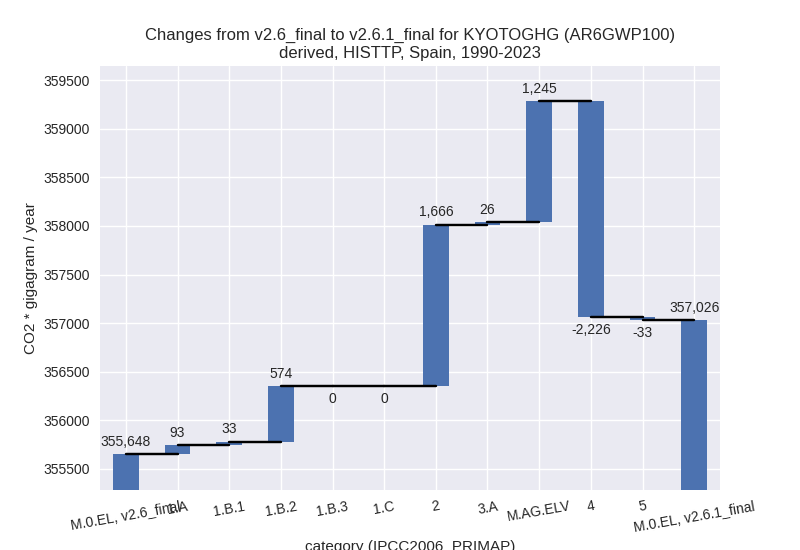
In the third party priority scenario the following sector-gas combinations have the highest absolute impact on national total KyotoGHG (AR6GWP100) emissions in 1990-2023 (top 5):
- 1: 4, CH4 with -2349.17 Gg CO2 / year (-14.1%)
- 2: 2, HFCS (AR6GWP100) with 1520.57 Gg CO2 / year (18.3%)
- 3: M.AG.ELV, CO2 with 1231.64 Gg CO2 / year (12151.7%)
- 4: 1.B.2, CO2 with 587.06 Gg CO2 / year (3237.3%)
- 5: 2, SF6 with 163.31 Gg CO2 / year (79.9%)
Notes on data changes
Here we list notes explaining important emissions changes for the country.
- CRT data has been included but replaces official data reported to the EU which does not show noteworthy differences. Changes in the CR time-series are small and come from updated third party data (EDGAR, FAO) which is used to extrapolate the country reported data.
- Emissions in sector 5 are now zero in the CR scenario because the CRT submissions report the sector as zero while in CRF data used before it was left empty and filled from EDGAR data.
- Changes in the TP scenario are small in terms of total emissions as well and due to input data updates (EDGAR, FAO)
Changes by sector and gas
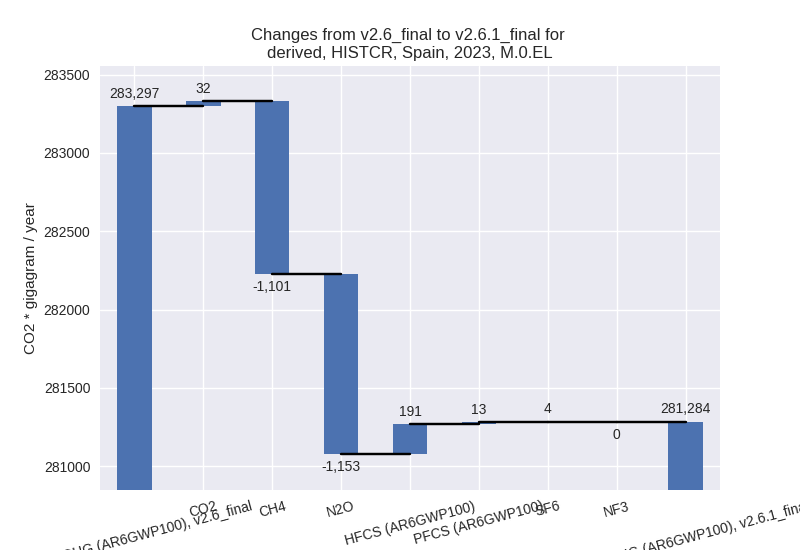
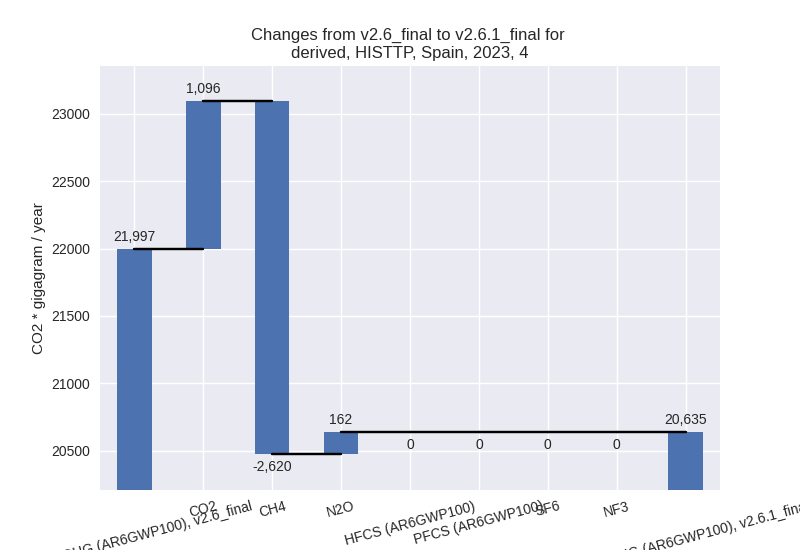
For each scenario and time frame the changes are displayed for all individual sectors and all individual gases. In the sector plot we use aggregate Kyoto GHGs in AR6GWP100. In the gas plot we usenational total emissions without LULUCF.
country reported scenario
2023
1990-2023
third party scenario
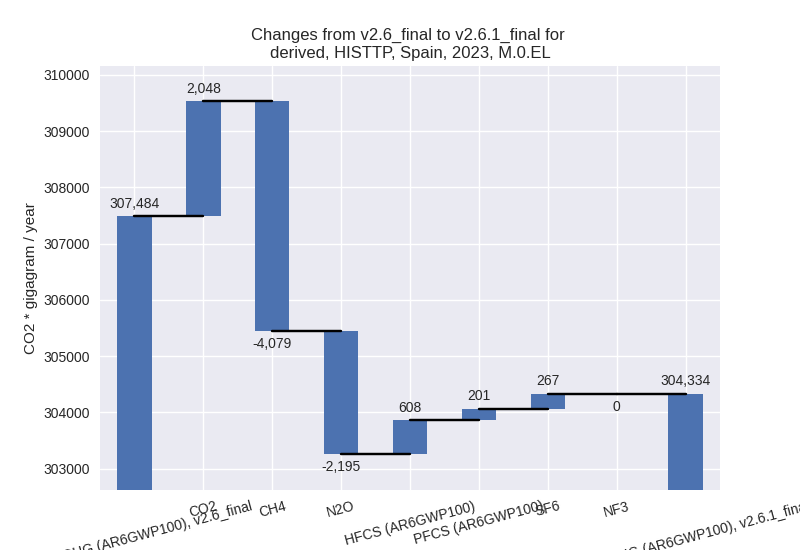
2023
1990-2023
Detailed changes for the scenarios:
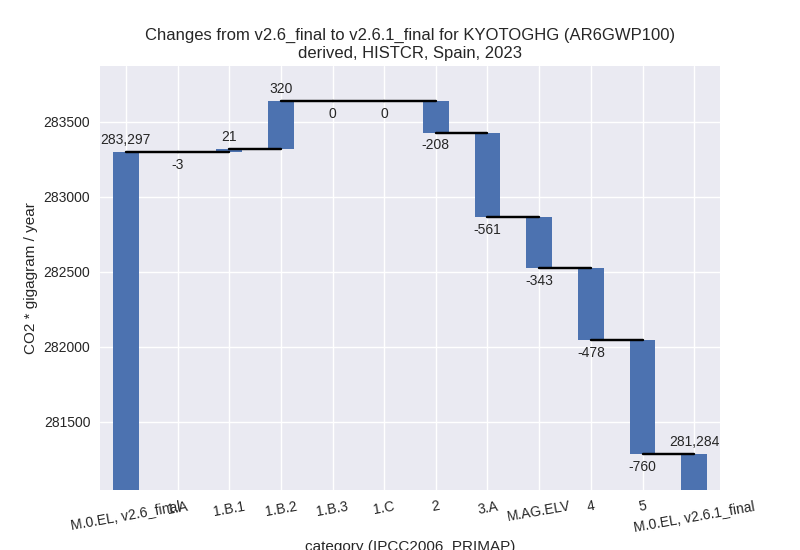
country reported scenario (HISTCR):
Most important changes per time frame
For 2023 the following sector-gas combinations have the highest absolute impact on national total KyotoGHG (AR6GWP100) emissions in 2023 (top 5):
- 1: 5, N2O with -760.17 Gg CO2 / year (-100.0%)
- 2: 3.A, CH4 with -554.44 Gg CO2 / year (-2.1%)
- 3: 4, CH4 with -463.64 Gg CO2 / year (-3.5%)
- 4: M.AG.ELV, N2O with -337.71 Gg CO2 / year (-4.8%)
- 5: 2, CO2 with -292.98 Gg CO2 / year (-1.8%)
For 1990-2023 the following sector-gas combinations have the highest absolute impact on national total KyotoGHG (AR6GWP100) emissions in 1990-2023 (top 5):
- 1: 5, N2O with -1313.97 Gg CO2 / year (-100.0%)
- 2: 4, CH4 with -236.32 Gg CO2 / year (-1.7%)
- 3: 2, HFCS (AR6GWP100) with 120.76 Gg CO2 / year (1.2%)
- 4: 2, PFCS (AR6GWP100) with -34.37 Gg CO2 / year (-8.8%)
- 5: 3.A, CH4 with -16.31 Gg CO2 / year (-0.1%)
Changes in the main sectors for aggregate KyotoGHG (AR6GWP100) are
- 1: Total sectoral emissions in 2022 are 222102.01 Gg CO2 / year which is 75.7% of M.0.EL emissions. 2023 Emissions have changed by 0.2% (337.88 Gg CO2 / year). 1990-2023 Emissions have changed by 0.0% (9.94 Gg CO2 / year).
- 2: Total sectoral emissions in 2022 are 22356.09 Gg CO2 / year which is 7.6% of M.0.EL emissions. 2023 Emissions have changed by -1.0% (-208.04 Gg CO2 / year). 1990-2023 Emissions have changed by 0.2% (74.26 Gg CO2 / year).
- M.AG: Total sectoral emissions in 2022 are 35000.65
Gg CO2 / year which is 11.9% of M.0.EL emissions. 2023 Emissions have
changed by -2.6% (-904.33 Gg CO2 /
year). 1990-2023 Emissions have changed by -0.1% (-26.60 Gg CO2 / year). For 2023 the
changes per gas
are:
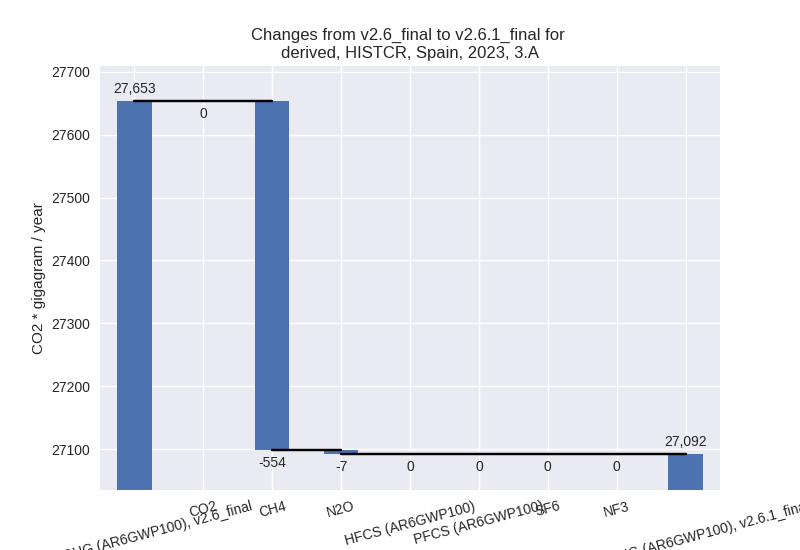
The changes come from the following subsectors:- 3.A: Total sectoral emissions in 2022 are 27154.13
Gg CO2 / year which is 77.6% of category M.AG emissions. 2023 Emissions
have changed by -2.0% (-561.08 Gg
CO2 / year). 1990-2023 Emissions have changed by -0.1% (-16.50 Gg CO2 / year). For 2023 the
changes per gas
are:
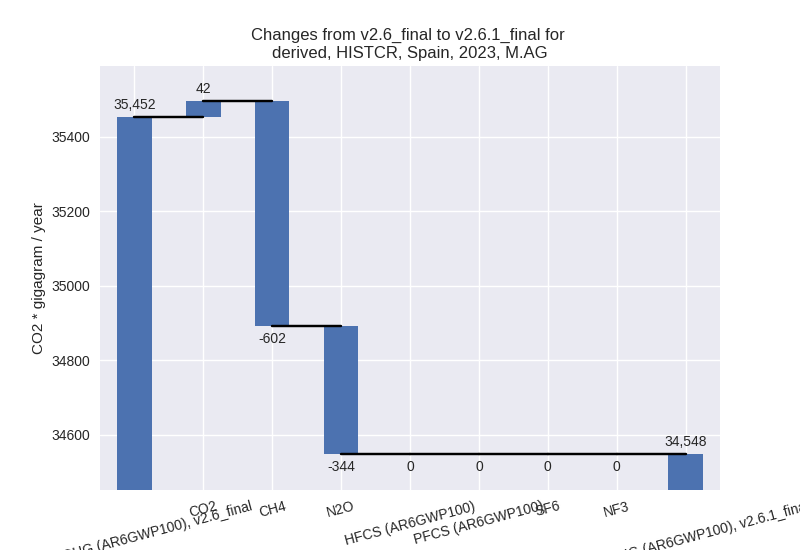
There is no subsector information available in PRIMAP-hist. - M.AG.ELV: Total sectoral emissions in 2022 are
7846.51 Gg CO2 / year which is 22.4% of category M.AG emissions. 2023
Emissions have changed by -4.4%
(-343.26 Gg CO2 / year). 1990-2023 Emissions have changed by -0.1% (-10.10 Gg CO2 / year). For 2023 the
changes per gas
are:
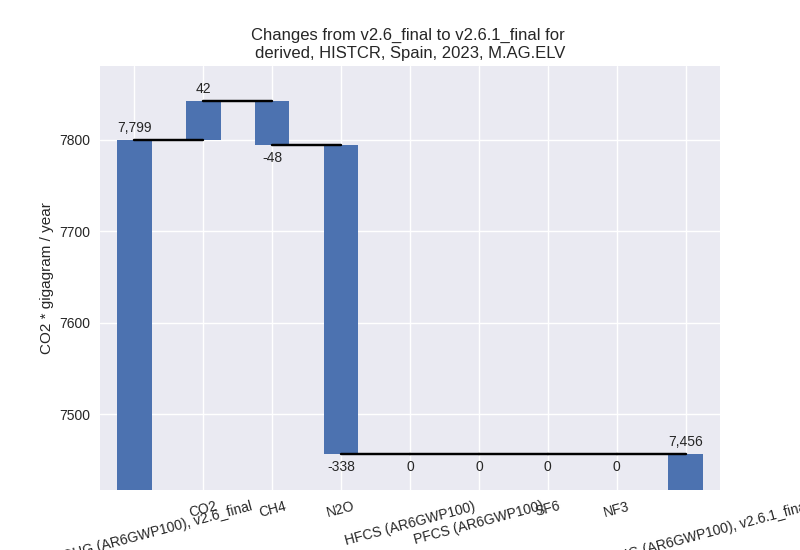
There is no subsector information available in PRIMAP-hist.
- 3.A: Total sectoral emissions in 2022 are 27154.13
Gg CO2 / year which is 77.6% of category M.AG emissions. 2023 Emissions
have changed by -2.0% (-561.08 Gg
CO2 / year). 1990-2023 Emissions have changed by -0.1% (-16.50 Gg CO2 / year). For 2023 the
changes per gas
are:
- 4: Total sectoral emissions in 2022 are 14128.89 Gg
CO2 / year which is 4.8% of M.0.EL emissions. 2023 Emissions have
changed by -3.3% (-478.22 Gg CO2 /
year). 1990-2023 Emissions have changed by -1.6% (-240.93 Gg CO2 / year). For 2023
the changes per gas
are:

- 5: Total sectoral emissions in 2022 are 0.00 Gg CO2
/ year which is 0.0% of M.0.EL emissions. 2023 Emissions have changed by
-100.0% (-760.17 Gg CO2 / year).
1990-2023 Emissions have changed by -100.0% (-1313.97 Gg CO2 / year). For 2023
the changes per gas
are:

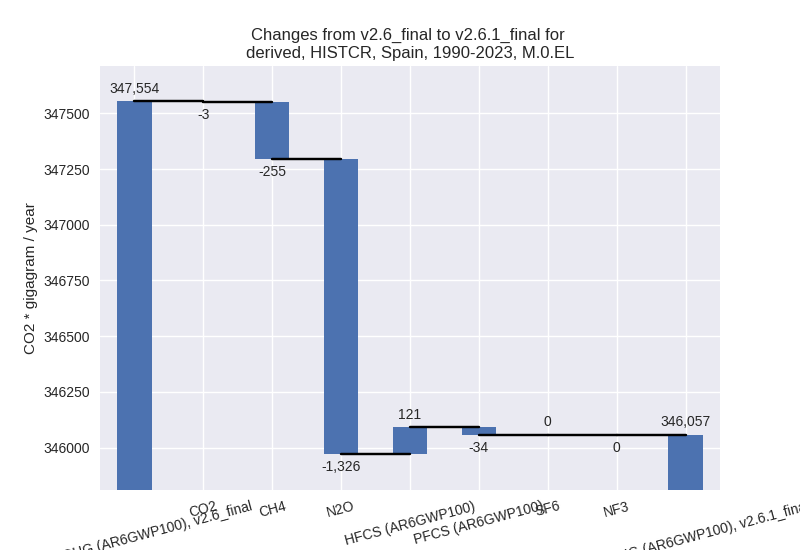
For 1990-2023 the changes per gas are: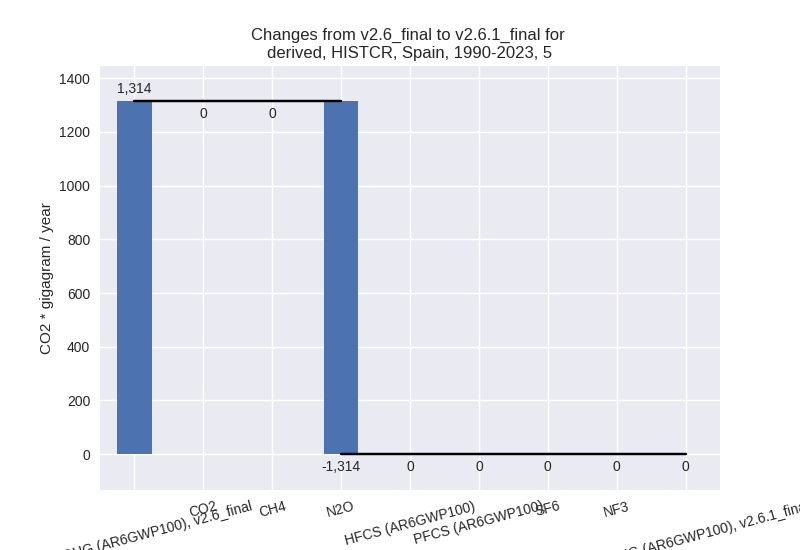
third party scenario (HISTTP):
Most important changes per time frame
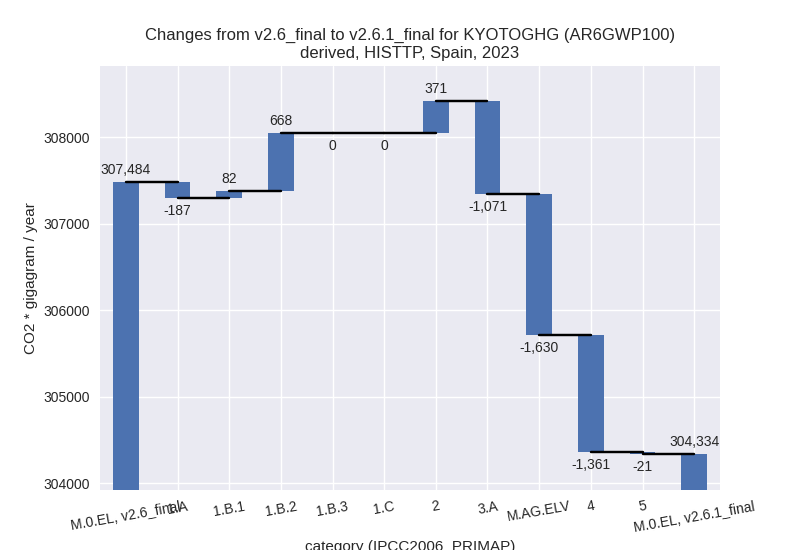
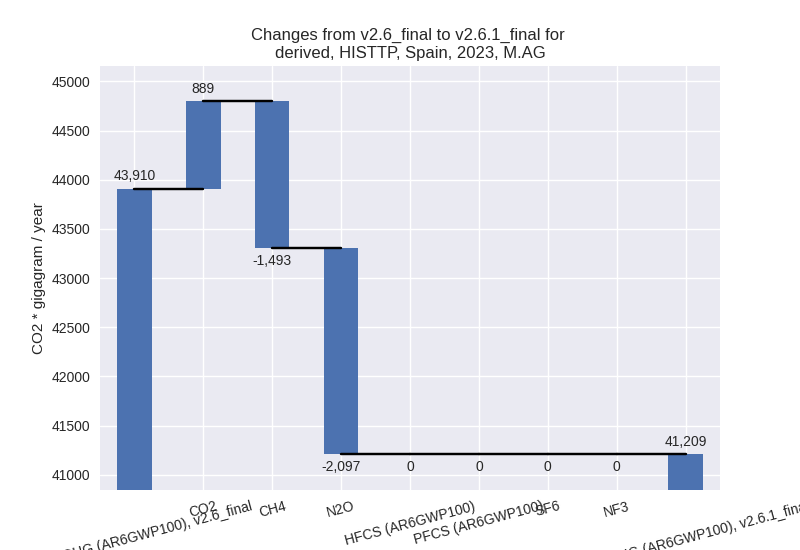
For 2023 the following sector-gas combinations have the highest absolute impact on national total KyotoGHG (AR6GWP100) emissions in 2023 (top 5):
- 1: 4, CH4 with -2619.84 Gg CO2 / year (-15.1%)
- 2: M.AG.ELV, N2O with -2094.52 Gg CO2 / year (-15.6%)
- 3: 4, CO2 with 1096.33 Gg CO2 / year (35.6%)
- 4: 3.A, CH4 with -1068.85 Gg CO2 / year (-3.9%)
- 5: M.AG.ELV, CO2 with 888.54 Gg CO2 / year (190119.9%)
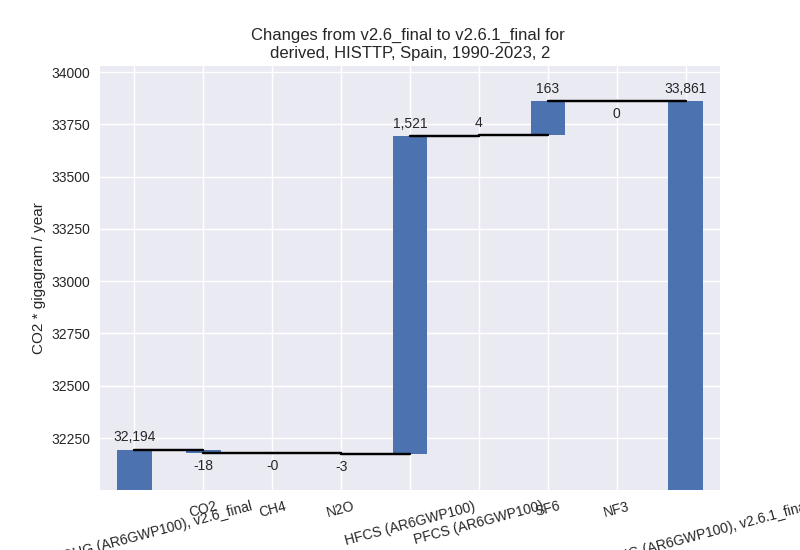
For 1990-2023 the following sector-gas combinations have the highest absolute impact on national total KyotoGHG (AR6GWP100) emissions in 1990-2023 (top 5):
- 1: 4, CH4 with -2349.17 Gg CO2 / year (-14.1%)
- 2: 2, HFCS (AR6GWP100) with 1520.57 Gg CO2 / year (18.3%)
- 3: M.AG.ELV, CO2 with 1231.64 Gg CO2 / year (12151.7%)
- 4: 1.B.2, CO2 with 587.06 Gg CO2 / year (3237.3%)
- 5: 2, SF6 with 163.31 Gg CO2 / year (79.9%)
Changes in the main sectors for aggregate KyotoGHG (AR6GWP100) are
- 1: Total sectoral emissions in 2022 are 234146.51 Gg CO2 / year which is 73.7% of M.0.EL emissions. 2023 Emissions have changed by 0.3% (562.63 Gg CO2 / year). 1990-2023 Emissions have changed by 0.3% (700.29 Gg CO2 / year).
- 2: Total sectoral emissions in 2022 are 20374.35 Gg
CO2 / year which is 6.4% of M.0.EL emissions. 2023 Emissions have
changed by 1.9% (371.26 Gg CO2 /
year). 1990-2023 Emissions have changed by 5.2% (1666.41 Gg CO2 / year). For
1990-2023 the changes per gas
are:
- M.AG: Total sectoral emissions in 2022 are 41966.36
Gg CO2 / year which is 13.2% of M.0.EL emissions. 2023 Emissions have
changed by -6.2% (-2701.05 Gg CO2 /
year). 1990-2023 Emissions have changed by 3.1% (1270.93 Gg CO2 / year). For 2023 the
changes per gas
are:
For 1990-2023 the changes per gas are: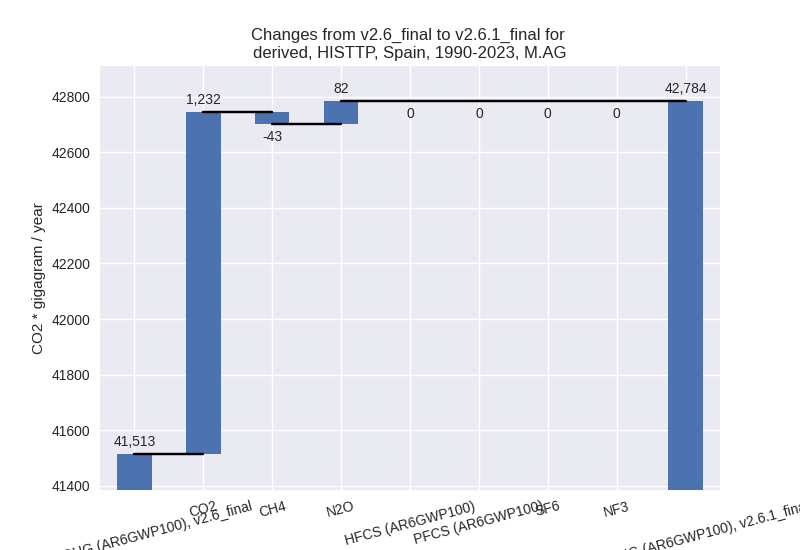
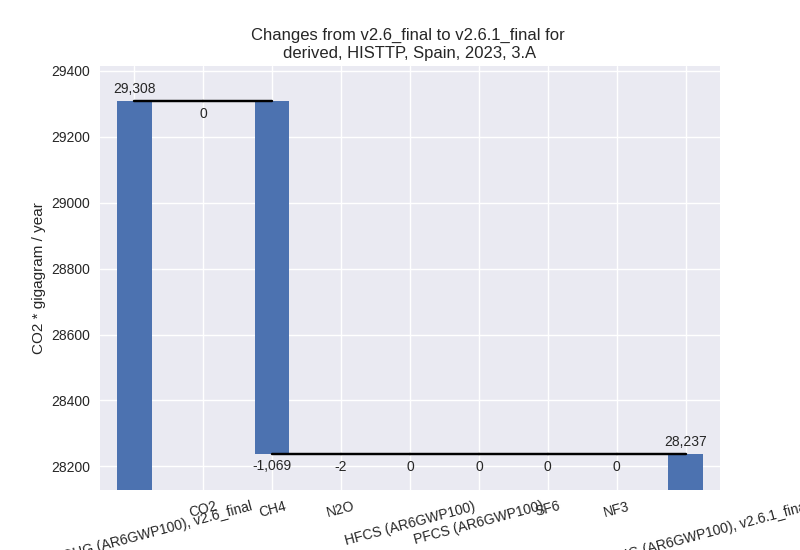
The changes come from the following subsectors:- 3.A: Total sectoral emissions in 2022 are 28300.12
Gg CO2 / year which is 67.4% of category M.AG emissions. 2023 Emissions
have changed by -3.7% (-1070.99 Gg
CO2 / year). 1990-2023 Emissions have changed by 0.1% (25.64 Gg CO2 / year). For 2023 the
changes per gas
are:
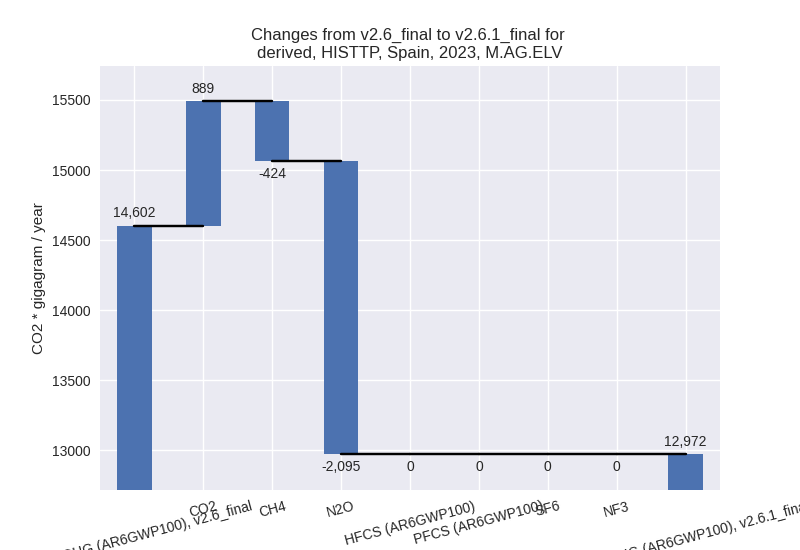
There is no subsector information available in PRIMAP-hist. - M.AG.ELV: Total sectoral emissions in 2022 are
13666.24 Gg CO2 / year which is 32.6% of category M.AG emissions. 2023
Emissions have changed by -11.2%
(-1630.06 Gg CO2 / year). 1990-2023 Emissions have changed by 8.5% (1245.30 Gg CO2 / year). For 2023 the
changes per gas
are:
For 1990-2023 the changes per gas are: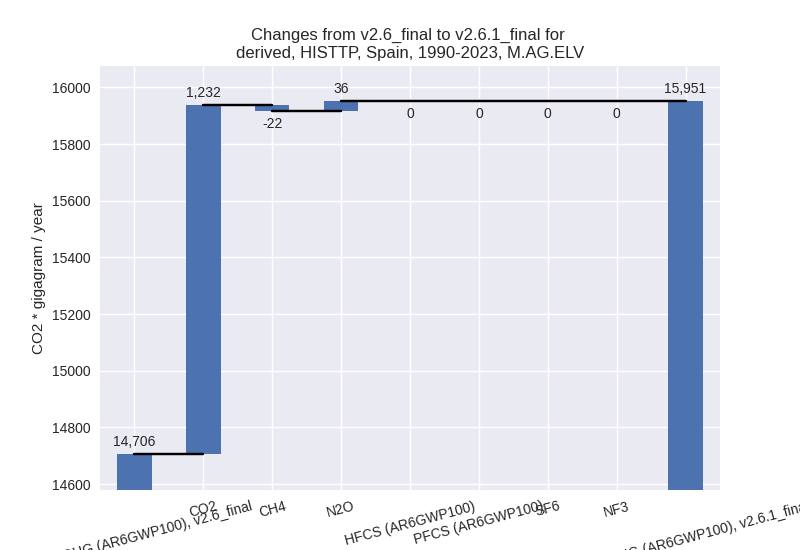
There is no subsector information available in PRIMAP-hist.
- 3.A: Total sectoral emissions in 2022 are 28300.12
Gg CO2 / year which is 67.4% of category M.AG emissions. 2023 Emissions
have changed by -3.7% (-1070.99 Gg
CO2 / year). 1990-2023 Emissions have changed by 0.1% (25.64 Gg CO2 / year). For 2023 the
changes per gas
are:
- 4: Total sectoral emissions in 2022 are 20586.99 Gg
CO2 / year which is 6.5% of M.0.EL emissions. 2023 Emissions have
changed by -6.2% (-1361.11 Gg CO2 /
year). 1990-2023 Emissions have changed by -10.6% (-2225.80 Gg CO2 / year). For 2023
the changes per gas
are:
For 1990-2023 the changes per gas are: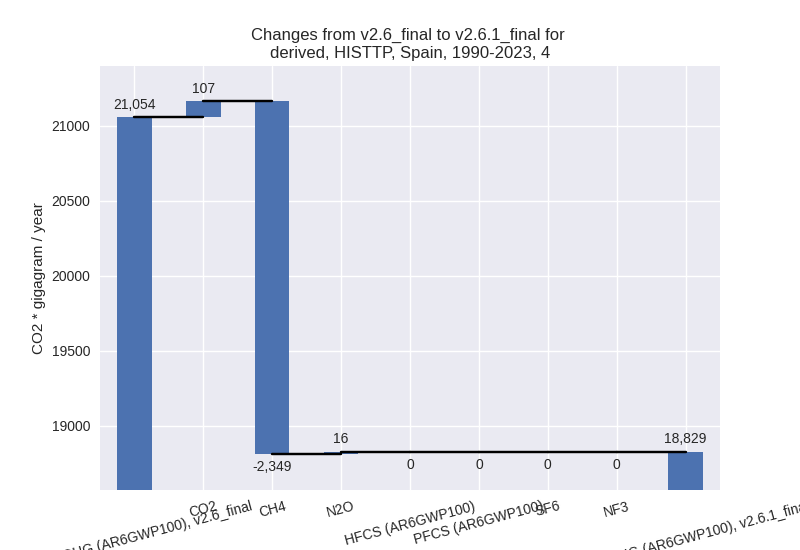
- 5: Total sectoral emissions in 2022 are 801.98 Gg
CO2 / year which is 0.3% of M.0.EL emissions. 2023 Emissions have
changed by -2.8% (-21.48 Gg CO2 /
year). 1990-2023 Emissions have changed by -2.5% (-33.15 Gg CO2 / year). For 2023 the
changes per gas
are:
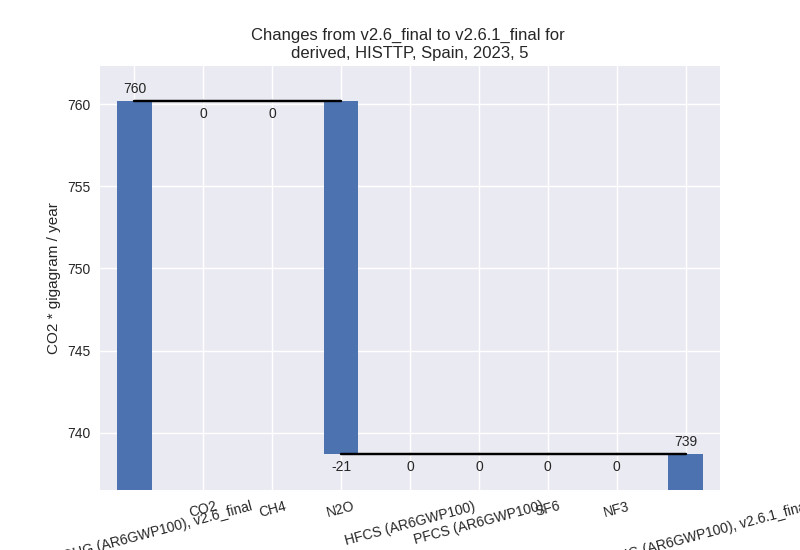
For 1990-2023 the changes per gas are: