Changes in PRIMAP-hist v2.6.1_final compared to v2.6_final for Estonia
2025-03-19
Johannes Gütschow
Change analysis for Estonia for PRIMAP-hist v2.6.1_final compared to v2.6_final
Overview over emissions by sector and gas
The following figures show the aggregate national total emissions excluding LULUCF AR6GWP100 for the country reported priority scenario. The dotted linesshow the v2.6_final data.
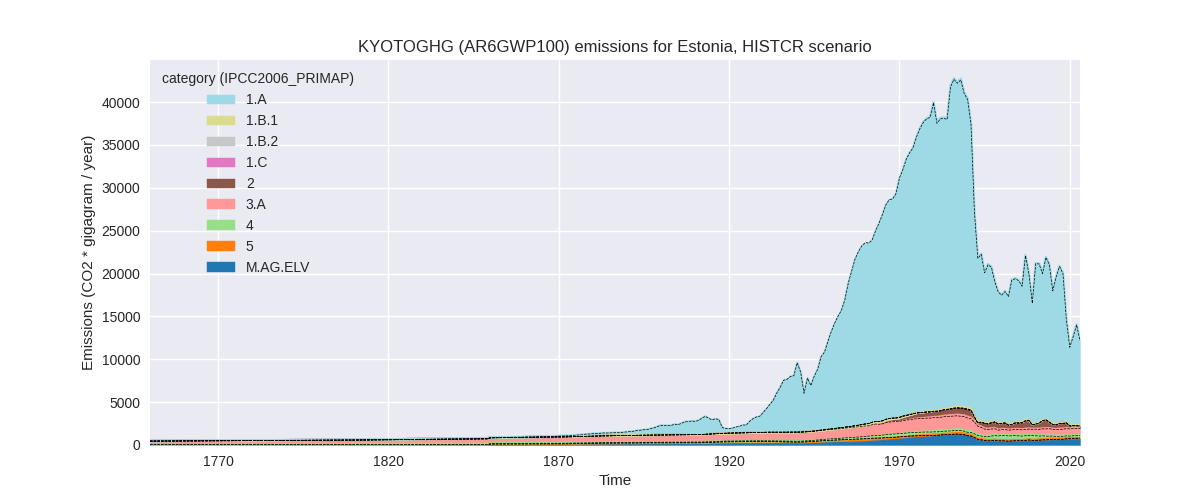
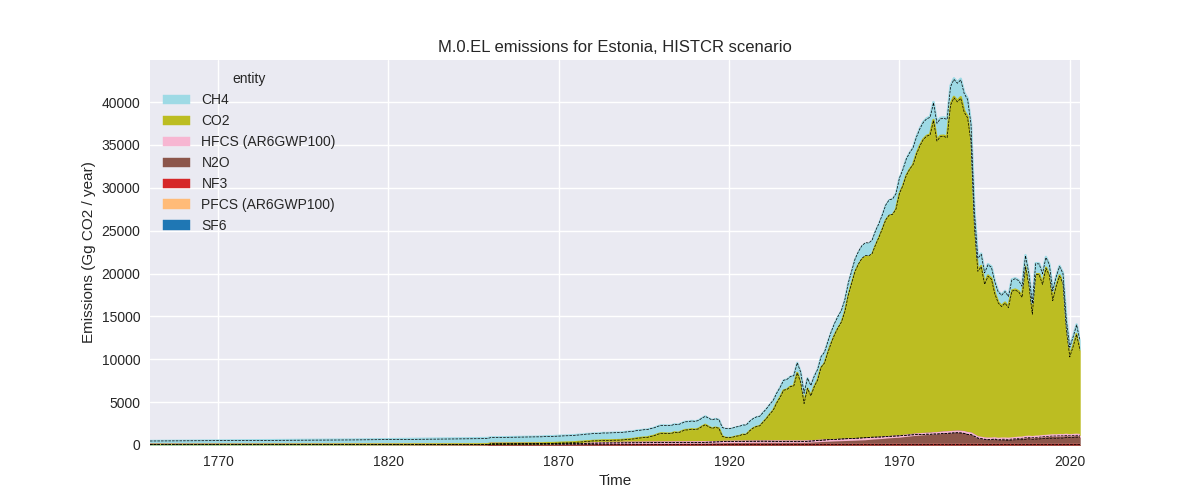
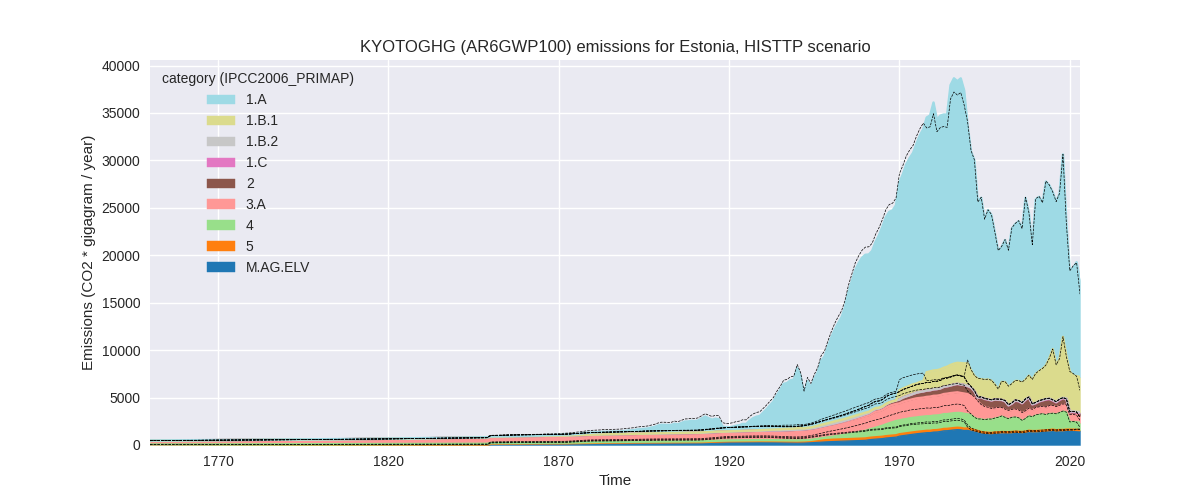
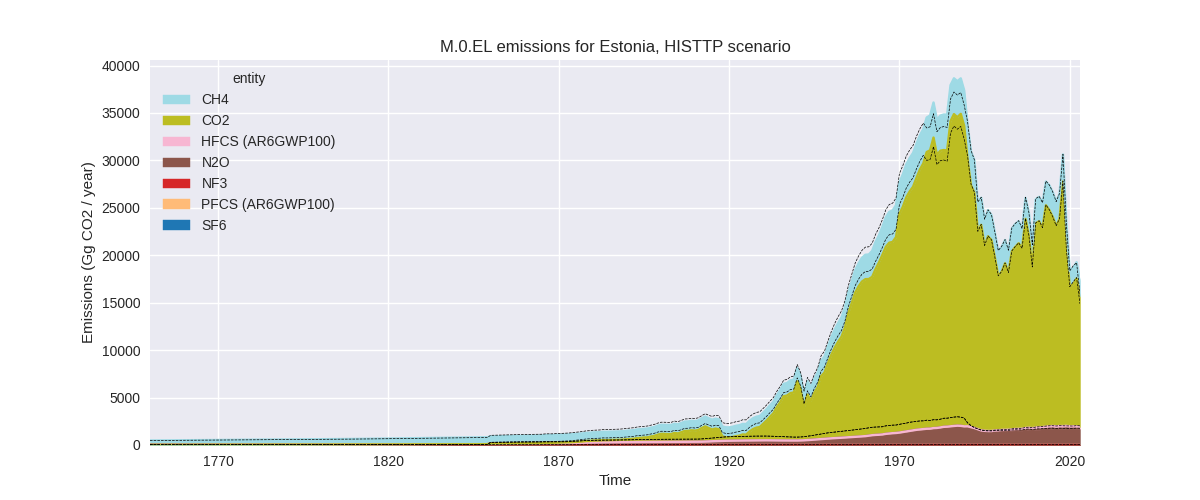
The following figures show the aggregate national total emissions excluding LULUCF AR6GWP100 for the third party priority scenario. The dotted linesshow the v2.6_final data.
Overview over changes
In the country reported priority scenario we have the following changes for aggregate Kyoto GHG and national total emissions excluding LULUCF (M.0.EL):
- Emissions in 2023 have changed by 0.3%% (39.64 Gg CO2 / year)
- Emissions in 1990-2023 have changed by 0.3%% (68.50 Gg CO2 / year)
In the third party priority scenario we have the following changes for aggregate Kyoto GHG and national total emissions excluding LULUCF (M.0.EL):
- Emissions in 2023 have changed by 9.0%% (1436.86 Gg CO2 / year)
- Emissions in 1990-2023 have changed by -0.1%% (-16.90 Gg CO2 / year)
Most important changes per scenario and time frame
In the country reported priority scenario the following sector-gas combinations have the highest absolute impact on national total KyotoGHG (AR6GWP100) emissions in 2023 (top 5):
- 1: 5, N2O with 44.72 Gg CO2 / year (inf%)
- 2: M.AG.ELV, N2O with -36.83 Gg CO2 / year (-4.8%)
- 3: 2, CO2 with 27.76 Gg CO2 / year (65.0%)
- 4: 2, HFCS (AR6GWP100) with 12.69 Gg CO2 / year (6.1%)
- 5: 3.A, CH4 with -7.67 Gg CO2 / year (-1.0%)
In the country reported priority scenario the following sector-gas combinations have the highest absolute impact on national total KyotoGHG (AR6GWP100) emissions in 1990-2023 (top 5):
- 1: 5, N2O with 67.42 Gg CO2 / year (inf%)
- 2: 2, HFCS (AR6GWP100) with 2.51 Gg CO2 / year (1.7%)
- 3: M.AG.ELV, N2O with -1.08 Gg CO2 / year (-0.2%)
- 4: 3.A, CH4 with -0.23 Gg CO2 / year (-0.0%)
- 5: 4, CH4 with 0.10 Gg CO2 / year (0.0%)
In the third party priority scenario the following sector-gas combinations have the highest absolute impact on national total KyotoGHG (AR6GWP100) emissions in 2023 (top 5):
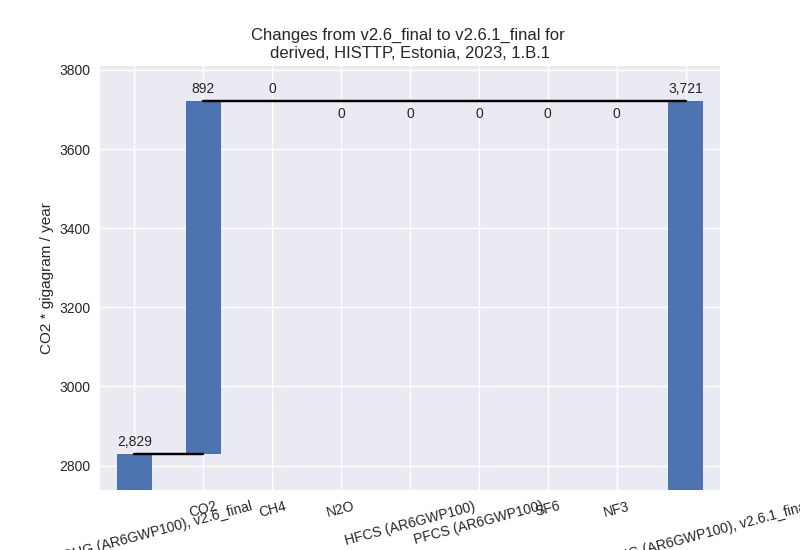
- 1: 1.B.1, CO2 with 891.83 Gg CO2 / year (31.5%)
- 2: 4, CH4 with 578.32 Gg CO2 / year (372.9%)
- 3: M.AG.ELV, N2O with -94.78 Gg CO2 / year (-6.1%)
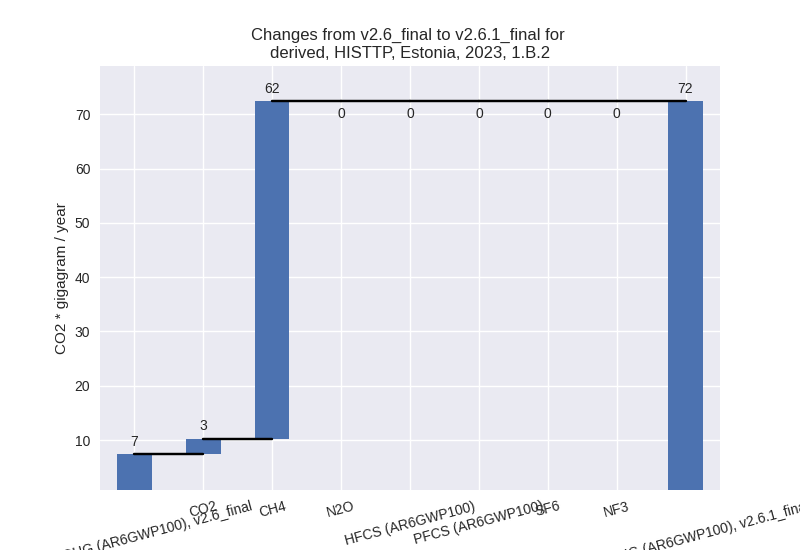
- 4: 1.B.2, CH4 with 62.10 Gg CO2 / year (841.5%)
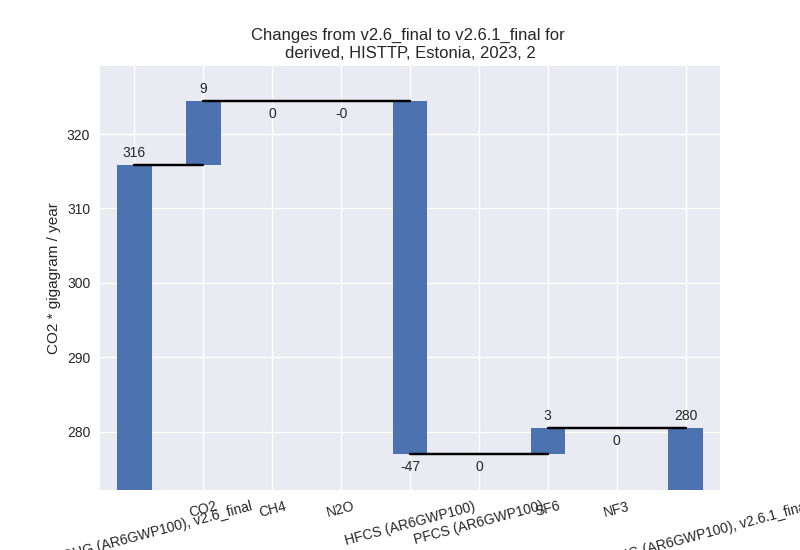
- 5: 2, HFCS (AR6GWP100) with -47.44 Gg CO2 / year (-19.1%)
In the third party priority scenario the following sector-gas combinations have the highest absolute impact on national total KyotoGHG (AR6GWP100) emissions in 1990-2023 (top 5):
- 1: 5, N2O with -46.92 Gg CO2 / year (-41.0%)
- 2: 1.B.2, CH4 with 20.43 Gg CO2 / year (146.2%)
- 3: 1.B.1, CO2 with 19.95 Gg CO2 / year (0.7%)
- 4: M.AG.ELV, N2O with -14.95 Gg CO2 / year (-1.1%)
- 5: 1.B.2, CO2 with 5.76 Gg CO2 / year (12349.4%)
Notes on data changes
Here we list notes explaining important emissions changes for the country.
- CRT data has been included but replaces official data reported to the EU which does not show noteworthy differences. Changes in the CR time-series are small and come from updated third party data (EDGAR, FAO) which is used to extrapolate the country reported data.
- For 2023 in the TP scenario CO2 in 1.B.1 and a massive increase in waste CH4 in the EDGAR data load to higher emissions.
Changes by sector and gas
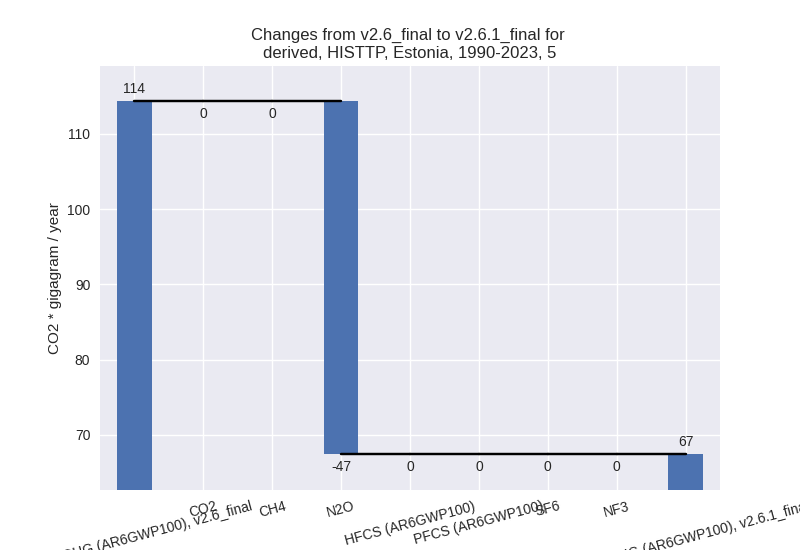
For each scenario and time frame the changes are displayed for all individual sectors and all individual gases. In the sector plot we use aggregate Kyoto GHGs in AR6GWP100. In the gas plot we usenational total emissions without LULUCF.
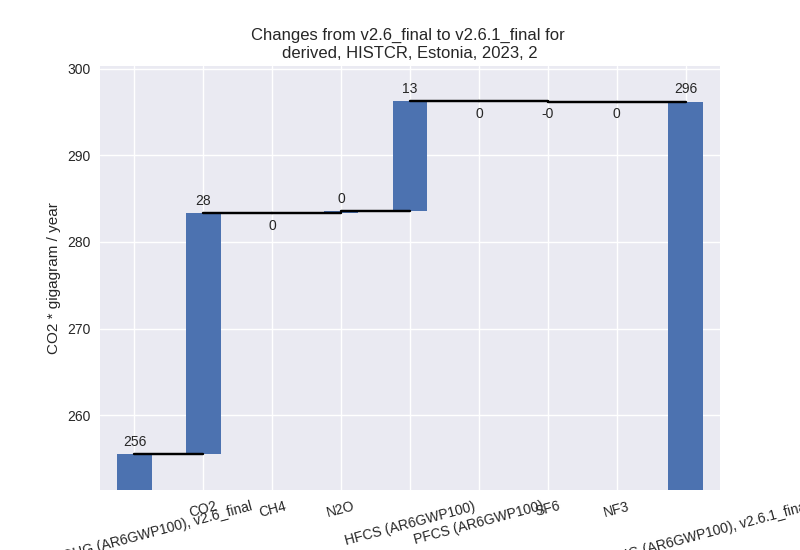
country reported scenario
2023
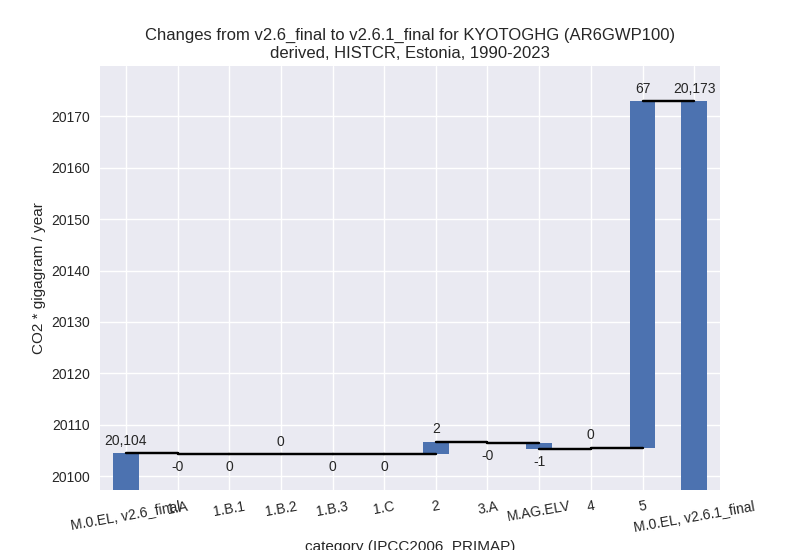
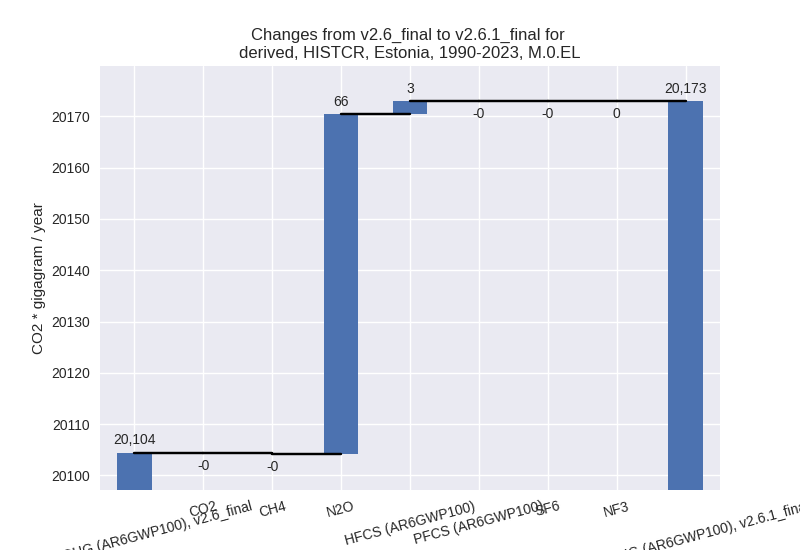
1990-2023
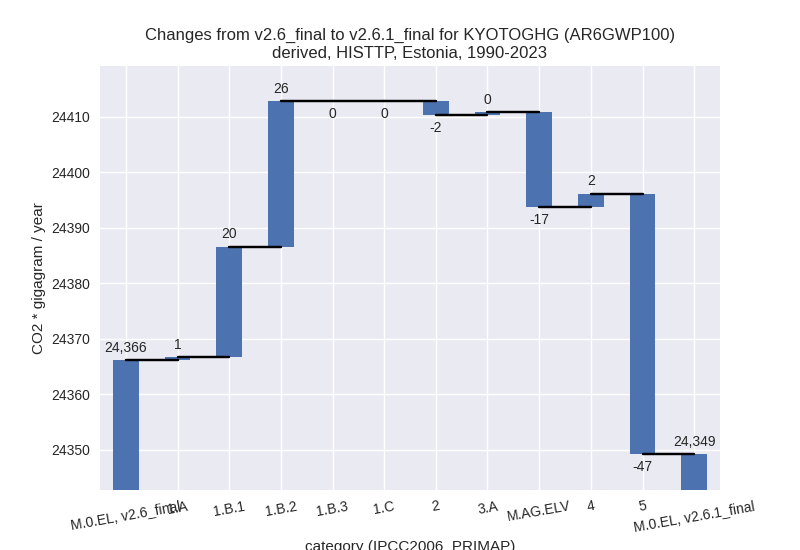
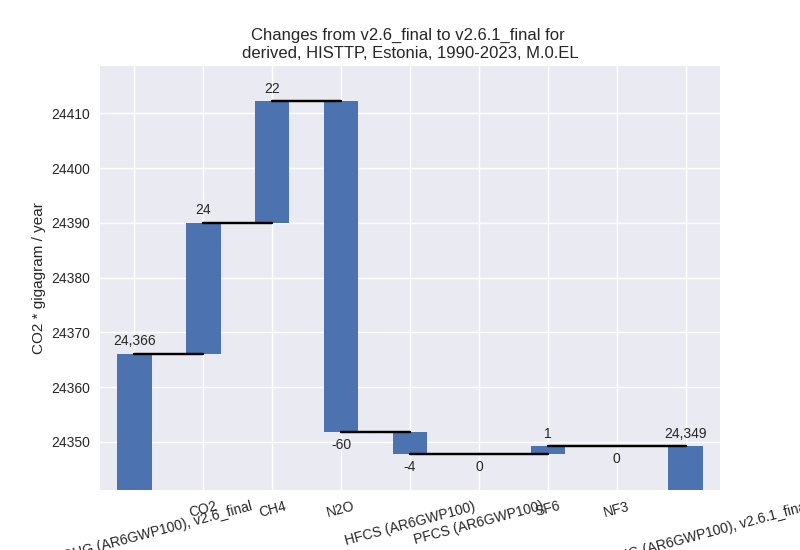
third party scenario
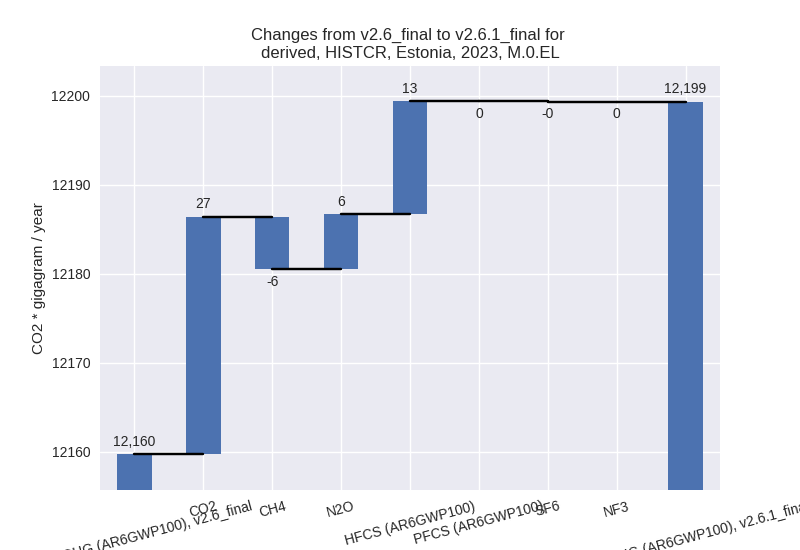
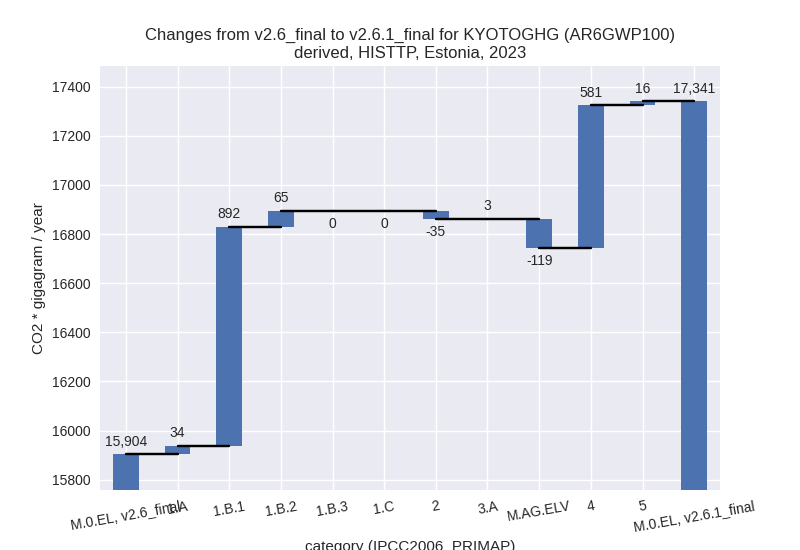
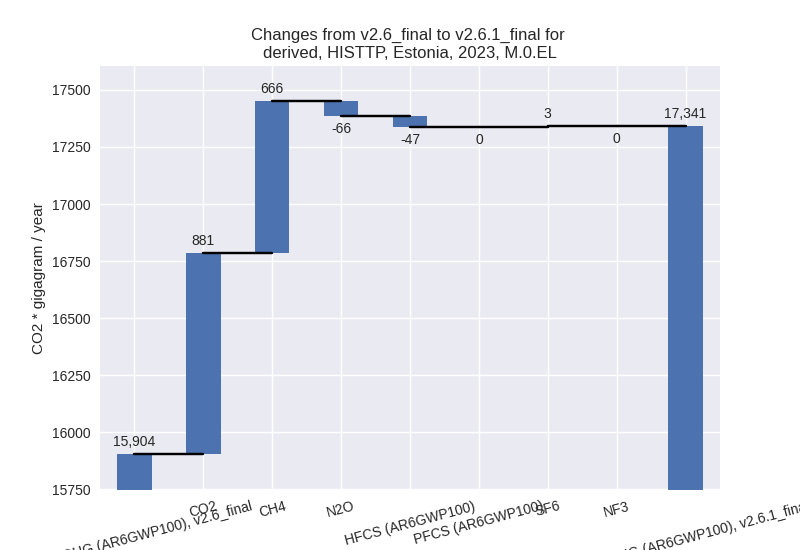
2023
1990-2023
Detailed changes for the scenarios:
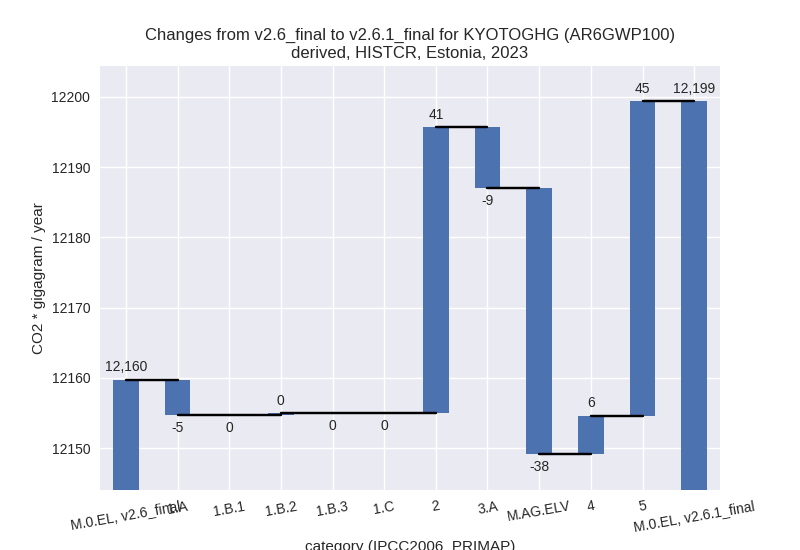
country reported scenario (HISTCR):
Most important changes per time frame
For 2023 the following sector-gas combinations have the highest absolute impact on national total KyotoGHG (AR6GWP100) emissions in 2023 (top 5):
- 1: 5, N2O with 44.72 Gg CO2 / year (inf%)
- 2: M.AG.ELV, N2O with -36.83 Gg CO2 / year (-4.8%)
- 3: 2, CO2 with 27.76 Gg CO2 / year (65.0%)
- 4: 2, HFCS (AR6GWP100) with 12.69 Gg CO2 / year (6.1%)
- 5: 3.A, CH4 with -7.67 Gg CO2 / year (-1.0%)
For 1990-2023 the following sector-gas combinations have the highest absolute impact on national total KyotoGHG (AR6GWP100) emissions in 1990-2023 (top 5):
- 1: 5, N2O with 67.42 Gg CO2 / year (inf%)
- 2: 2, HFCS (AR6GWP100) with 2.51 Gg CO2 / year (1.7%)
- 3: M.AG.ELV, N2O with -1.08 Gg CO2 / year (-0.2%)
- 4: 3.A, CH4 with -0.23 Gg CO2 / year (-0.0%)
- 5: 4, CH4 with 0.10 Gg CO2 / year (0.0%)
Changes in the main sectors for aggregate KyotoGHG (AR6GWP100) are
- 1: Total sectoral emissions in 2022 are 11771.22 Gg CO2 / year which is 83.7% of M.0.EL emissions. 2023 Emissions have changed by -0.0% (-4.73 Gg CO2 / year). 1990-2023 Emissions have changed by -0.0% (-0.14 Gg CO2 / year).
- 2: Total sectoral emissions in 2022 are 312.29 Gg
CO2 / year which is 2.2% of M.0.EL emissions. 2023 Emissions have
changed by 15.9% (40.68 Gg CO2 /
year). 1990-2023 Emissions have changed by 0.4% (2.43 Gg CO2 / year). For 2023 the
changes per gas
are:
- M.AG: Total sectoral emissions in 2022 are 1613.21
Gg CO2 / year which is 11.5% of M.0.EL emissions. 2023 Emissions have
changed by -2.8% (-46.54 Gg CO2 /
year). 1990-2023 Emissions have changed by -0.1% (-1.37 Gg CO2 / year). For 2023 the
changes per gas
are:
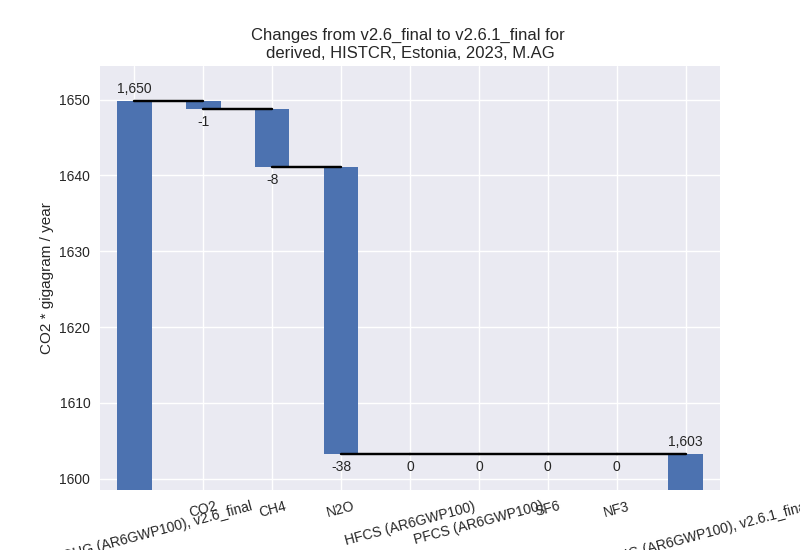
The changes come from the following subsectors:- 3.A: Total sectoral emissions in 2022 are 837.89 Gg CO2 / year which is 51.9% of category M.AG emissions. 2023 Emissions have changed by -1.0% (-8.67 Gg CO2 / year). 1990-2023 Emissions have changed by -0.0% (-0.26 Gg CO2 / year).
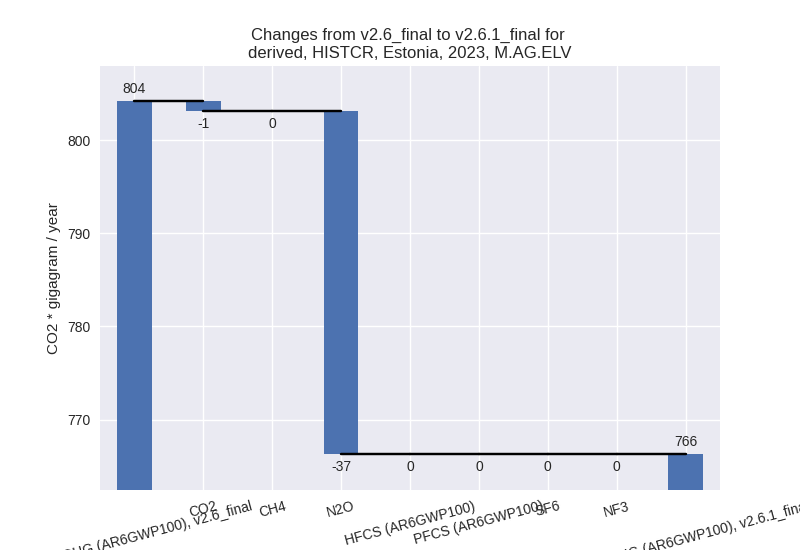
- M.AG.ELV: Total sectoral emissions in 2022 are
775.32 Gg CO2 / year which is 48.1% of category M.AG emissions. 2023
Emissions have changed by -4.7%
(-37.86 Gg CO2 / year). 1990-2023 Emissions have changed by -0.2% (-1.11 Gg CO2 / year). For 2023 the
changes per gas
are:
There is no subsector information available in PRIMAP-hist.
- 4: Total sectoral emissions in 2022 are 314.32 Gg CO2 / year which is 2.2% of M.0.EL emissions. 2023 Emissions have changed by 1.8% (5.50 Gg CO2 / year). 1990-2023 Emissions have changed by 0.0% (0.16 Gg CO2 / year).
- 5: Total sectoral emissions in 2022 are 50.16 Gg
CO2 / year which is 0.4% of M.0.EL emissions. 2023 Emissions have
changed by inf% (44.72 Gg CO2 /
year). 1990-2023 Emissions have changed by inf% (67.42 Gg CO2 / year). For 2023 the
changes per gas
are:

For 1990-2023 the changes per gas are: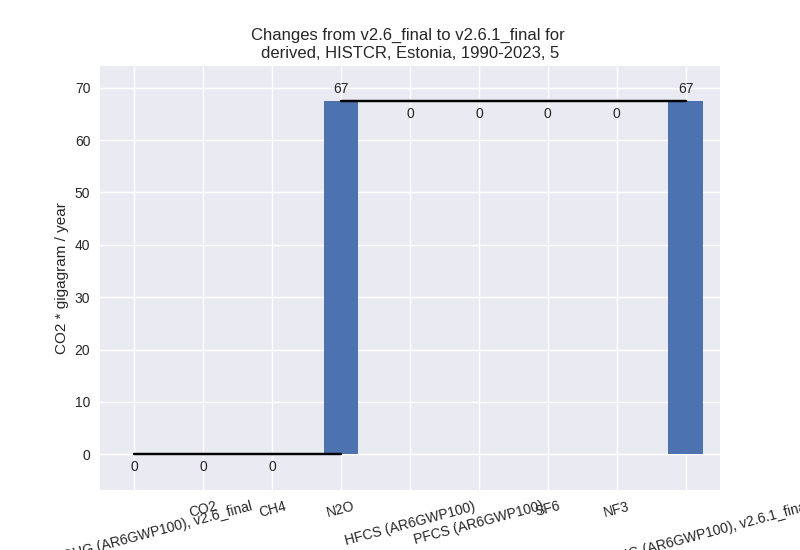
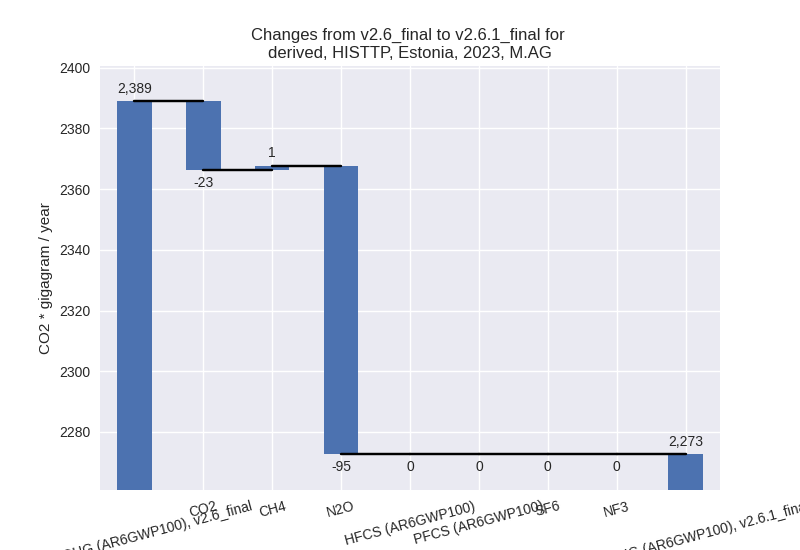
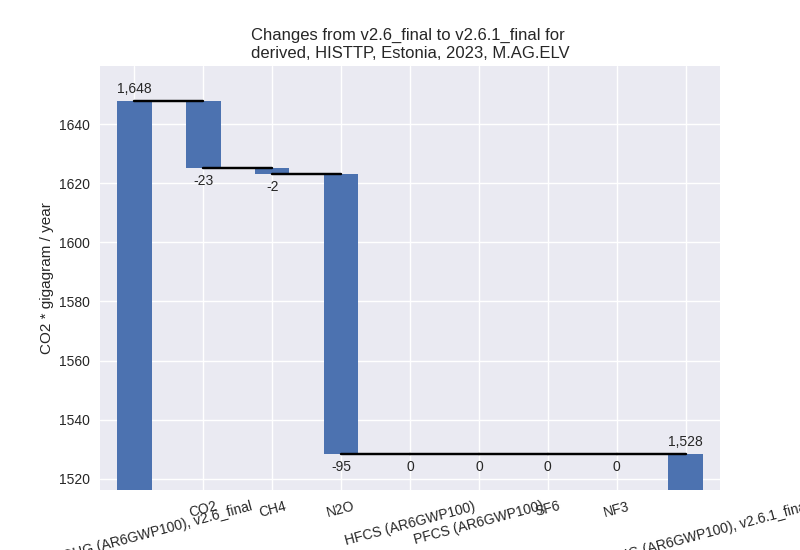
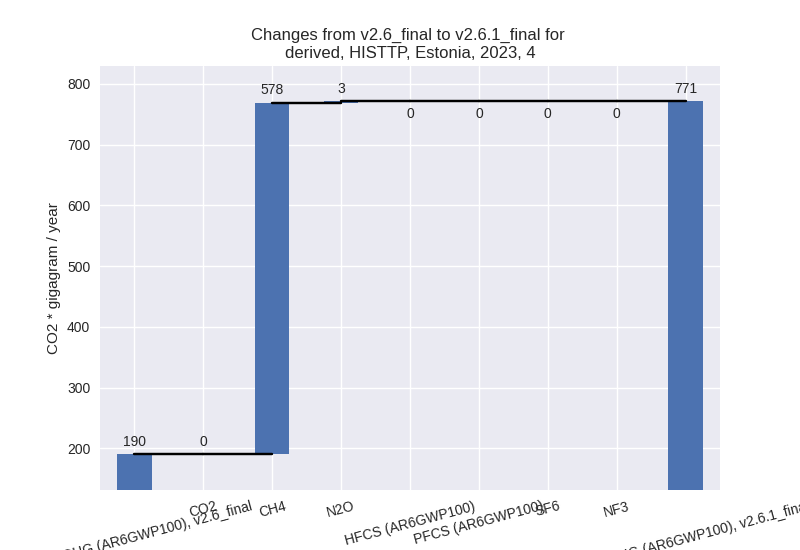
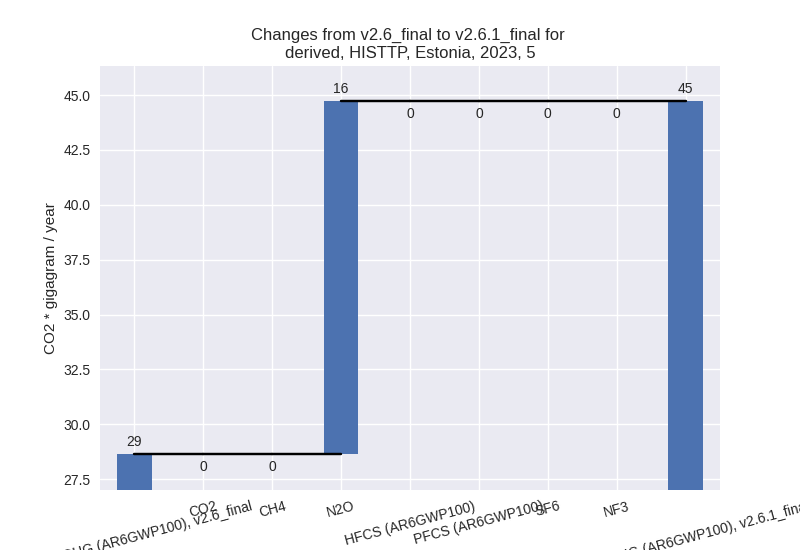
third party scenario (HISTTP):
Most important changes per time frame
For 2023 the following sector-gas combinations have the highest absolute impact on national total KyotoGHG (AR6GWP100) emissions in 2023 (top 5):
- 1: 1.B.1, CO2 with 891.83 Gg CO2 / year (31.5%)
- 2: 4, CH4 with 578.32 Gg CO2 / year (372.9%)
- 3: M.AG.ELV, N2O with -94.78 Gg CO2 / year (-6.1%)
- 4: 1.B.2, CH4 with 62.10 Gg CO2 / year (841.5%)
- 5: 2, HFCS (AR6GWP100) with -47.44 Gg CO2 / year (-19.1%)
For 1990-2023 the following sector-gas combinations have the highest absolute impact on national total KyotoGHG (AR6GWP100) emissions in 1990-2023 (top 5):
- 1: 5, N2O with -46.92 Gg CO2 / year (-41.0%)
- 2: 1.B.2, CH4 with 20.43 Gg CO2 / year (146.2%)
- 3: 1.B.1, CO2 with 19.95 Gg CO2 / year (0.7%)
- 4: M.AG.ELV, N2O with -14.95 Gg CO2 / year (-1.1%)
- 5: 1.B.2, CO2 with 5.76 Gg CO2 / year (12349.4%)
Changes in the main sectors for aggregate KyotoGHG (AR6GWP100) are
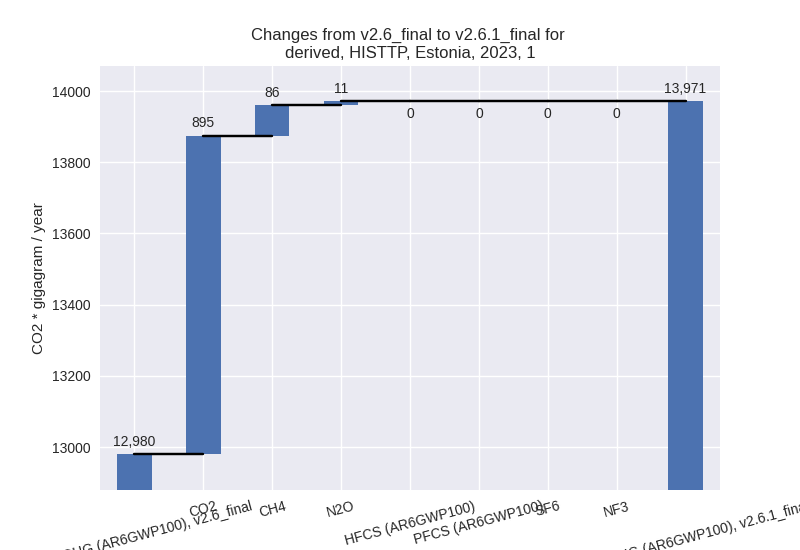
- 1: Total sectoral emissions in 2022 are 15833.44 Gg
CO2 / year which is 82.2% of M.0.EL emissions. 2023 Emissions have
changed by 7.6% (991.28 Gg CO2 /
year). 1990-2023 Emissions have changed by 0.2% (46.71 Gg CO2 / year). For 2023 the
changes per gas
are:
The changes come from the following subsectors:- 1.A: Total sectoral emissions in 2022 are 12010.28 Gg CO2 / year which is 75.9% of category 1 emissions. 2023 Emissions have changed by 0.3% (34.45 Gg CO2 / year). 1990-2023 Emissions have changed by 0.0% (0.57 Gg CO2 / year).
- 1.B.1: Total sectoral emissions in 2022 are 3753.61
Gg CO2 / year which is 23.7% of category 1 emissions. 2023 Emissions
have changed by 31.5% (891.85 Gg CO2
/ year). 1990-2023 Emissions have changed by 0.7% (19.95 Gg CO2 / year). For 2023 the
changes per gas
are:
There is no subsector information available in PRIMAP-hist. - 1.B.2: Total sectoral emissions in 2022 are 69.54
Gg CO2 / year which is 0.4% of category 1 emissions. 2023 Emissions have
changed by 877.8% (64.99 Gg CO2 /
year). 1990-2023 Emissions have changed by 186.9% (26.19 Gg CO2 / year). For 2023 the
changes per gas
are:
For 1990-2023 the changes per gas are: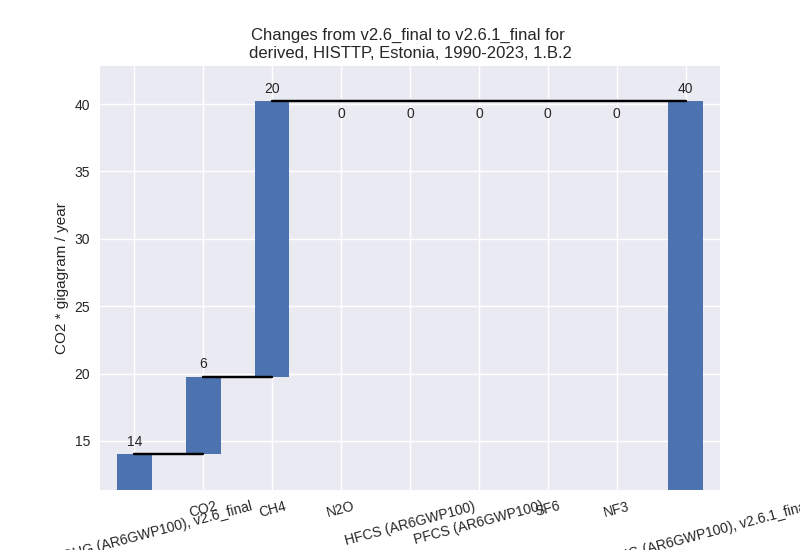
There is no subsector information available in PRIMAP-hist.
- 2: Total sectoral emissions in 2022 are 292.33 Gg
CO2 / year which is 1.5% of M.0.EL emissions. 2023 Emissions have
changed by -11.2% (-35.34 Gg CO2 /
year). 1990-2023 Emissions have changed by -0.3% (-2.45 Gg CO2 / year). For 2023 the
changes per gas
are:
- M.AG: Total sectoral emissions in 2022 are 2292.37
Gg CO2 / year which is 11.9% of M.0.EL emissions. 2023 Emissions have
changed by -4.9% (-116.21 Gg CO2 /
year). 1990-2023 Emissions have changed by -0.7% (-16.54 Gg CO2 / year). For 2023 the
changes per gas
are:
The changes come from the following subsectors:- 3.A: Total sectoral emissions in 2022 are 745.15 Gg CO2 / year which is 32.5% of category M.AG emissions. 2023 Emissions have changed by 0.4% (3.10 Gg CO2 / year). 1990-2023 Emissions have changed by 0.0% (0.48 Gg CO2 / year).
- M.AG.ELV: Total sectoral emissions in 2022 are
1547.22 Gg CO2 / year which is 67.5% of category M.AG emissions. 2023
Emissions have changed by -7.2%
(-119.31 Gg CO2 / year). 1990-2023 Emissions have changed by -1.2% (-17.02 Gg CO2 / year). For 2023 the
changes per gas
are:
There is no subsector information available in PRIMAP-hist.
- 4: Total sectoral emissions in 2022 are 796.72 Gg
CO2 / year which is 4.1% of M.0.EL emissions. 2023 Emissions have
changed by 305.2% (581.06 Gg CO2 /
year). 1990-2023 Emissions have changed by 0.2% (2.31 Gg CO2 / year). For 2023 the
changes per gas
are:
- 5: Total sectoral emissions in 2022 are 50.16 Gg
CO2 / year which is 0.3% of M.0.EL emissions. 2023 Emissions have
changed by 56.2% (16.08 Gg CO2 /
year). 1990-2023 Emissions have changed by -41.0% (-46.92 Gg CO2 / year). For 2023
the changes per gas
are:
For 1990-2023 the changes per gas are: