Changes in PRIMAP-hist v2.6.1_final compared to v2.6_final for France
2025-03-19
Johannes Gütschow
Change analysis for France for PRIMAP-hist v2.6.1_final compared to v2.6_final
Overview over emissions by sector and gas
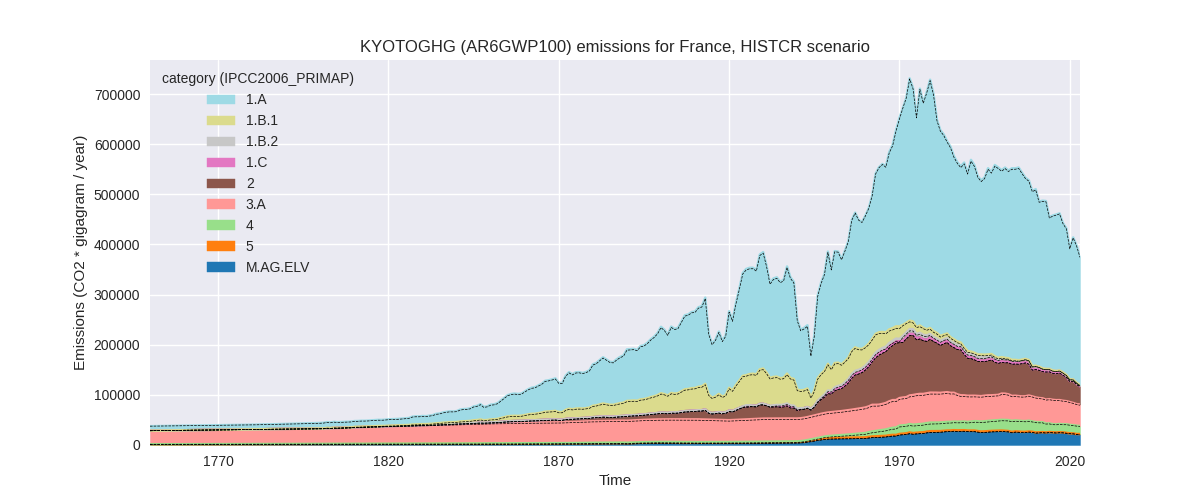
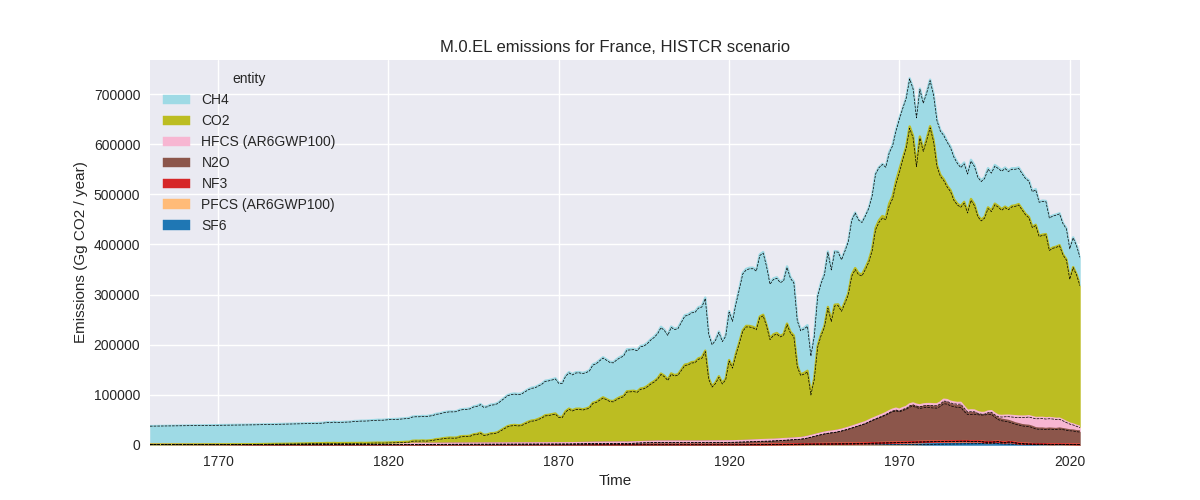
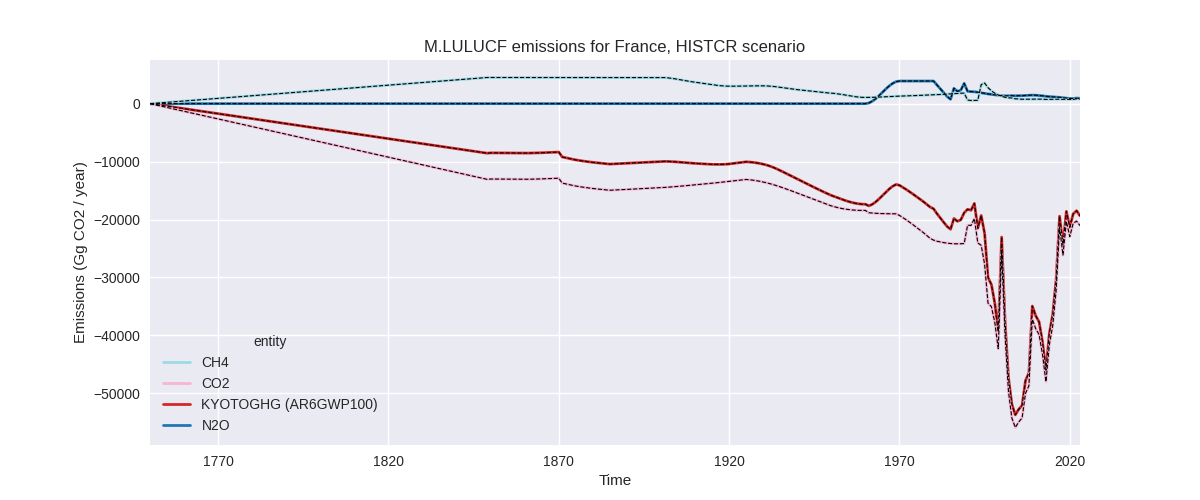
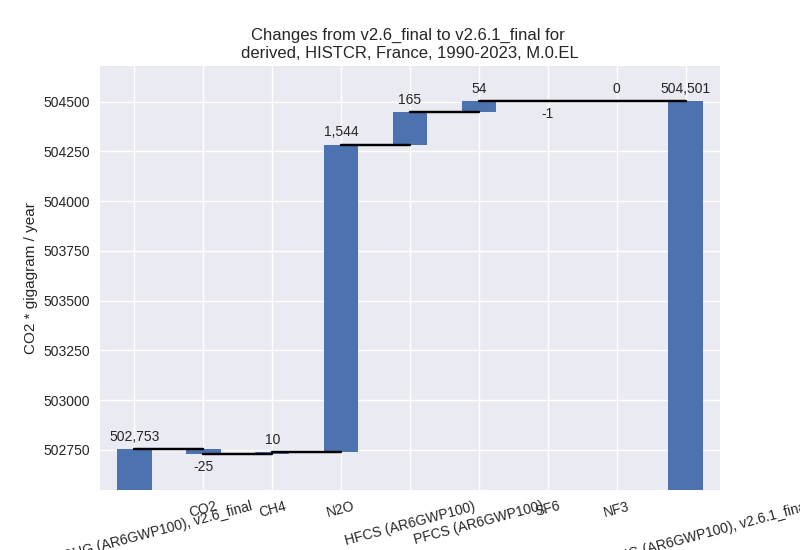
The following figures show the aggregate national total emissions excluding LULUCF AR6GWP100 for the country reported priority scenario. The dotted linesshow the v2.6_final data.
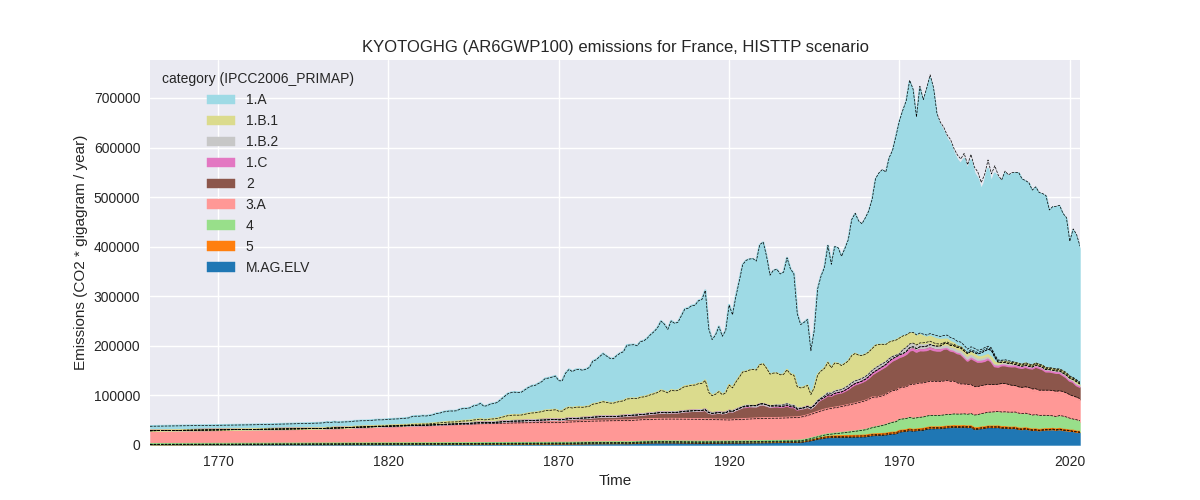
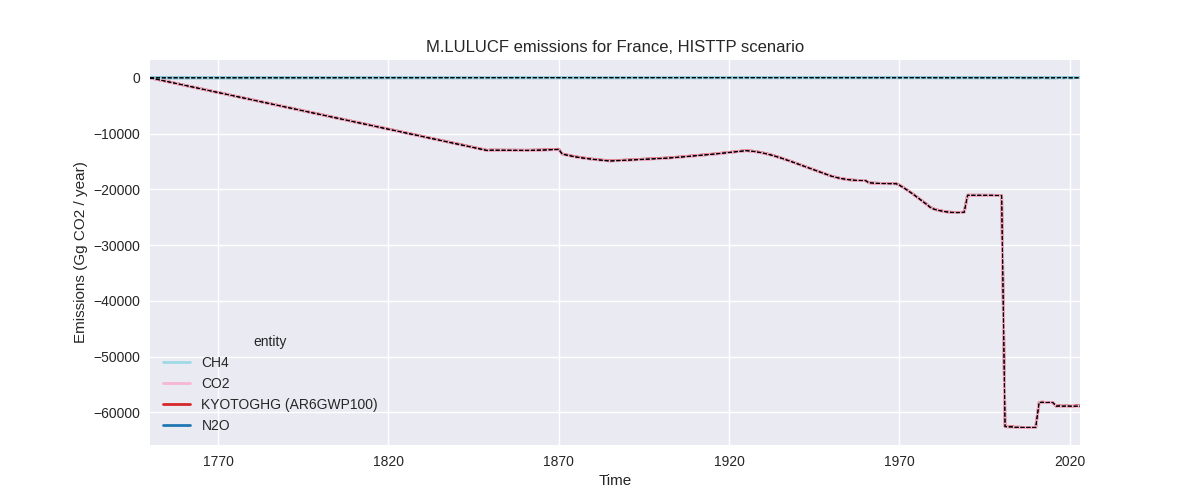
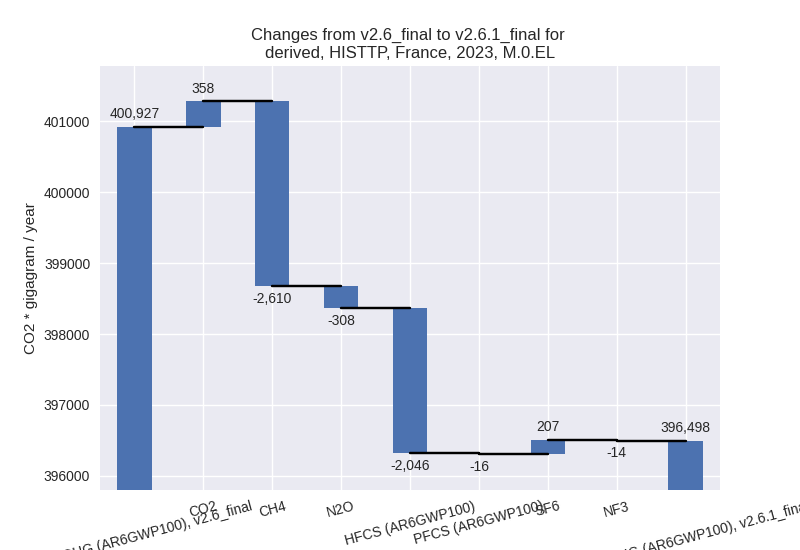
The following figures show the aggregate national total emissions excluding LULUCF AR6GWP100 for the third party priority scenario. The dotted linesshow the v2.6_final data.

Overview over changes
In the country reported priority scenario we have the following changes for aggregate Kyoto GHG and national total emissions excluding LULUCF (M.0.EL):
- Emissions in 2023 have changed by 0.3%% (1294.95 Gg CO2 / year)
- Emissions in 1990-2023 have changed by 0.3%% (1747.42 Gg CO2 / year)
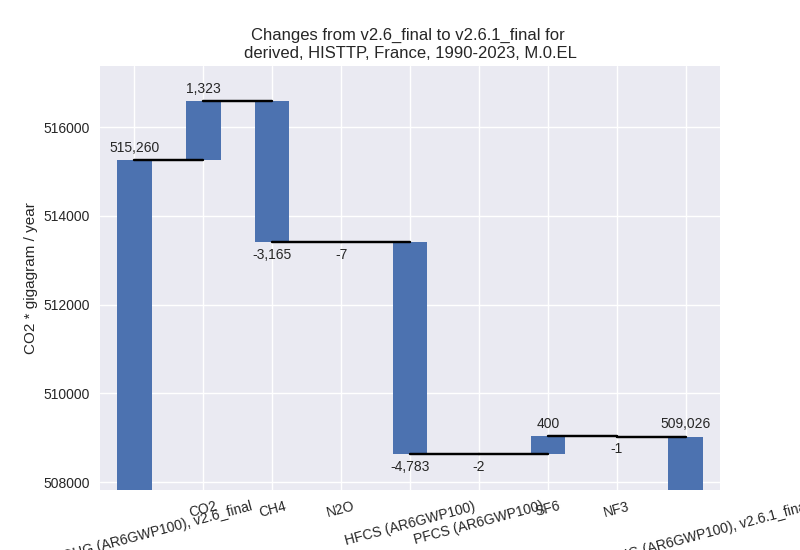
In the third party priority scenario we have the following changes for aggregate Kyoto GHG and national total emissions excluding LULUCF (M.0.EL):
- Emissions in 2023 have changed by -1.1%% (-4428.32 Gg CO2 / year)
- Emissions in 1990-2023 have changed by -1.2%% (-6234.03 Gg CO2 / year)
Most important changes per scenario and time frame
In the country reported priority scenario the following sector-gas combinations have the highest absolute impact on national total KyotoGHG (AR6GWP100) emissions in 2023 (top 5):
- 1: 2, CO2 with -1428.76 Gg CO2 / year (-5.3%)
- 2: 5, N2O with 771.18 Gg CO2 / year (inf%)
- 3: 3.A, CH4 with 652.58 Gg CO2 / year (1.6%)
- 4: 4, CH4 with -515.54 Gg CO2 / year (-3.7%)
- 5: 2, HFCS (AR6GWP100) with 448.77 Gg CO2 / year (5.2%)
In the country reported priority scenario the following sector-gas combinations have the highest absolute impact on national total KyotoGHG (AR6GWP100) emissions in 1990-2023 (top 5):
- 1: 5, N2O with 1526.91 Gg CO2 / year (inf%)
- 2: 2, HFCS (AR6GWP100) with 165.03 Gg CO2 / year (1.3%)
- 3: 2, PFCS (AR6GWP100) with 54.06 Gg CO2 / year (2.7%)
- 4: 2, CO2 with -42.02 Gg CO2 / year (-0.1%)
- 5: 3.A, CH4 with 19.19 Gg CO2 / year (0.0%)
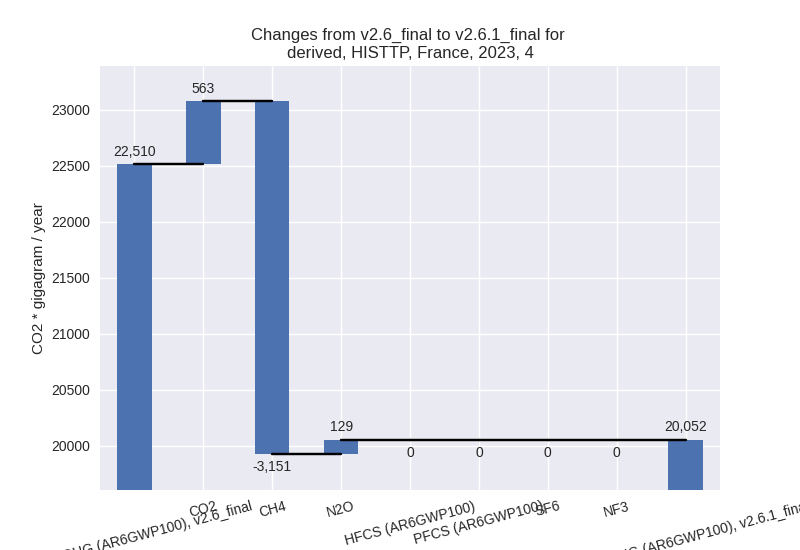
In the third party priority scenario the following sector-gas combinations have the highest absolute impact on national total KyotoGHG (AR6GWP100) emissions in 2023 (top 5):
- 1: 4, CH4 with -3151.05 Gg CO2 / year (-16.6%)
- 2: 2, HFCS (AR6GWP100) with -2045.66 Gg CO2 / year (-19.4%)
- 3: 2, CO2 with -1583.85 Gg CO2 / year (-9.6%)
- 4: 1.B.2, CO2 with 833.55 Gg CO2 / year (2119.6%)
- 5: 4, CO2 with 563.17 Gg CO2 / year (31.9%)
In the third party priority scenario the following sector-gas combinations have the highest absolute impact on national total KyotoGHG (AR6GWP100) emissions in 1990-2023 (top 5):
- 1: 2, HFCS (AR6GWP100) with -4783.18 Gg CO2 / year (-28.6%)
- 2: 4, CH4 with -3420.37 Gg CO2 / year (-13.6%)
- 3: 1.B.2, CO2 with 1135.28 Gg CO2 / year (1128.4%)
- 4: 2, SF6 with 400.10 Gg CO2 / year (41.0%)
- 5: 1.B.1, CH4 with 338.33 Gg CO2 / year (39.3%)
Notes on data changes
Here we list notes explaining important emissions changes for the country.
- CRT data has been included but replaces official data reported to the EU which does not show noteworthy differences. Changes in the CR time-series are small and come from updated third party data (EDGAR, FAO) which is used to extrapolate the country reported data.
- Cumulative emissions in the TP scenario are lower due to lower HFC emissions pre-2005 and lower waste CH4 emissions. Fugitive emissions and SF6 are higher. All changes are directly from new EDGAR data.
- These changes also impact 2023 emissions. A decrease of CO2 in 2.B in EDGAR data also leads to lower 2023 emissions.
Changes by sector and gas
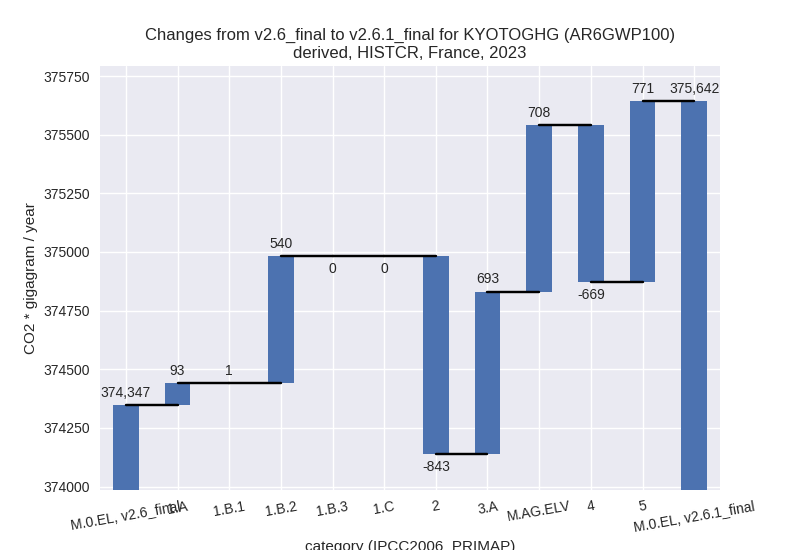
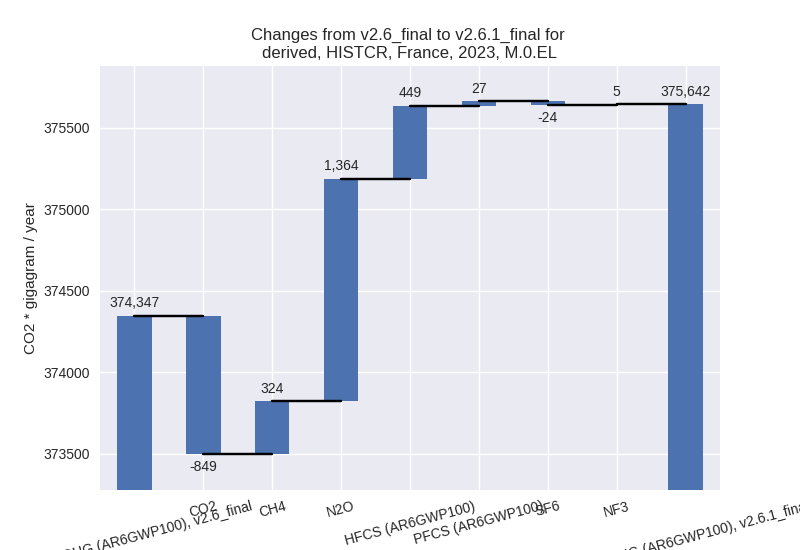
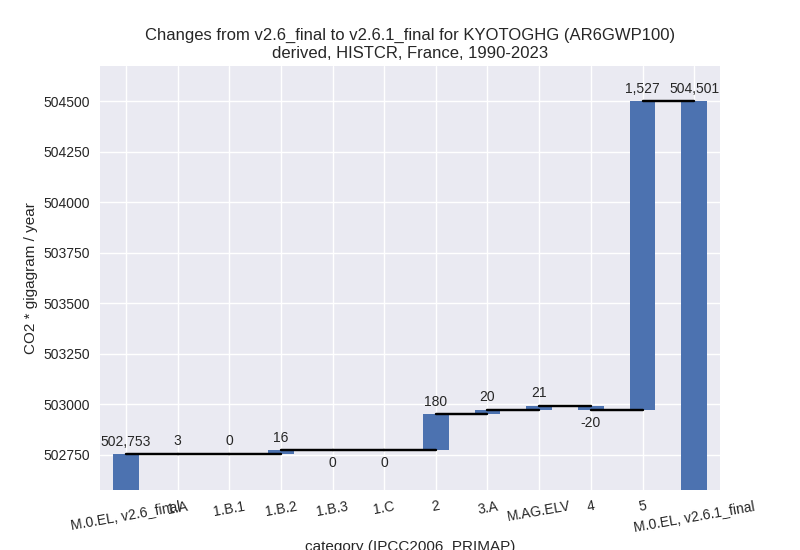
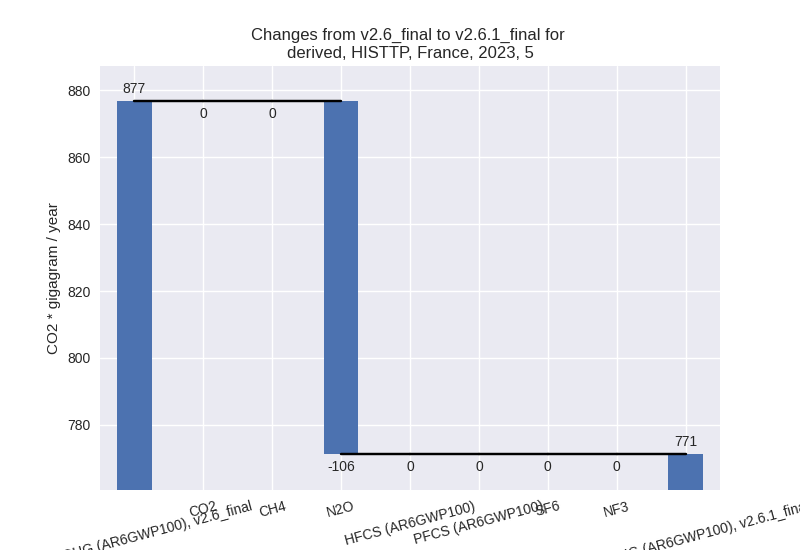
For each scenario and time frame the changes are displayed for all individual sectors and all individual gases. In the sector plot we use aggregate Kyoto GHGs in AR6GWP100. In the gas plot we usenational total emissions without LULUCF.
country reported scenario
2023
1990-2023
third party scenario
2023
1990-2023
Detailed changes for the scenarios:
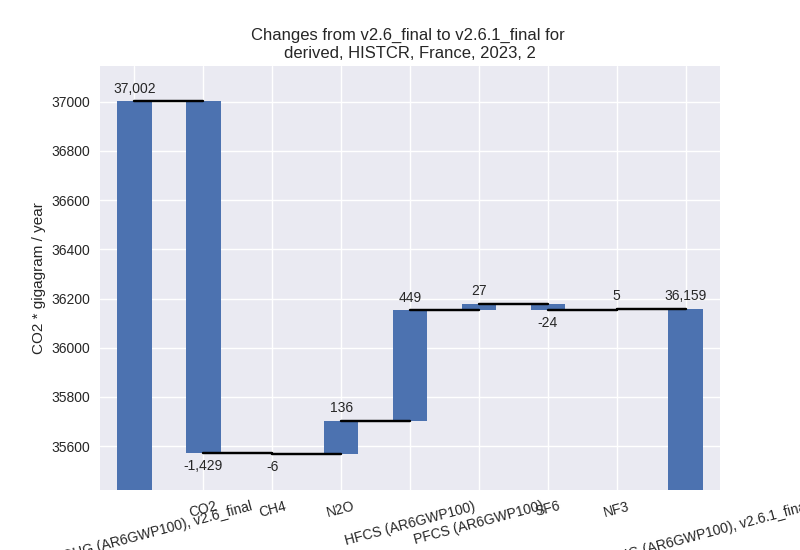
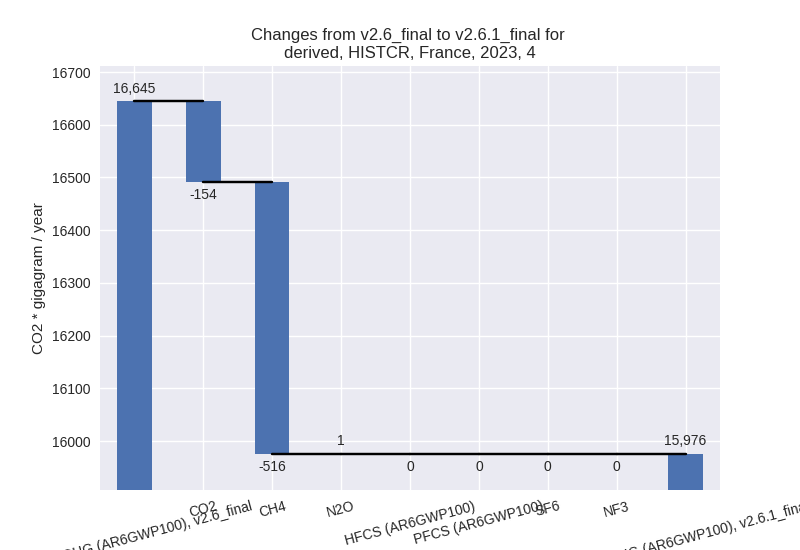
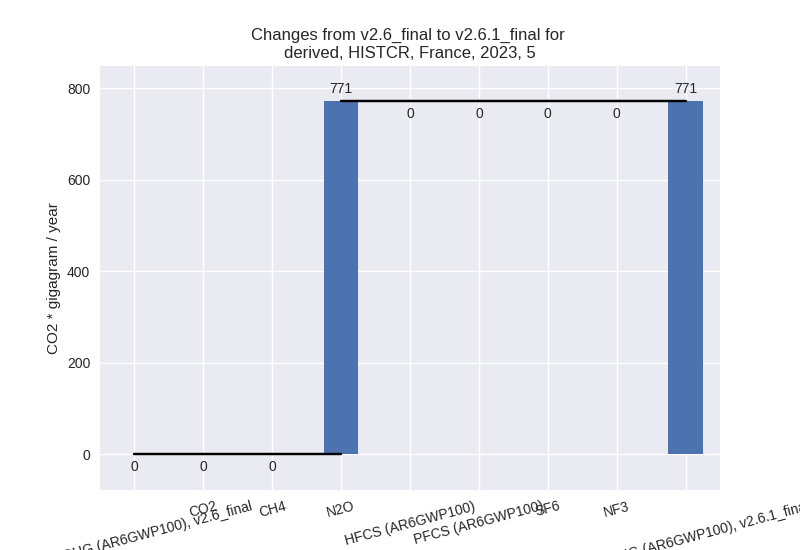
country reported scenario (HISTCR):
Most important changes per time frame
For 2023 the following sector-gas combinations have the highest absolute impact on national total KyotoGHG (AR6GWP100) emissions in 2023 (top 5):
- 1: 2, CO2 with -1428.76 Gg CO2 / year (-5.3%)
- 2: 5, N2O with 771.18 Gg CO2 / year (inf%)
- 3: 3.A, CH4 with 652.58 Gg CO2 / year (1.6%)
- 4: 4, CH4 with -515.54 Gg CO2 / year (-3.7%)
- 5: 2, HFCS (AR6GWP100) with 448.77 Gg CO2 / year (5.2%)
For 1990-2023 the following sector-gas combinations have the highest absolute impact on national total KyotoGHG (AR6GWP100) emissions in 1990-2023 (top 5):
- 1: 5, N2O with 1526.91 Gg CO2 / year (inf%)
- 2: 2, HFCS (AR6GWP100) with 165.03 Gg CO2 / year (1.3%)
- 3: 2, PFCS (AR6GWP100) with 54.06 Gg CO2 / year (2.7%)
- 4: 2, CO2 with -42.02 Gg CO2 / year (-0.1%)
- 5: 3.A, CH4 with 19.19 Gg CO2 / year (0.0%)
Changes in the main sectors for aggregate KyotoGHG (AR6GWP100) are
- 1: Total sectoral emissions in 2022 are 276428.54 Gg CO2 / year which is 69.5% of M.0.EL emissions. 2023 Emissions have changed by 0.2% (633.75 Gg CO2 / year). 1990-2023 Emissions have changed by 0.0% (18.64 Gg CO2 / year).
- 2: Total sectoral emissions in 2022 are 39953.02 Gg
CO2 / year which is 10.0% of M.0.EL emissions. 2023 Emissions have
changed by -2.3% (-843.00 Gg CO2 /
year). 1990-2023 Emissions have changed by 0.3% (180.31 Gg CO2 / year). For 2023 the
changes per gas
are:
- M.AG: Total sectoral emissions in 2022 are 64116.38
Gg CO2 / year which is 16.1% of M.0.EL emissions. 2023 Emissions have
changed by 2.2% (1401.70 Gg CO2 /
year). 1990-2023 Emissions have changed by 0.1% (41.23 Gg CO2 / year). For 2023 the
changes per gas
are:
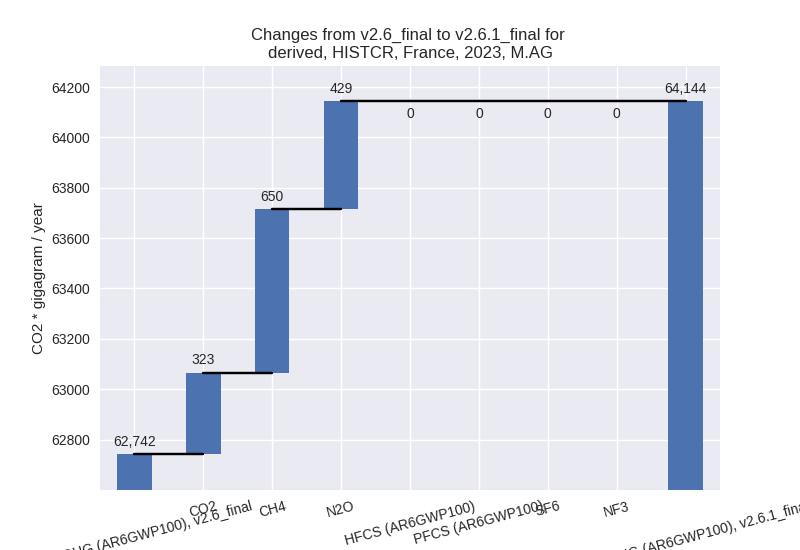
The changes come from the following subsectors:- 3.A: Total sectoral emissions in 2022 are 43012.14 Gg CO2 / year which is 67.1% of category M.AG emissions. 2023 Emissions have changed by 1.6% (693.24 Gg CO2 / year). 1990-2023 Emissions have changed by 0.0% (20.39 Gg CO2 / year).
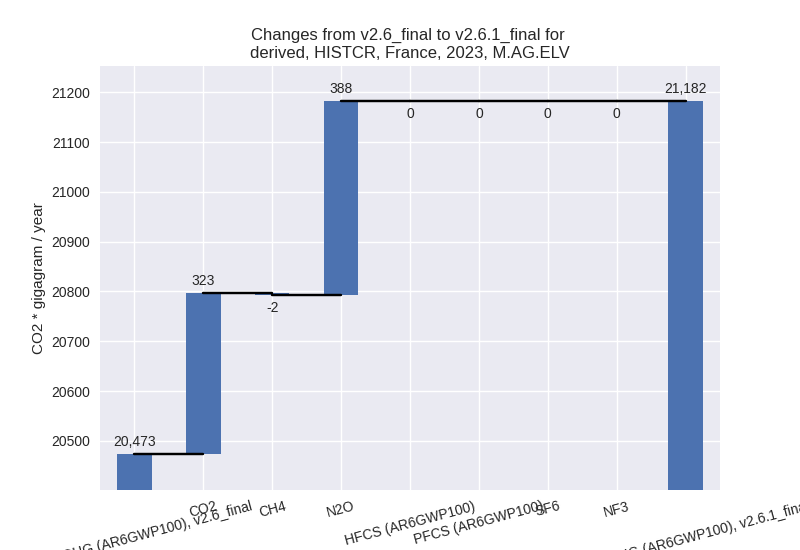
- M.AG.ELV: Total sectoral emissions in 2022 are
21104.24 Gg CO2 / year which is 32.9% of category M.AG emissions. 2023
Emissions have changed by 3.5%
(708.46 Gg CO2 / year). 1990-2023 Emissions have changed by 0.1% (20.84 Gg CO2 / year). For 2023 the
changes per gas
are:
There is no subsector information available in PRIMAP-hist.
- 4: Total sectoral emissions in 2022 are 16548.27 Gg
CO2 / year which is 4.2% of M.0.EL emissions. 2023 Emissions have
changed by -4.0% (-668.68 Gg CO2 /
year). 1990-2023 Emissions have changed by -0.1% (-19.67 Gg CO2 / year). For 2023 the
changes per gas
are:
- 5: Total sectoral emissions in 2022 are 835.44 Gg
CO2 / year which is 0.2% of M.0.EL emissions. 2023 Emissions have
changed by inf% (771.18 Gg CO2 /
year). 1990-2023 Emissions have changed by inf% (1526.91 Gg CO2 / year). For 2023 the
changes per gas
are:
For 1990-2023 the changes per gas are: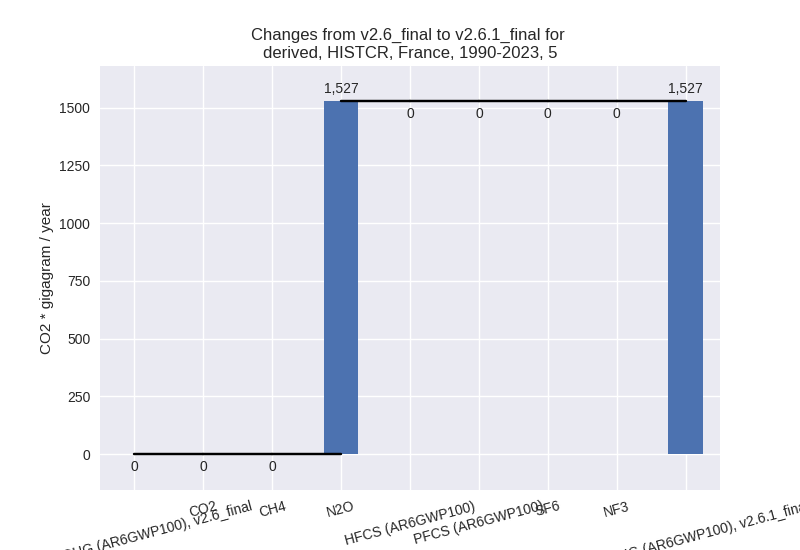
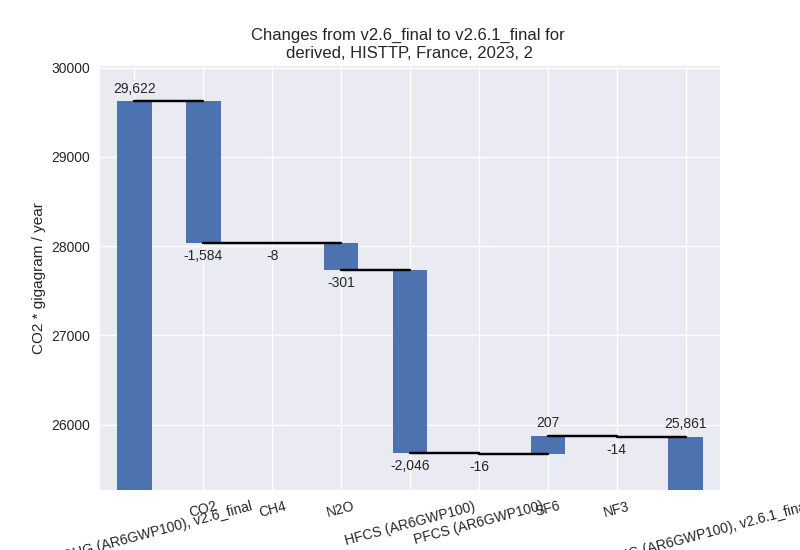
third party scenario (HISTTP):
Most important changes per time frame
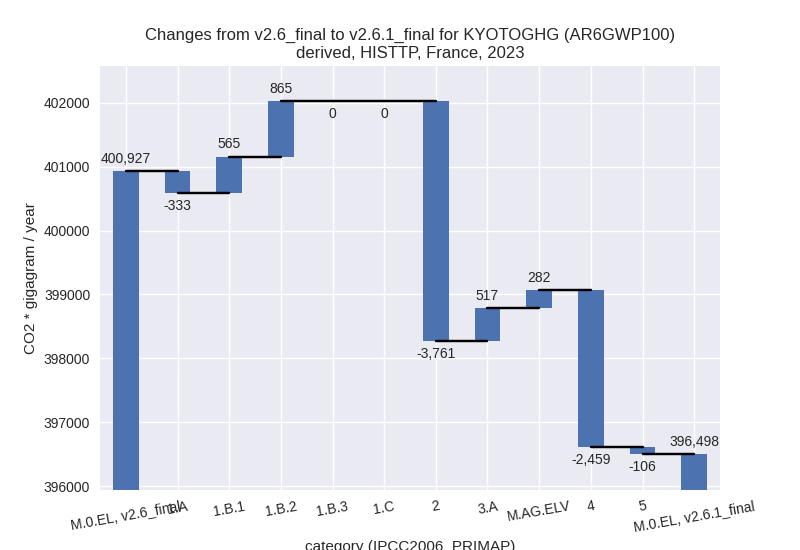
For 2023 the following sector-gas combinations have the highest absolute impact on national total KyotoGHG (AR6GWP100) emissions in 2023 (top 5):
- 1: 4, CH4 with -3151.05 Gg CO2 / year (-16.6%)
- 2: 2, HFCS (AR6GWP100) with -2045.66 Gg CO2 / year (-19.4%)
- 3: 2, CO2 with -1583.85 Gg CO2 / year (-9.6%)
- 4: 1.B.2, CO2 with 833.55 Gg CO2 / year (2119.6%)
- 5: 4, CO2 with 563.17 Gg CO2 / year (31.9%)
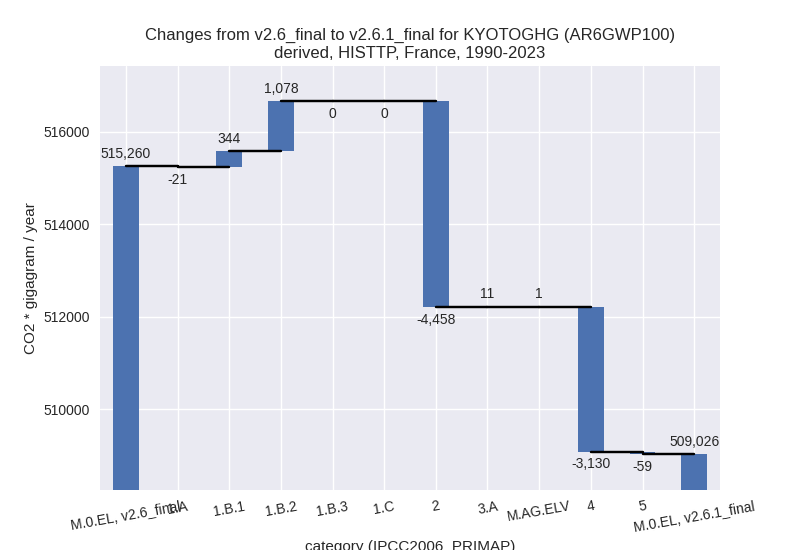
For 1990-2023 the following sector-gas combinations have the highest absolute impact on national total KyotoGHG (AR6GWP100) emissions in 1990-2023 (top 5):
- 1: 2, HFCS (AR6GWP100) with -4783.18 Gg CO2 / year (-28.6%)
- 2: 4, CH4 with -3420.37 Gg CO2 / year (-13.6%)
- 3: 1.B.2, CO2 with 1135.28 Gg CO2 / year (1128.4%)
- 4: 2, SF6 with 400.10 Gg CO2 / year (41.0%)
- 5: 1.B.1, CH4 with 338.33 Gg CO2 / year (39.3%)
Changes in the main sectors for aggregate KyotoGHG (AR6GWP100) are
- 1: Total sectoral emissions in 2022 are 298151.60 Gg CO2 / year which is 71.2% of M.0.EL emissions. 2023 Emissions have changed by 0.4% (1097.83 Gg CO2 / year). 1990-2023 Emissions have changed by 0.4% (1401.84 Gg CO2 / year).
- 2: Total sectoral emissions in 2022 are 28512.37 Gg
CO2 / year which is 6.8% of M.0.EL emissions. 2023 Emissions have
changed by -12.7% (-3760.91 Gg CO2 /
year). 1990-2023 Emissions have changed by -9.4% (-4458.08 Gg CO2 / year). For 2023
the changes per gas
are:
For 1990-2023 the changes per gas are: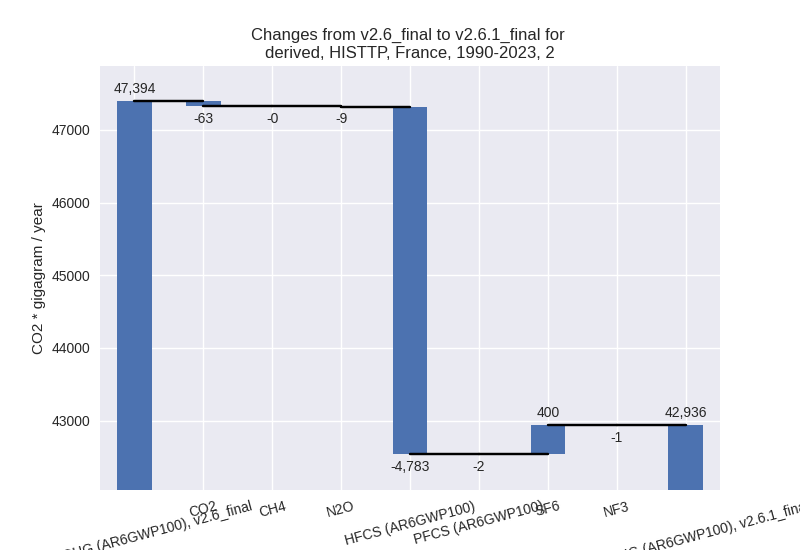
- M.AG: Total sectoral emissions in 2022 are 70810.39 Gg CO2 / year which is 16.9% of M.0.EL emissions. 2023 Emissions have changed by 1.1% (799.33 Gg CO2 / year). 1990-2023 Emissions have changed by 0.0% (11.07 Gg CO2 / year).
- 4: Total sectoral emissions in 2022 are 20712.97 Gg
CO2 / year which is 4.9% of M.0.EL emissions. 2023 Emissions have
changed by -10.9% (-2458.97 Gg CO2 /
year). 1990-2023 Emissions have changed by -11.0% (-3130.29 Gg CO2 / year). For 2023
the changes per gas
are:
For 1990-2023 the changes per gas are: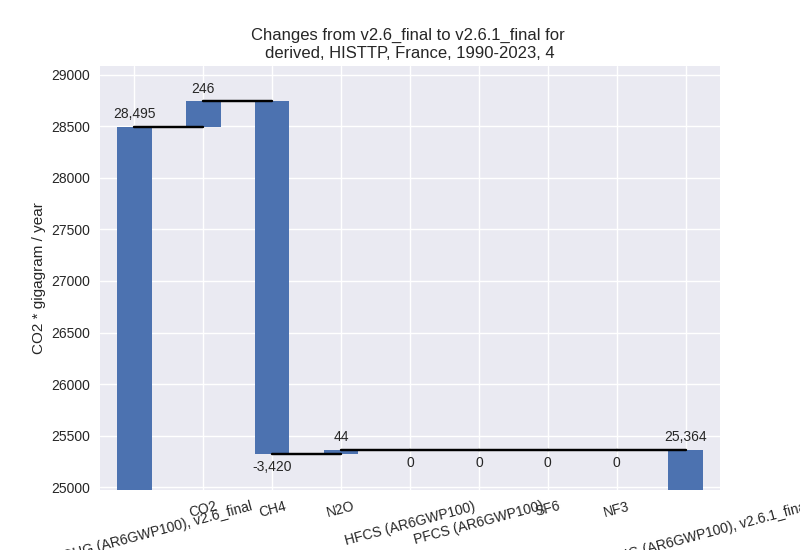
- 5: Total sectoral emissions in 2022 are 835.44 Gg
CO2 / year which is 0.2% of M.0.EL emissions. 2023 Emissions have
changed by -12.0% (-105.59 Gg CO2 /
year). 1990-2023 Emissions have changed by -3.7% (-58.57 Gg CO2 / year). For 2023 the
changes per gas
are:
For 1990-2023 the changes per gas are: