Changes in PRIMAP-hist v2.6.1_final compared to v2.6_final for Gambia
2025-03-19
Johannes Gütschow
Change analysis for Gambia for PRIMAP-hist v2.6.1_final compared to v2.6_final
Overview over emissions by sector and gas
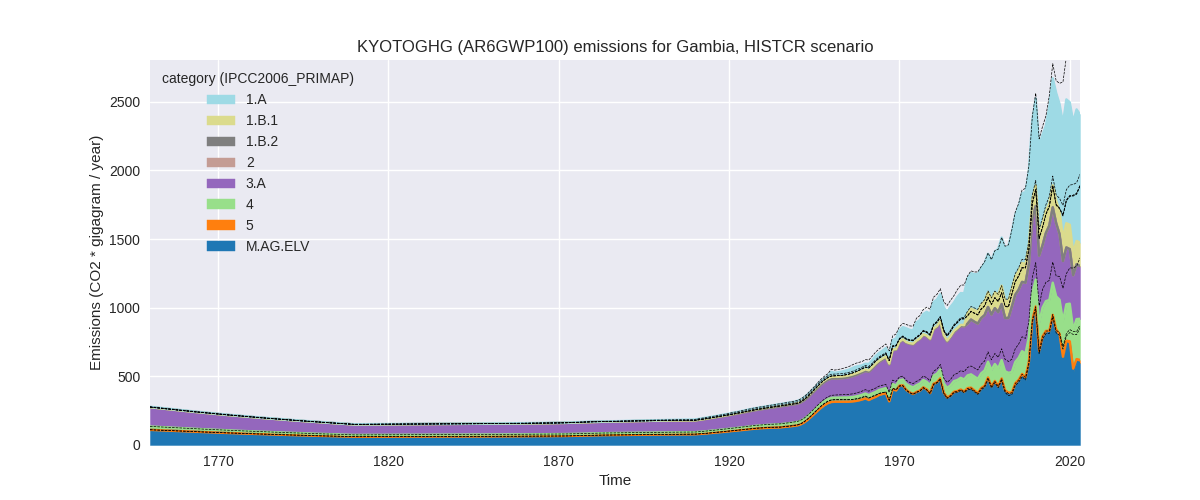
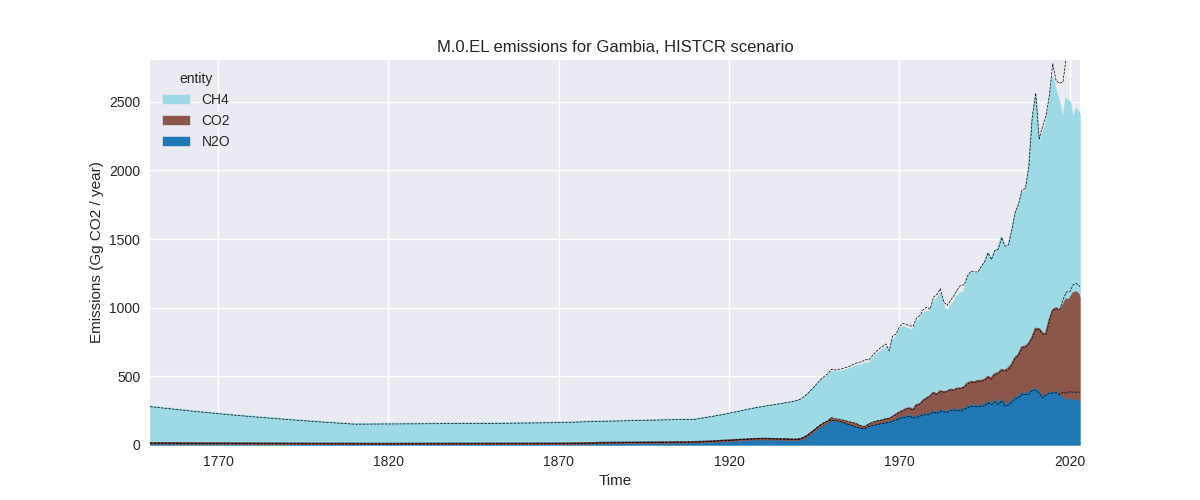
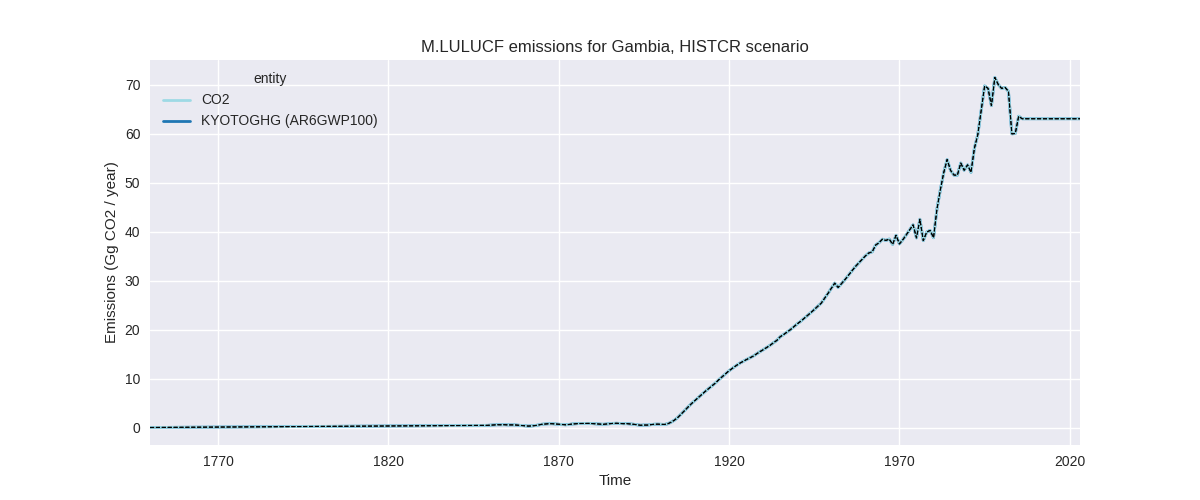
The following figures show the aggregate national total emissions excluding LULUCF AR6GWP100 for the country reported priority scenario. The dotted linesshow the v2.6_final data.
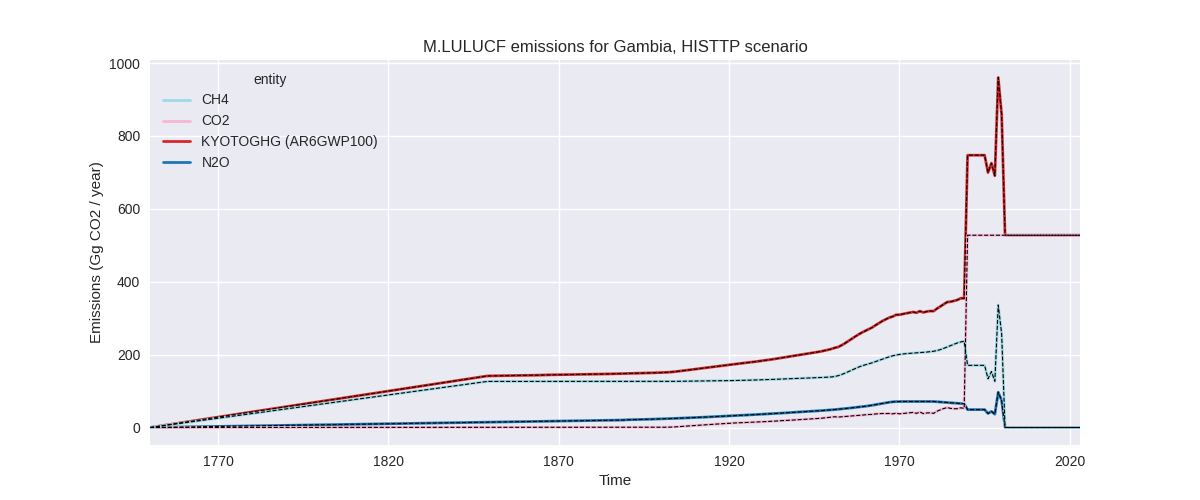
The following figures show the aggregate national total emissions excluding LULUCF AR6GWP100 for the third party priority scenario. The dotted linesshow the v2.6_final data.


Overview over changes
In the country reported priority scenario we have the following changes for aggregate Kyoto GHG and national total emissions excluding LULUCF (M.0.EL):
- Emissions in 2023 have changed by -19.2%% (-572.89 Gg CO2 / year)
- Emissions in 1990-2023 have changed by -5.2%% (-104.35 Gg CO2 / year)
In the third party priority scenario we have the following changes for aggregate Kyoto GHG and national total emissions excluding LULUCF (M.0.EL):
- Emissions in 2023 have changed by -19.1%% (-543.90 Gg CO2 / year)
- Emissions in 1990-2023 have changed by -5.0%% (-97.56 Gg CO2 / year)
Most important changes per scenario and time frame
In the country reported priority scenario the following sector-gas combinations have the highest absolute impact on national total KyotoGHG (AR6GWP100) emissions in 2023 (top 5):
- 1: 4, CH4 with -193.44 Gg CO2 / year (-41.5%)
- 2: M.AG.ELV, CH4 with -182.39 Gg CO2 / year (-33.2%)
- 3: 3.A, CH4 with -141.34 Gg CO2 / year (-27.3%)
- 4: 1.B.1, CH4 with 87.71 Gg CO2 / year (109.8%)
- 5: M.AG.ELV, N2O with -70.41 Gg CO2 / year (-23.4%)
In the country reported priority scenario the following sector-gas combinations have the highest absolute impact on national total KyotoGHG (AR6GWP100) emissions in 1990-2023 (top 5):
- 1: 4, CH4 with -115.69 Gg CO2 / year (-41.4%)
- 2: 1.B.1, CH4 with 75.83 Gg CO2 / year (131.9%)
- 3: 3.A, CH4 with -22.21 Gg CO2 / year (-4.8%)
- 4: M.AG.ELV, CH4 with -17.21 Gg CO2 / year (-5.4%)
- 5: 1.A, CH4 with -15.86 Gg CO2 / year (-10.9%)
In the third party priority scenario the following sector-gas combinations have the highest absolute impact on national total KyotoGHG (AR6GWP100) emissions in 2023 (top 5):
- 1: 4, CH4 with -193.44 Gg CO2 / year (-41.5%)
- 2: M.AG.ELV, CH4 with -182.39 Gg CO2 / year (-33.2%)
- 3: 3.A, CH4 with -141.34 Gg CO2 / year (-27.3%)
- 4: 1.B.1, CH4 with 87.71 Gg CO2 / year (109.8%)
- 5: M.AG.ELV, N2O with -70.41 Gg CO2 / year (-23.4%)
In the third party priority scenario the following sector-gas combinations have the highest absolute impact on national total KyotoGHG (AR6GWP100) emissions in 1990-2023 (top 5):
- 1: 4, CH4 with -115.69 Gg CO2 / year (-41.4%)
- 2: 1.B.1, CH4 with 75.83 Gg CO2 / year (131.9%)
- 3: 3.A, CH4 with -22.21 Gg CO2 / year (-4.8%)
- 4: M.AG.ELV, CH4 with -17.21 Gg CO2 / year (-5.4%)
- 5: M.AG.ELV, N2O with -10.18 Gg CO2 / year (-3.6%)
Notes on data changes
Here we list notes explaining important emissions changes for the country.
- No new country reported data has been included. As country reported data only covers a few sectors, the CR time-series has high changes similar to the TP time-series.
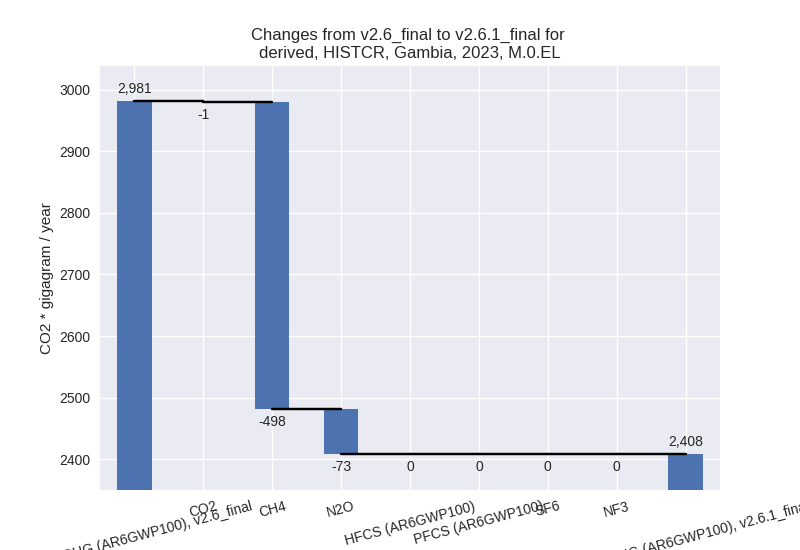
- 2023 emissions are much lower mostly due to lower waste CH4 emissions in the updated EDGAR data and lower agricultural emissions as the new FAO data corrects agricultural emissions downwards for post-2017. CH4 emissions in 1.B.1 are much higher in new EDGAR data.
- For cumulative emissions the main reasons for changes are waste CH4 and CH in 1.B.1 (directly from EDGAR).
Changes by sector and gas
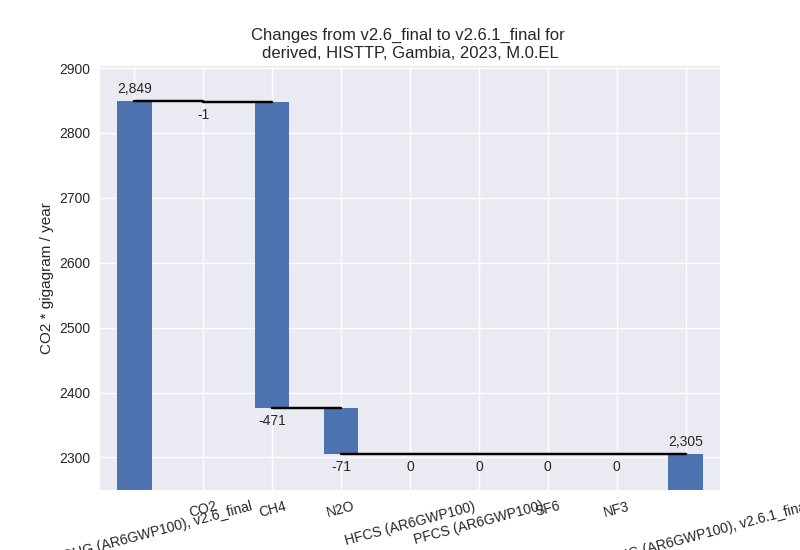
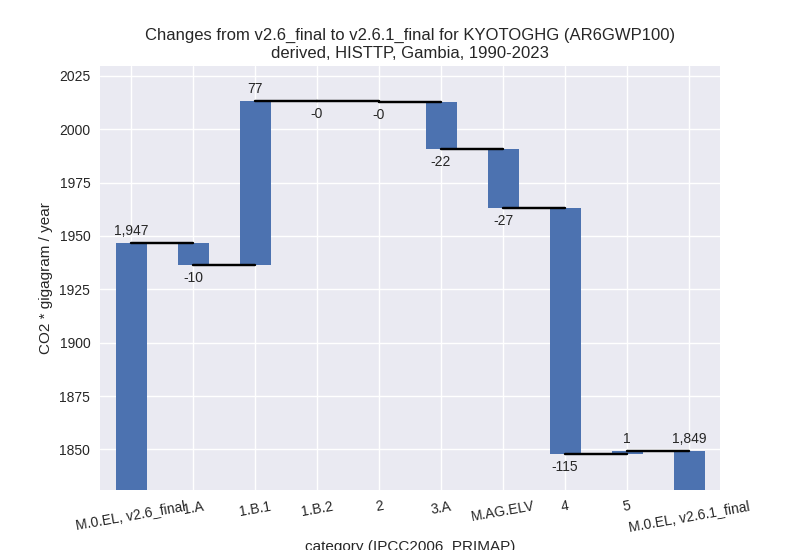
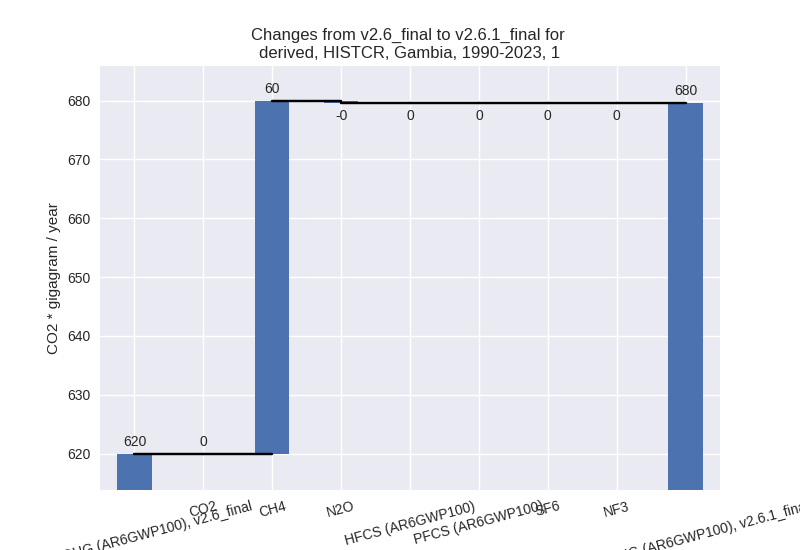
For each scenario and time frame the changes are displayed for all individual sectors and all individual gases. In the sector plot we use aggregate Kyoto GHGs in AR6GWP100. In the gas plot we usenational total emissions without LULUCF.
country reported scenario
2023
1990-2023

third party scenario
2023
1990-2023

Detailed changes for the scenarios:
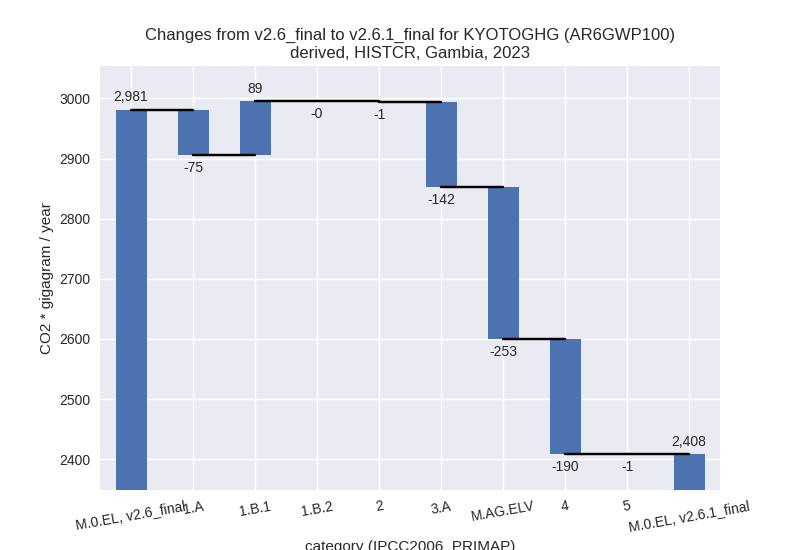
country reported scenario (HISTCR):
Most important changes per time frame
For 2023 the following sector-gas combinations have the highest absolute impact on national total KyotoGHG (AR6GWP100) emissions in 2023 (top 5):
- 1: 4, CH4 with -193.44 Gg CO2 / year (-41.5%)
- 2: M.AG.ELV, CH4 with -182.39 Gg CO2 / year (-33.2%)
- 3: 3.A, CH4 with -141.34 Gg CO2 / year (-27.3%)
- 4: 1.B.1, CH4 with 87.71 Gg CO2 / year (109.8%)
- 5: M.AG.ELV, N2O with -70.41 Gg CO2 / year (-23.4%)
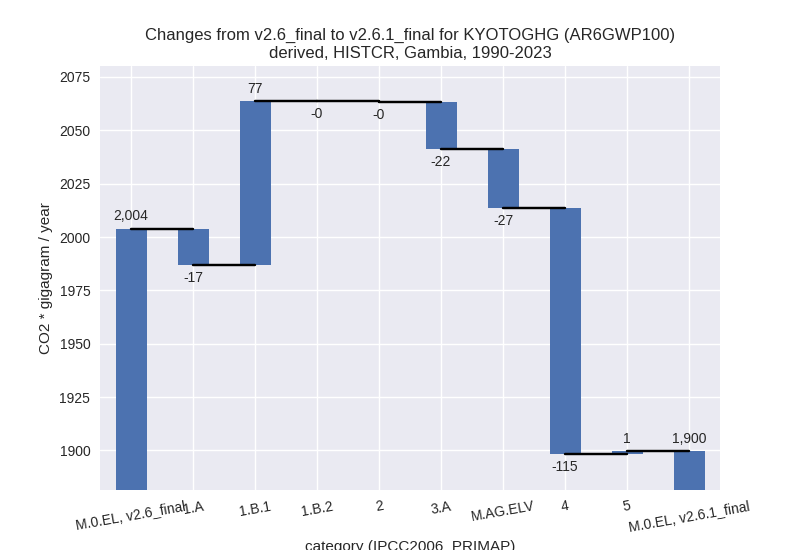
For 1990-2023 the following sector-gas combinations have the highest absolute impact on national total KyotoGHG (AR6GWP100) emissions in 1990-2023 (top 5):
- 1: 4, CH4 with -115.69 Gg CO2 / year (-41.4%)
- 2: 1.B.1, CH4 with 75.83 Gg CO2 / year (131.9%)
- 3: 3.A, CH4 with -22.21 Gg CO2 / year (-4.8%)
- 4: M.AG.ELV, CH4 with -17.21 Gg CO2 / year (-5.4%)
- 5: 1.A, CH4 with -15.86 Gg CO2 / year (-10.9%)
Changes in the main sectors for aggregate KyotoGHG (AR6GWP100) are
- 1: Total sectoral emissions in 2022 are 1128.36 Gg
CO2 / year which is 46.1% of M.0.EL emissions. 2023 Emissions have
changed by 1.3% (14.12 Gg CO2 /
year). 1990-2023 Emissions have changed by 9.6% (59.64 Gg CO2 / year). For 1990-2023
the changes per gas
are:
The changes come from the following subsectors:- 1.A: Total sectoral emissions in 2022 are 958.57 Gg
CO2 / year which is 85.0% of category 1 emissions. 2023 Emissions have
changed by -7.4% (-74.75 Gg CO2 /
year). 1990-2023 Emissions have changed by -3.1% (-17.20 Gg CO2 / year). For 2023 the
changes per gas
are:

For 1990-2023 the changes per gas are:
There is no subsector information available in PRIMAP-hist. - 1.B.1: Total sectoral emissions in 2022 are 169.79
Gg CO2 / year which is 15.0% of category 1 emissions. 2023 Emissions
have changed by 109.8% (88.87 Gg CO2
/ year). 1990-2023 Emissions have changed by 131.9% (76.84 Gg CO2 / year). For 2023 the
changes per gas
are:
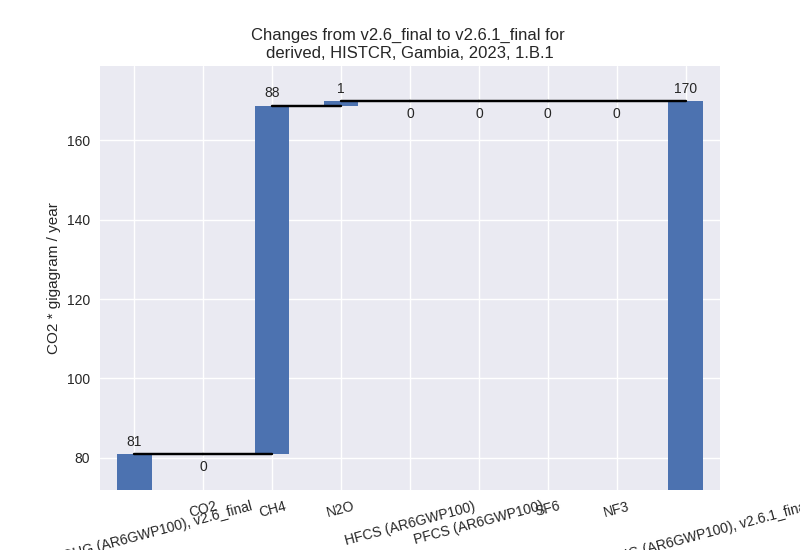
For 1990-2023 the changes per gas are:
There is no subsector information available in PRIMAP-hist. - 1.B.2: Total sectoral emissions in 2022 are 0.00 Gg
CO2 / year which is 0.0% of category 1 emissions. 2023 Emissions have
changed by -30.9% (-0.00 Gg CO2 /
year). 1990-2023 Emissions have changed by -35.8% (-0.00 Gg CO2 / year). For 2023 the
changes per gas
are:
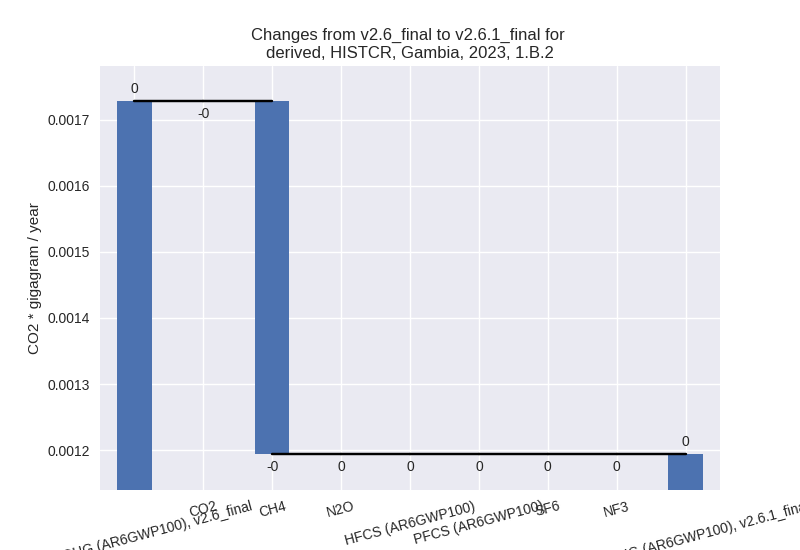
For 1990-2023 the changes per gas are:
There is no subsector information available in PRIMAP-hist.
- 1.A: Total sectoral emissions in 2022 are 958.57 Gg
CO2 / year which is 85.0% of category 1 emissions. 2023 Emissions have
changed by -7.4% (-74.75 Gg CO2 /
year). 1990-2023 Emissions have changed by -3.1% (-17.20 Gg CO2 / year). For 2023 the
changes per gas
are:
- 2: Total sectoral emissions in 2022 are 5.03 Gg CO2
/ year which is 0.2% of M.0.EL emissions. 2023 Emissions have changed by
-18.5% (-1.19 Gg CO2 / year).
1990-2023 Emissions have changed by -4.9% (-0.20 Gg CO2 / year). For 2023 the
changes per gas
are:

For 1990-2023 the changes per gas are:
- M.AG: Total sectoral emissions in 2022 are 999.21
Gg CO2 / year which is 40.9% of M.0.EL emissions. 2023 Emissions have
changed by -28.8% (-394.69 Gg CO2 /
year). 1990-2023 Emissions have changed by -4.6% (-49.69 Gg CO2 / year). For 2023 the
changes per gas
are:
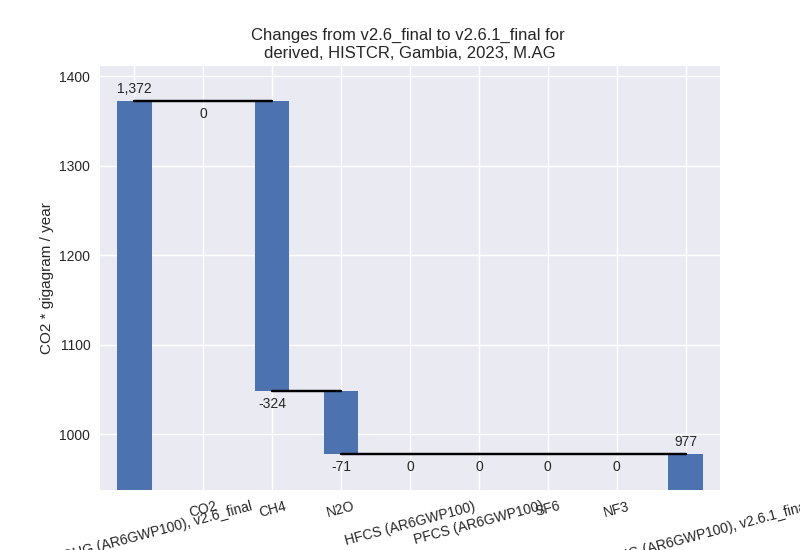
For 1990-2023 the changes per gas are: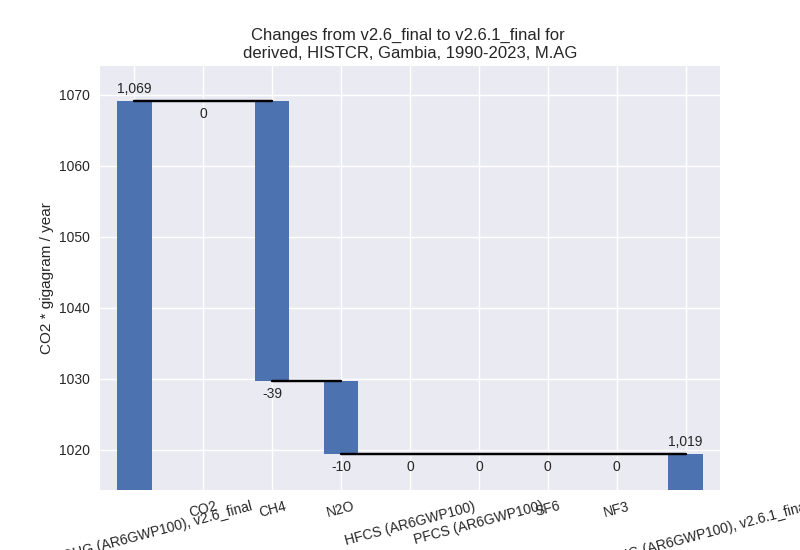
The changes come from the following subsectors:- 3.A: Total sectoral emissions in 2022 are 394.54 Gg
CO2 / year which is 39.5% of category M.AG emissions. 2023 Emissions
have changed by -27.2% (-141.89 Gg
CO2 / year). 1990-2023 Emissions have changed by -4.8% (-22.30 Gg CO2 / year). For 2023 the
changes per gas
are:

For 1990-2023 the changes per gas are:
There is no subsector information available in PRIMAP-hist. - M.AG.ELV: Total sectoral emissions in 2022 are
604.67 Gg CO2 / year which is 60.5% of category M.AG emissions. 2023
Emissions have changed by -29.7%
(-252.80 Gg CO2 / year). 1990-2023 Emissions have changed by -4.6% (-27.39 Gg CO2 / year). For 2023 the
changes per gas
are:
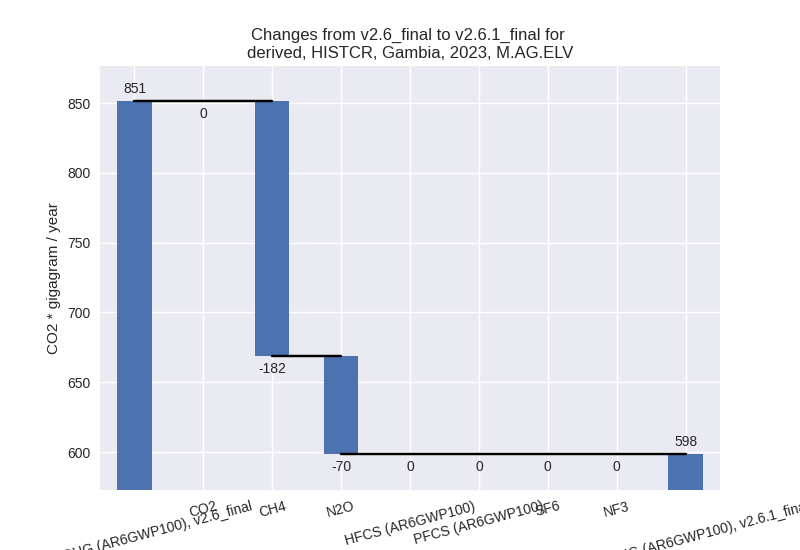
For 1990-2023 the changes per gas are:
There is no subsector information available in PRIMAP-hist.
- 3.A: Total sectoral emissions in 2022 are 394.54 Gg
CO2 / year which is 39.5% of category M.AG emissions. 2023 Emissions
have changed by -27.2% (-141.89 Gg
CO2 / year). 1990-2023 Emissions have changed by -4.8% (-22.30 Gg CO2 / year). For 2023 the
changes per gas
are:
- 4: Total sectoral emissions in 2022 are 290.98 Gg
CO2 / year which is 11.9% of M.0.EL emissions. 2023 Emissions have
changed by -38.9% (-190.48 Gg CO2 /
year). 1990-2023 Emissions have changed by -39.0% (-115.42 Gg CO2 / year). For 2023
the changes per gas
are:
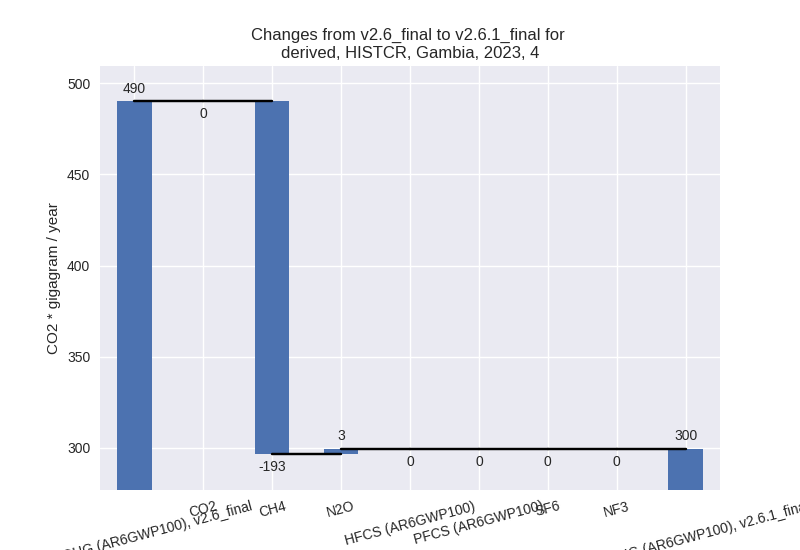
For 1990-2023 the changes per gas are:
- 5: Total sectoral emissions in 2022 are 21.45 Gg
CO2 / year which is 0.9% of M.0.EL emissions. 2023 Emissions have
changed by -3.0% (-0.66 Gg CO2 /
year). 1990-2023 Emissions have changed by 8.6% (1.32 Gg CO2 / year). For 2023 the
changes per gas
are:
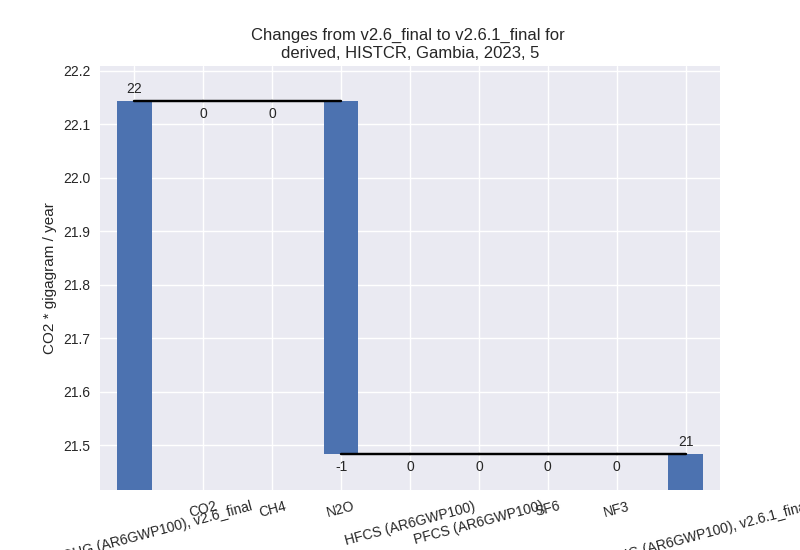
For 1990-2023 the changes per gas are: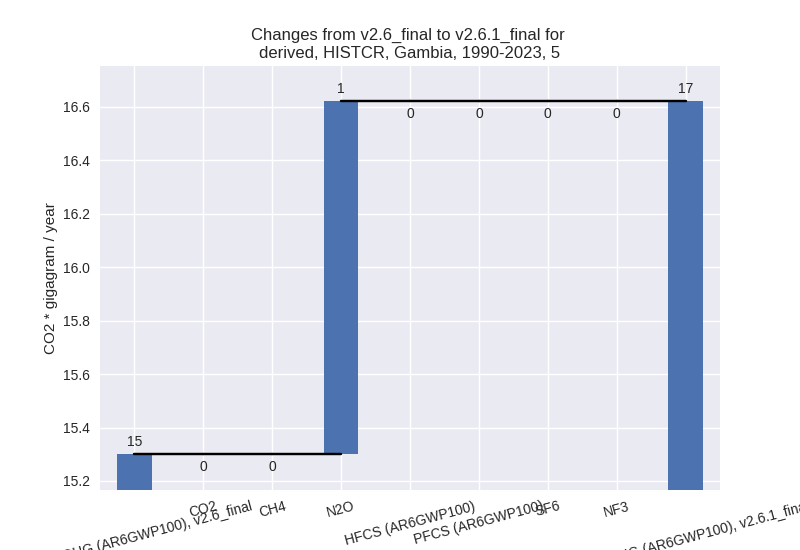
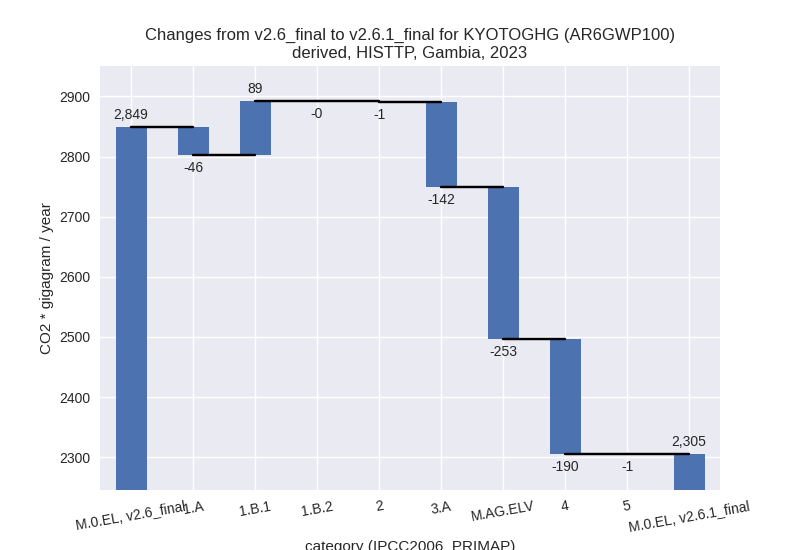
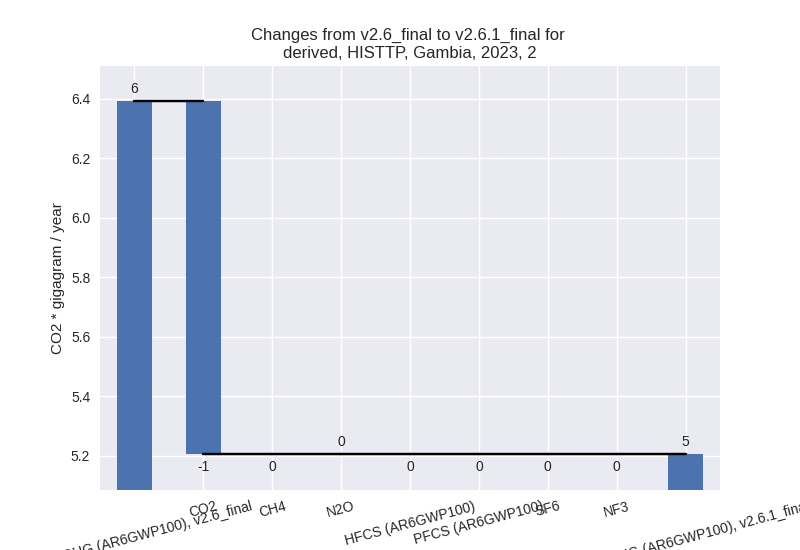
third party scenario (HISTTP):
Most important changes per time frame
For 2023 the following sector-gas combinations have the highest absolute impact on national total KyotoGHG (AR6GWP100) emissions in 2023 (top 5):
- 1: 4, CH4 with -193.44 Gg CO2 / year (-41.5%)
- 2: M.AG.ELV, CH4 with -182.39 Gg CO2 / year (-33.2%)
- 3: 3.A, CH4 with -141.34 Gg CO2 / year (-27.3%)
- 4: 1.B.1, CH4 with 87.71 Gg CO2 / year (109.8%)
- 5: M.AG.ELV, N2O with -70.41 Gg CO2 / year (-23.4%)
For 1990-2023 the following sector-gas combinations have the highest absolute impact on national total KyotoGHG (AR6GWP100) emissions in 1990-2023 (top 5):
- 1: 4, CH4 with -115.69 Gg CO2 / year (-41.4%)
- 2: 1.B.1, CH4 with 75.83 Gg CO2 / year (131.9%)
- 3: 3.A, CH4 with -22.21 Gg CO2 / year (-4.8%)
- 4: M.AG.ELV, CH4 with -17.21 Gg CO2 / year (-5.4%)
- 5: M.AG.ELV, N2O with -10.18 Gg CO2 / year (-3.6%)
Changes in the main sectors for aggregate KyotoGHG (AR6GWP100) are
- 1: Total sectoral emissions in 2022 are 1024.22 Gg
CO2 / year which is 43.8% of M.0.EL emissions. 2023 Emissions have
changed by 4.5% (43.12 Gg CO2 /
year). 1990-2023 Emissions have changed by 11.8% (66.42 Gg CO2 / year). For 2023 the
changes per gas
are:
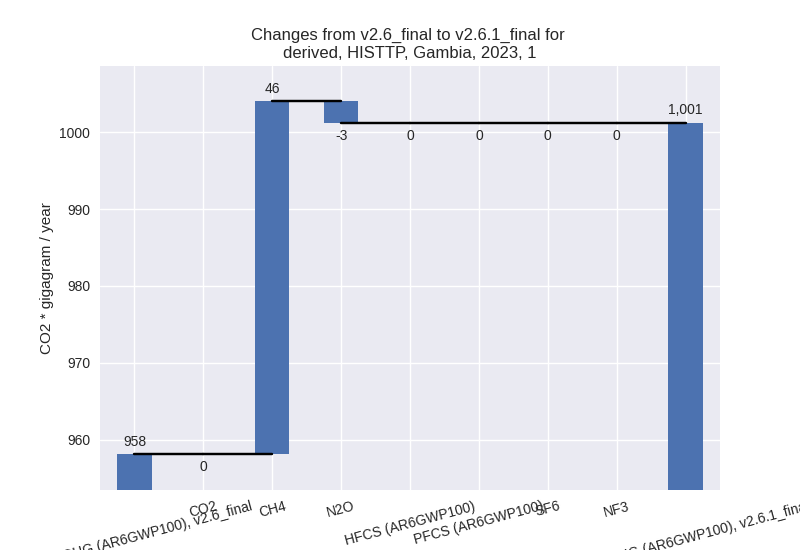
For 1990-2023 the changes per gas are:
The changes come from the following subsectors:- 1.A: Total sectoral emissions in 2022 are 854.44 Gg
CO2 / year which is 83.4% of category 1 emissions. 2023 Emissions have
changed by -5.2% (-45.75 Gg CO2 /
year). 1990-2023 Emissions have changed by -2.1% (-10.42 Gg CO2 / year). For 2023 the
changes per gas
are:

For 1990-2023 the changes per gas are: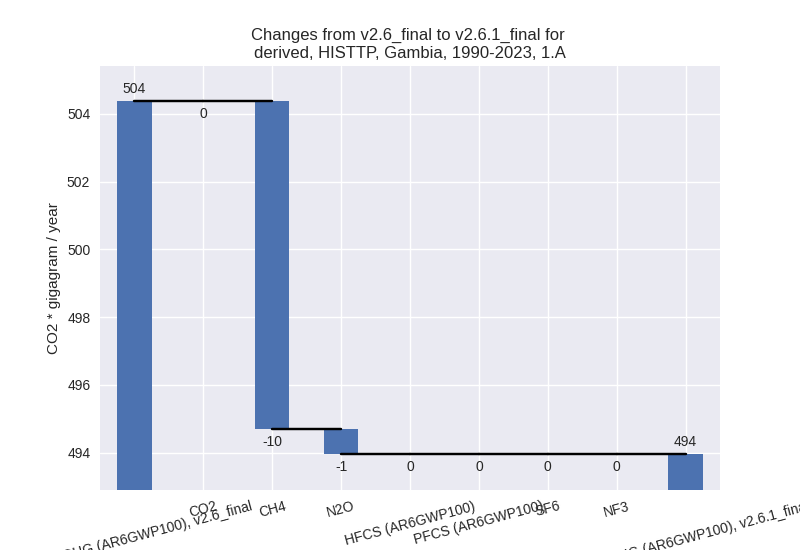
There is no subsector information available in PRIMAP-hist. - 1.B.1: Total sectoral emissions in 2022 are 169.79
Gg CO2 / year which is 16.6% of category 1 emissions. 2023 Emissions
have changed by 109.8% (88.87 Gg CO2
/ year). 1990-2023 Emissions have changed by 131.9% (76.84 Gg CO2 / year). For 2023 the
changes per gas
are:

For 1990-2023 the changes per gas are:
There is no subsector information available in PRIMAP-hist. - 1.B.2: Total sectoral emissions in 2022 are 0.00 Gg
CO2 / year which is 0.0% of category 1 emissions. 2023 Emissions have
changed by -30.9% (-0.00 Gg CO2 /
year). 1990-2023 Emissions have changed by -35.8% (-0.00 Gg CO2 / year). For 2023 the
changes per gas
are:

For 1990-2023 the changes per gas are:
There is no subsector information available in PRIMAP-hist.
- 1.A: Total sectoral emissions in 2022 are 854.44 Gg
CO2 / year which is 83.4% of category 1 emissions. 2023 Emissions have
changed by -5.2% (-45.75 Gg CO2 /
year). 1990-2023 Emissions have changed by -2.1% (-10.42 Gg CO2 / year). For 2023 the
changes per gas
are:
- 2: Total sectoral emissions in 2022 are 5.03 Gg CO2
/ year which is 0.2% of M.0.EL emissions. 2023 Emissions have changed by
-18.5% (-1.19 Gg CO2 / year).
1990-2023 Emissions have changed by -4.9% (-0.20 Gg CO2 / year). For 2023 the
changes per gas
are:
For 1990-2023 the changes per gas are: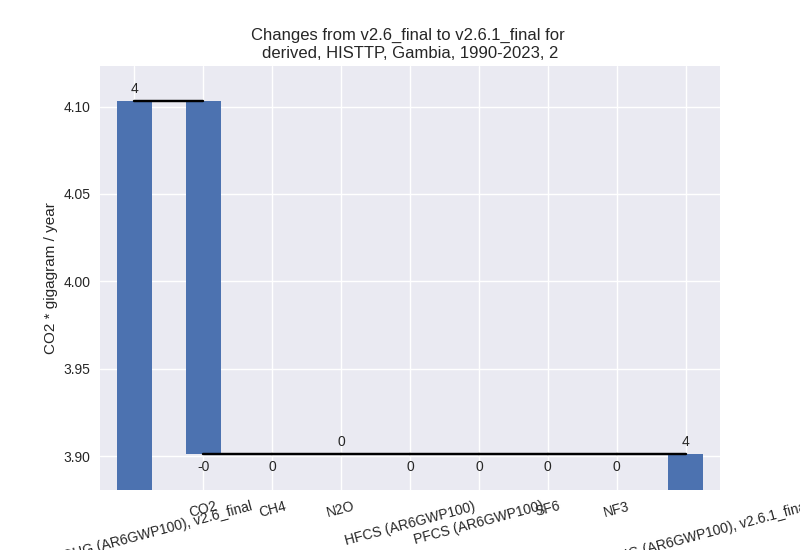
- M.AG: Total sectoral emissions in 2022 are 999.21
Gg CO2 / year which is 42.7% of M.0.EL emissions. 2023 Emissions have
changed by -28.8% (-394.69 Gg CO2 /
year). 1990-2023 Emissions have changed by -4.6% (-49.69 Gg CO2 / year). For 2023 the
changes per gas
are:
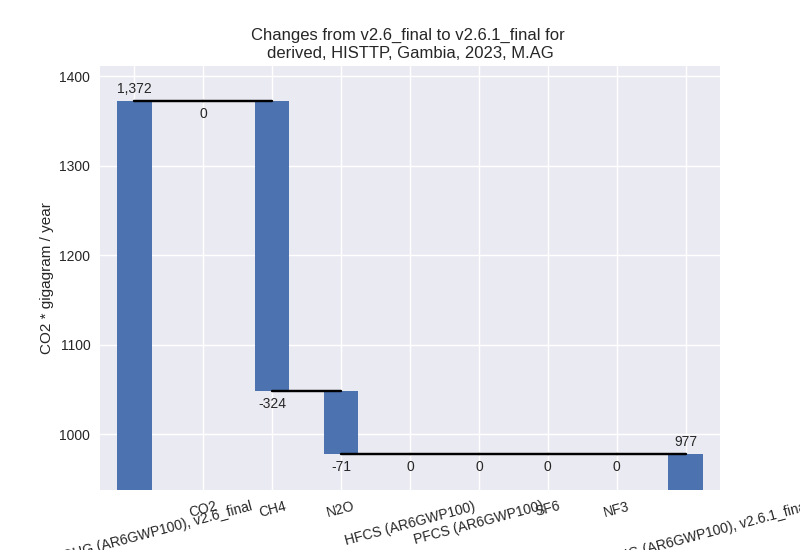
For 1990-2023 the changes per gas are:
The changes come from the following subsectors:- 3.A: Total sectoral emissions in 2022 are 394.54 Gg
CO2 / year which is 39.5% of category M.AG emissions. 2023 Emissions
have changed by -27.2% (-141.89 Gg
CO2 / year). 1990-2023 Emissions have changed by -4.8% (-22.30 Gg CO2 / year). For 2023 the
changes per gas
are:

For 1990-2023 the changes per gas are:
There is no subsector information available in PRIMAP-hist. - M.AG.ELV: Total sectoral emissions in 2022 are
604.67 Gg CO2 / year which is 60.5% of category M.AG emissions. 2023
Emissions have changed by -29.7%
(-252.80 Gg CO2 / year). 1990-2023 Emissions have changed by -4.6% (-27.39 Gg CO2 / year). For 2023 the
changes per gas
are:

For 1990-2023 the changes per gas are: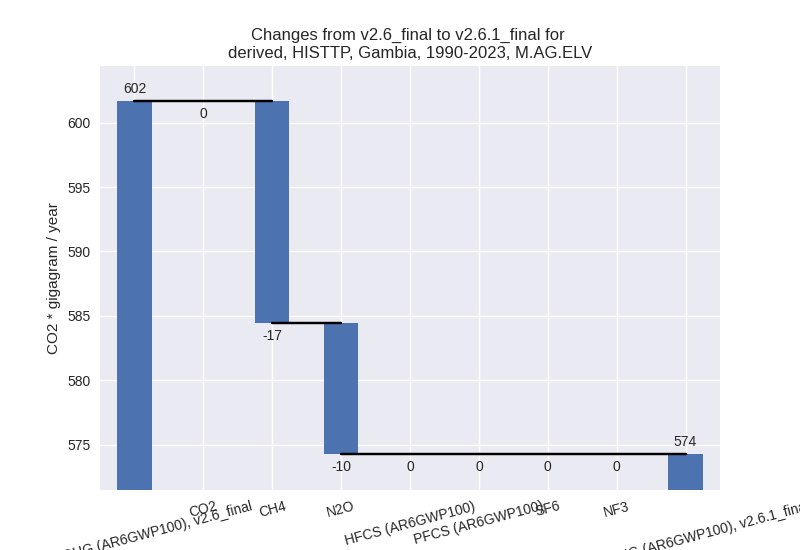
There is no subsector information available in PRIMAP-hist.
- 3.A: Total sectoral emissions in 2022 are 394.54 Gg
CO2 / year which is 39.5% of category M.AG emissions. 2023 Emissions
have changed by -27.2% (-141.89 Gg
CO2 / year). 1990-2023 Emissions have changed by -4.8% (-22.30 Gg CO2 / year). For 2023 the
changes per gas
are:
- 4: Total sectoral emissions in 2022 are 290.98 Gg
CO2 / year which is 12.4% of M.0.EL emissions. 2023 Emissions have
changed by -38.9% (-190.48 Gg CO2 /
year). 1990-2023 Emissions have changed by -39.0% (-115.42 Gg CO2 / year). For 2023
the changes per gas
are:

For 1990-2023 the changes per gas are:
- 5: Total sectoral emissions in 2022 are 21.45 Gg
CO2 / year which is 0.9% of M.0.EL emissions. 2023 Emissions have
changed by -3.0% (-0.66 Gg CO2 /
year). 1990-2023 Emissions have changed by 8.6% (1.32 Gg CO2 / year). For 2023 the
changes per gas
are:

For 1990-2023 the changes per gas are: