Changes in PRIMAP-hist v2.6.1_final compared to v2.6_final for Guatemala
2025-03-19
Johannes Gütschow
Change analysis for Guatemala for PRIMAP-hist v2.6.1_final compared to v2.6_final
Overview over emissions by sector and gas
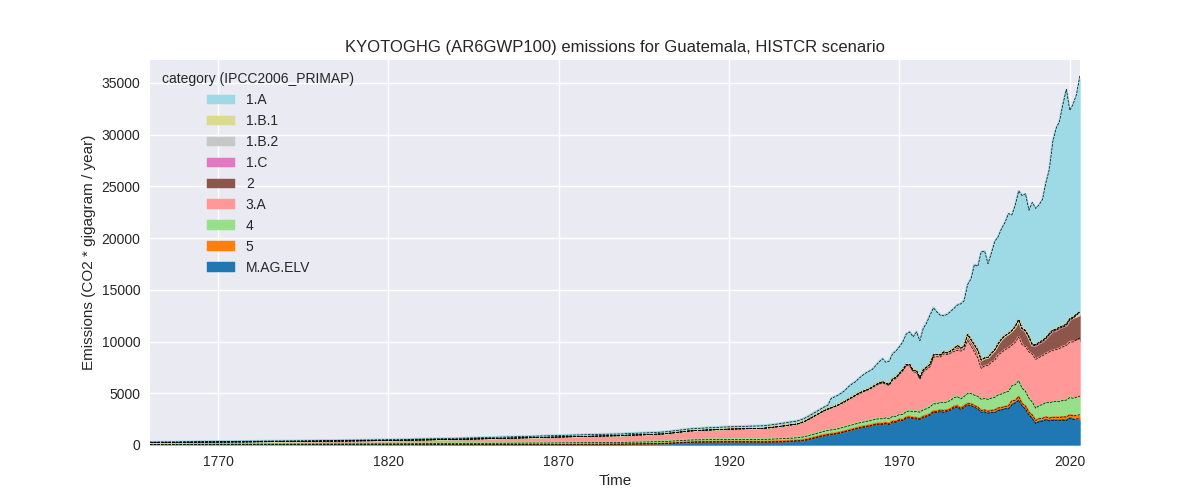
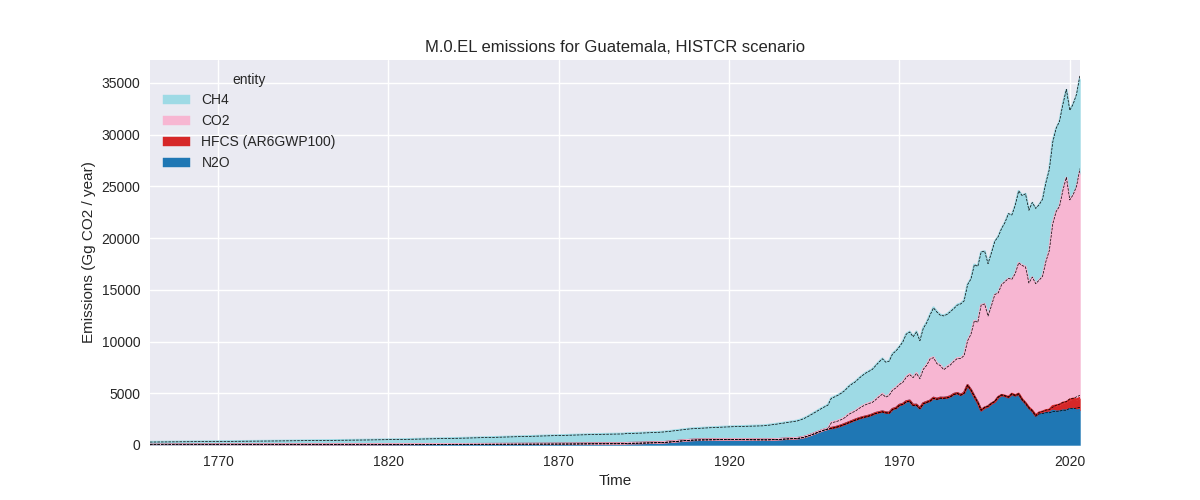
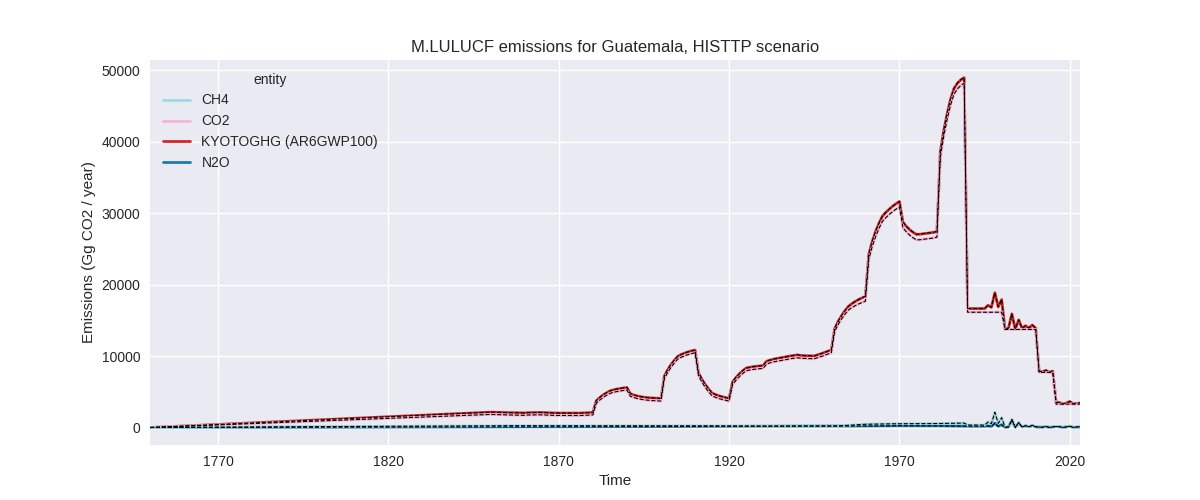
The following figures show the aggregate national total emissions excluding LULUCF AR6GWP100 for the country reported priority scenario. The dotted linesshow the v2.6_final data.
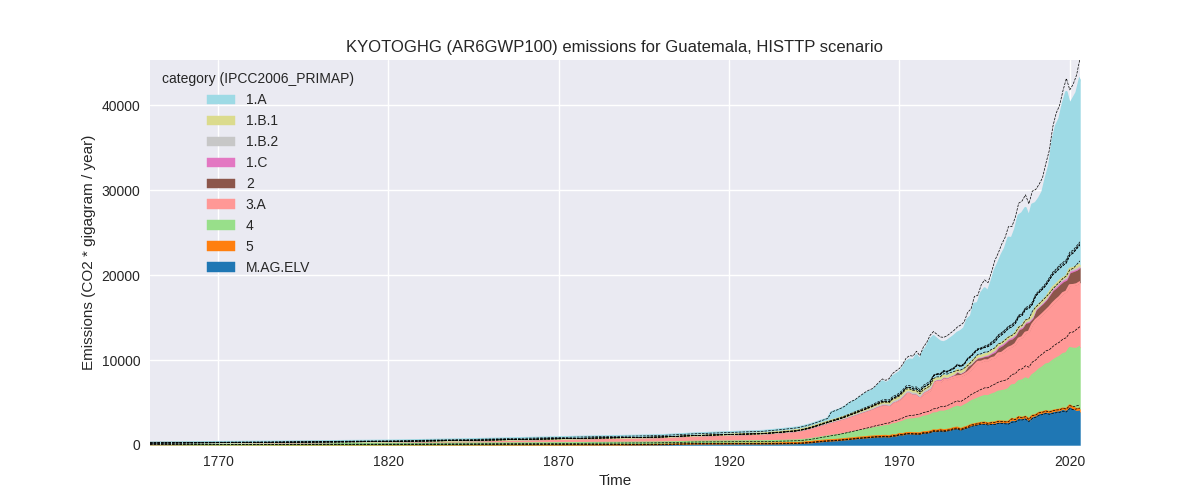
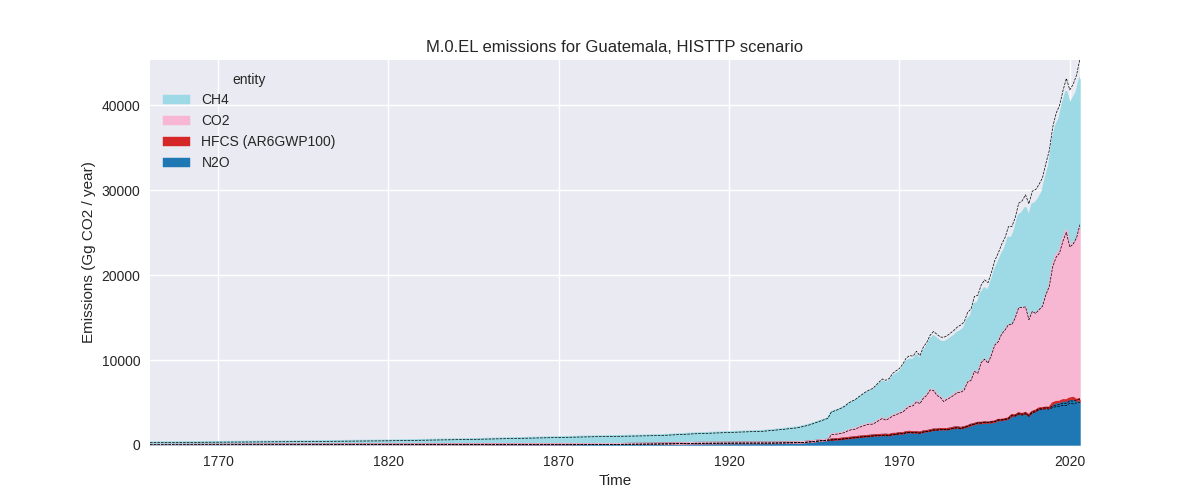
The following figures show the aggregate national total emissions excluding LULUCF AR6GWP100 for the third party priority scenario. The dotted linesshow the v2.6_final data.
Overview over changes
In the country reported priority scenario we have the following changes for aggregate Kyoto GHG and national total emissions excluding LULUCF (M.0.EL):
- Emissions in 2023 have changed by -0.9%% (-321.14 Gg CO2 / year)
- Emissions in 1990-2023 have changed by -0.1%% (-34.42 Gg CO2 / year)
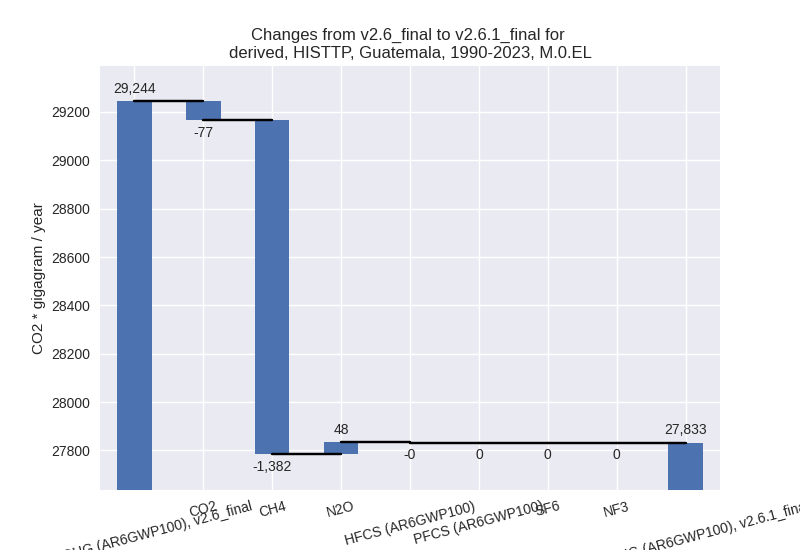
In the third party priority scenario we have the following changes for aggregate Kyoto GHG and national total emissions excluding LULUCF (M.0.EL):
- Emissions in 2023 have changed by -5.1%% (-2327.48 Gg CO2 / year)
- Emissions in 1990-2023 have changed by -4.8%% (-1411.30 Gg CO2 / year)
Most important changes per scenario and time frame
In the country reported priority scenario the following sector-gas combinations have the highest absolute impact on national total KyotoGHG (AR6GWP100) emissions in 2023 (top 5):
- 1: M.AG.ELV, N2O with -178.20 Gg CO2 / year (-7.6%)
- 2: 3.A, CH4 with -89.57 Gg CO2 / year (-1.6%)
- 3: 1.A, N2O with -61.12 Gg CO2 / year (-13.4%)
- 4: 1.A, CH4 with 27.12 Gg CO2 / year (1.5%)
- 5: M.AG.ELV, CO2 with -17.01 Gg CO2 / year (-27.2%)
In the country reported priority scenario the following sector-gas combinations have the highest absolute impact on national total KyotoGHG (AR6GWP100) emissions in 1990-2023 (top 5):
- 1: 5, N2O with -21.82 Gg CO2 / year (-8.1%)
- 2: M.AG.ELV, N2O with -9.14 Gg CO2 / year (-0.3%)
- 3: 1.A, N2O with -5.38 Gg CO2 / year (-2.0%)
- 4: 1.A, CH4 with 4.16 Gg CO2 / year (0.3%)
- 5: 2, CO2 with 2.32 Gg CO2 / year (0.2%)
In the third party priority scenario the following sector-gas combinations have the highest absolute impact on national total KyotoGHG (AR6GWP100) emissions in 2023 (top 5):
- 1: 4, CH4 with -1954.40 Gg CO2 / year (-21.8%)
- 2: 1.A, N2O with 290.47 Gg CO2 / year (53.7%)
- 3: M.AG.ELV, N2O with -274.71 Gg CO2 / year (-7.6%)
- 4: M.AG.ELV, CO2 with -165.35 Gg CO2 / year (-27.2%)
- 5: 2, CO2 with -142.89 Gg CO2 / year (-9.4%)
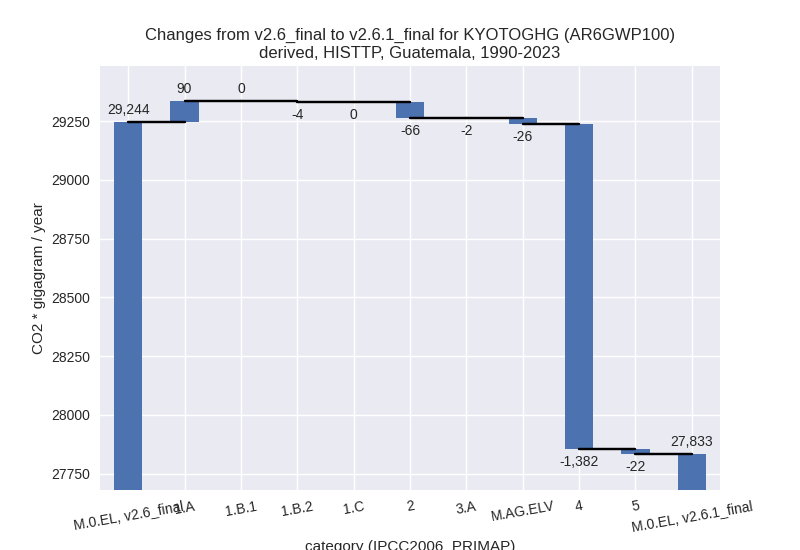
In the third party priority scenario the following sector-gas combinations have the highest absolute impact on national total KyotoGHG (AR6GWP100) emissions in 1990-2023 (top 5):
- 1: 4, CH4 with -1381.75 Gg CO2 / year (-23.5%)
- 2: 1.A, N2O with 83.99 Gg CO2 / year (23.8%)
- 3: 2, CO2 with -65.43 Gg CO2 / year (-6.4%)
- 4: 5, N2O with -21.82 Gg CO2 / year (-8.1%)
- 5: M.AG.ELV, N2O with -14.22 Gg CO2 / year (-0.5%)
Notes on data changes
Here we list notes explaining important emissions changes for the country.
- No new country reported data has been included. Changes in the CR time-series are small and come from updated third party data (EDGAR, FAO) which is used to extrapolate the country reported data.
- Changes in the TP time-series come from updated EDGAR and FAO data. FAO has adjusted data for the latest years while EDGAR has updated full time-series with the main change coming from the waste sector.
Changes by sector and gas
For each scenario and time frame the changes are displayed for all individual sectors and all individual gases. In the sector plot we use aggregate Kyoto GHGs in AR6GWP100. In the gas plot we usenational total emissions without LULUCF.
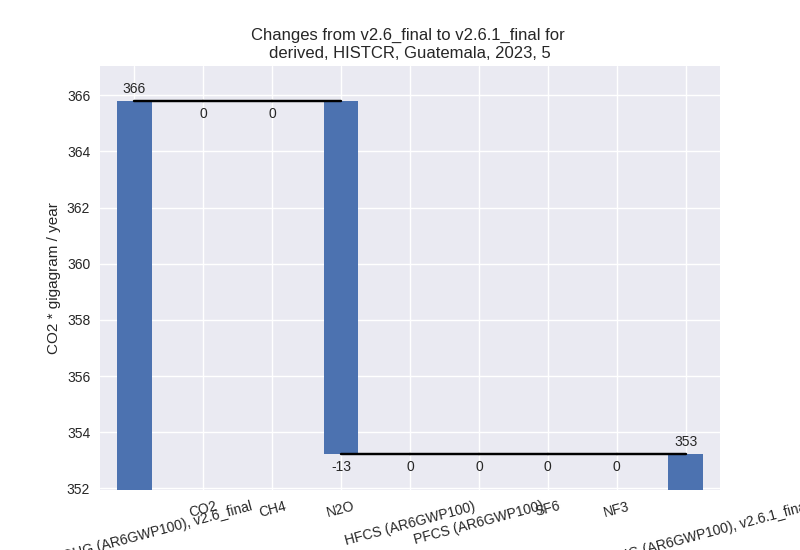
country reported scenario
2023
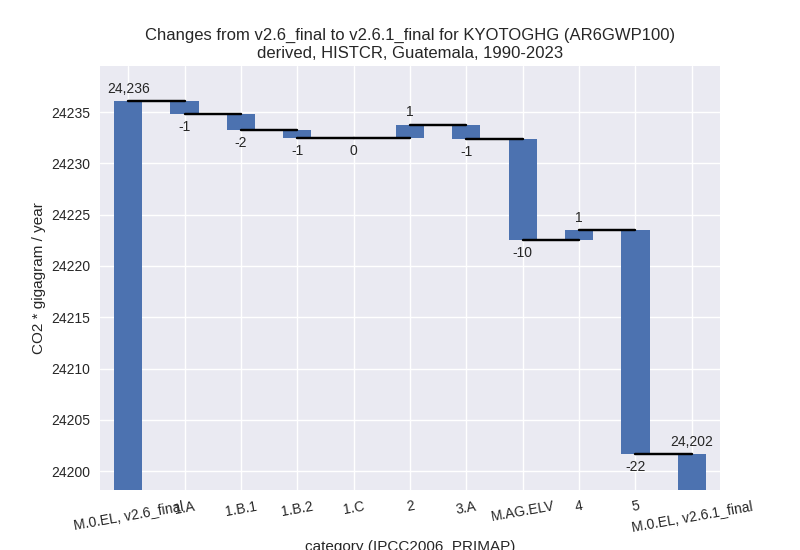
1990-2023
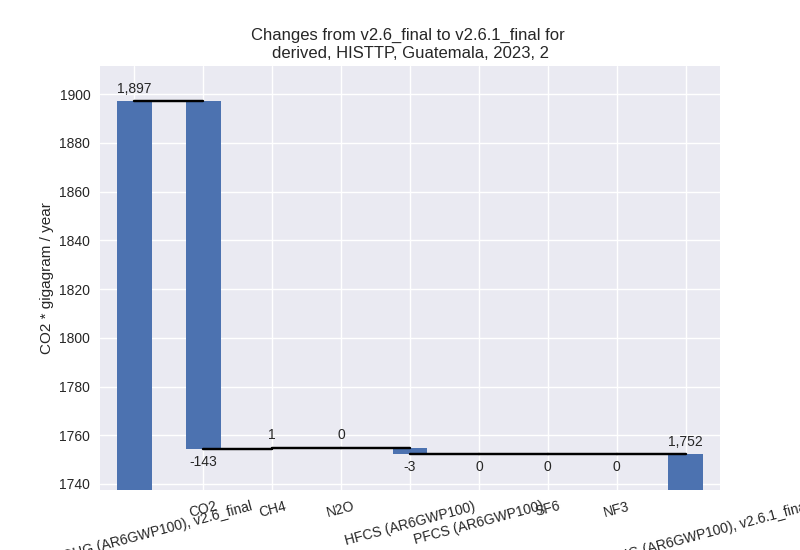
third party scenario
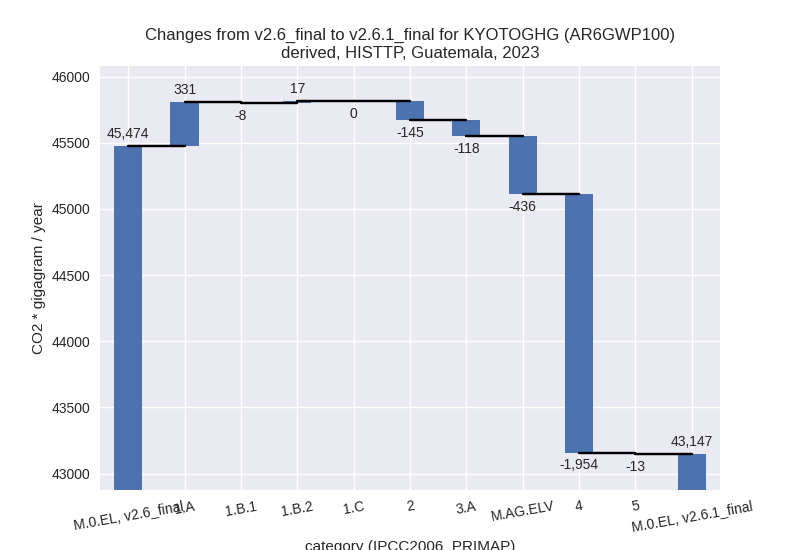
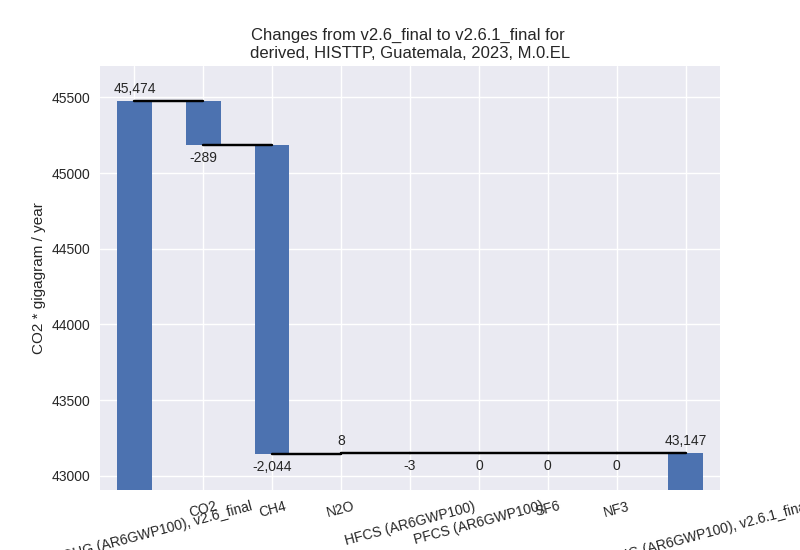
2023
1990-2023
Detailed changes for the scenarios:
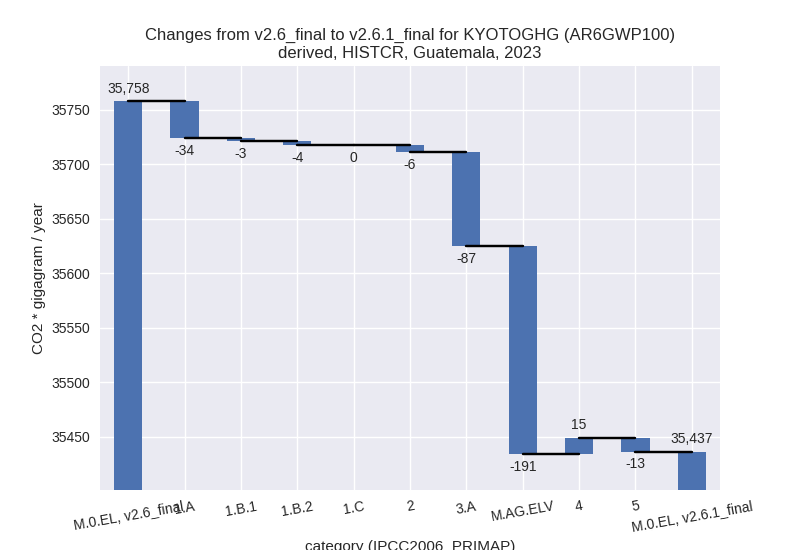
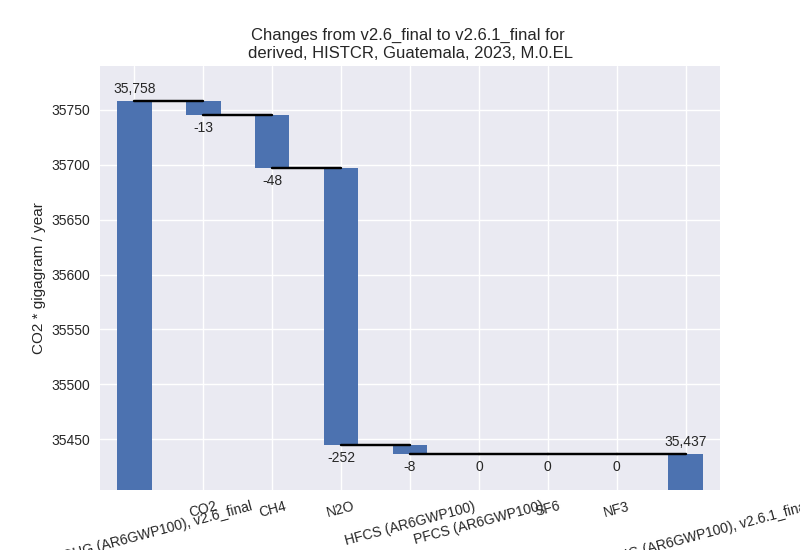
country reported scenario (HISTCR):
Most important changes per time frame
For 2023 the following sector-gas combinations have the highest absolute impact on national total KyotoGHG (AR6GWP100) emissions in 2023 (top 5):
- 1: M.AG.ELV, N2O with -178.20 Gg CO2 / year (-7.6%)
- 2: 3.A, CH4 with -89.57 Gg CO2 / year (-1.6%)
- 3: 1.A, N2O with -61.12 Gg CO2 / year (-13.4%)
- 4: 1.A, CH4 with 27.12 Gg CO2 / year (1.5%)
- 5: M.AG.ELV, CO2 with -17.01 Gg CO2 / year (-27.2%)
For 1990-2023 the following sector-gas combinations have the highest absolute impact on national total KyotoGHG (AR6GWP100) emissions in 1990-2023 (top 5):
- 1: 5, N2O with -21.82 Gg CO2 / year (-8.1%)
- 2: M.AG.ELV, N2O with -9.14 Gg CO2 / year (-0.3%)
- 3: 1.A, N2O with -5.38 Gg CO2 / year (-2.0%)
- 4: 1.A, CH4 with 4.16 Gg CO2 / year (0.3%)
- 5: 2, CO2 with 2.32 Gg CO2 / year (0.2%)
Changes in the main sectors for aggregate KyotoGHG (AR6GWP100) are
- 1: Total sectoral emissions in 2022 are 21338.20 Gg CO2 / year which is 63.3% of M.0.EL emissions. 2023 Emissions have changed by -0.2% (-40.50 Gg CO2 / year). 1990-2023 Emissions have changed by -0.0% (-3.62 Gg CO2 / year).
- 2: Total sectoral emissions in 2022 are 2400.51 Gg CO2 / year which is 7.1% of M.0.EL emissions. 2023 Emissions have changed by -0.2% (-5.63 Gg CO2 / year). 1990-2023 Emissions have changed by 0.1% (1.34 Gg CO2 / year).
- M.AG: Total sectoral emissions in 2022 are 7874.66
Gg CO2 / year which is 23.4% of M.0.EL emissions. 2023 Emissions have
changed by -3.4% (-277.45 Gg CO2 /
year). 1990-2023 Emissions have changed by -0.2% (-11.26 Gg CO2 / year). For 2023 the
changes per gas
are:
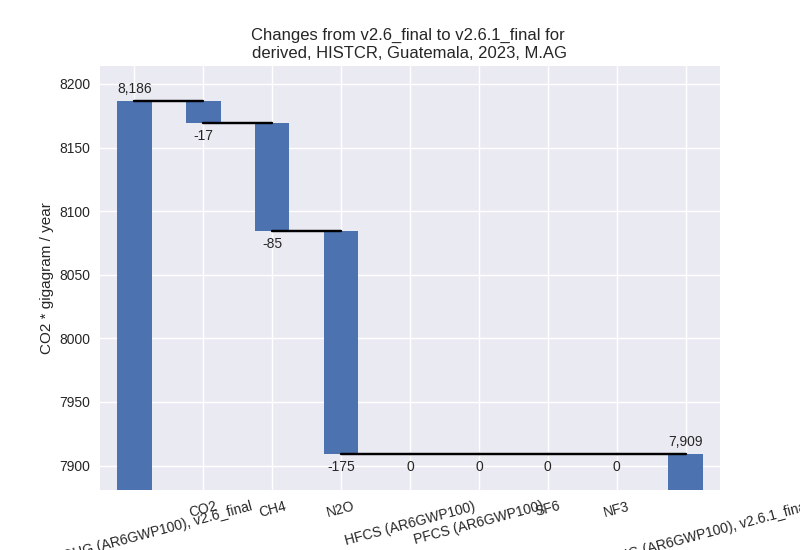
The changes come from the following subsectors:- 3.A: Total sectoral emissions in 2022 are 5538.29 Gg CO2 / year which is 70.3% of category M.AG emissions. 2023 Emissions have changed by -1.5% (-86.81 Gg CO2 / year). 1990-2023 Emissions have changed by -0.0% (-1.39 Gg CO2 / year).
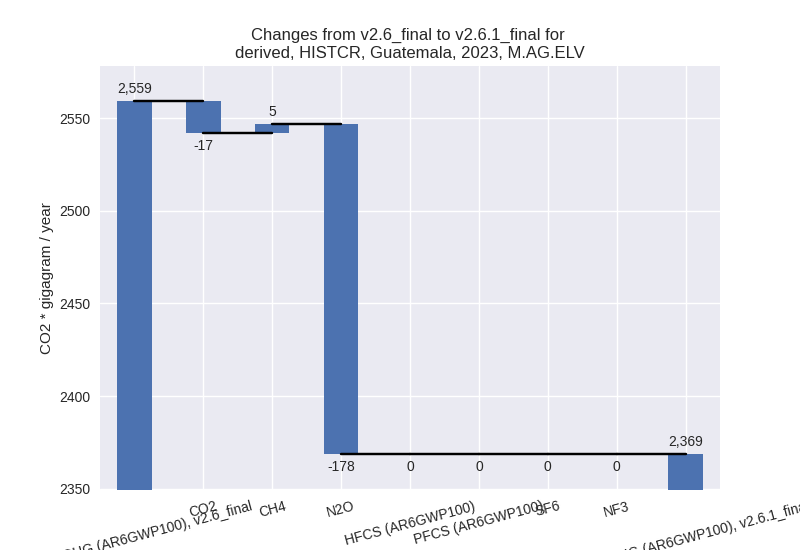
- M.AG.ELV: Total sectoral emissions in 2022 are
2336.38 Gg CO2 / year which is 29.7% of category M.AG emissions. 2023
Emissions have changed by -7.4%
(-190.63 Gg CO2 / year). 1990-2023 Emissions have changed by -0.3% (-9.87 Gg CO2 / year). For 2023 the
changes per gas
are:
There is no subsector information available in PRIMAP-hist.
- 4: Total sectoral emissions in 2022 are 1769.09 Gg CO2 / year which is 5.2% of M.0.EL emissions. 2023 Emissions have changed by 0.8% (15.01 Gg CO2 / year). 1990-2023 Emissions have changed by 0.1% (0.94 Gg CO2 / year).
- 5: Total sectoral emissions in 2022 are 339.99 Gg
CO2 / year which is 1.0% of M.0.EL emissions. 2023 Emissions have
changed by -3.4% (-12.57 Gg CO2 /
year). 1990-2023 Emissions have changed by -8.1% (-21.82 Gg CO2 / year). For 2023 the
changes per gas
are:
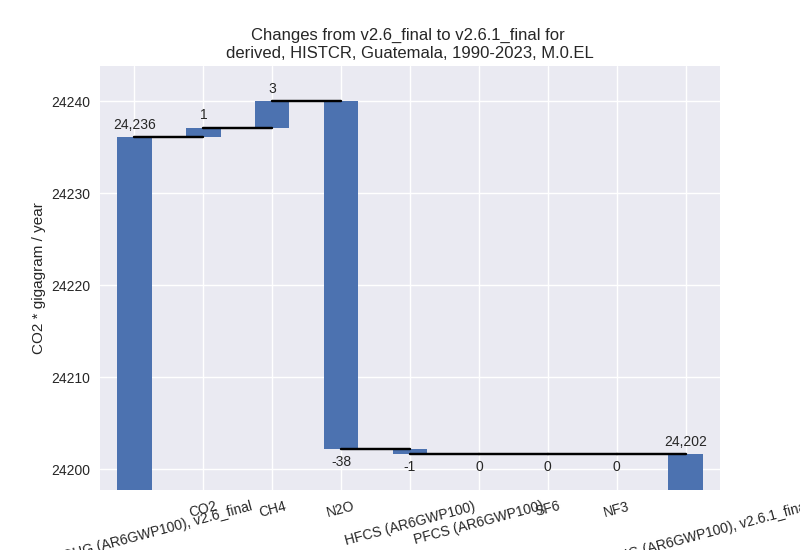
For 1990-2023 the changes per gas are:
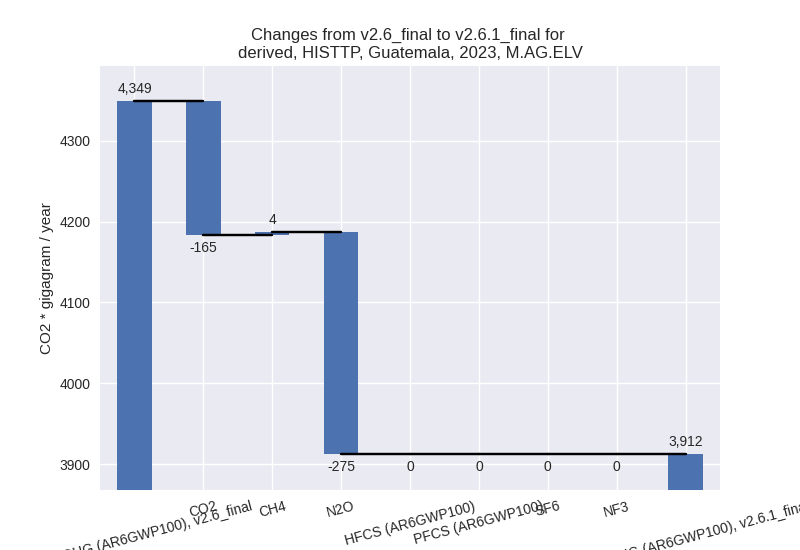
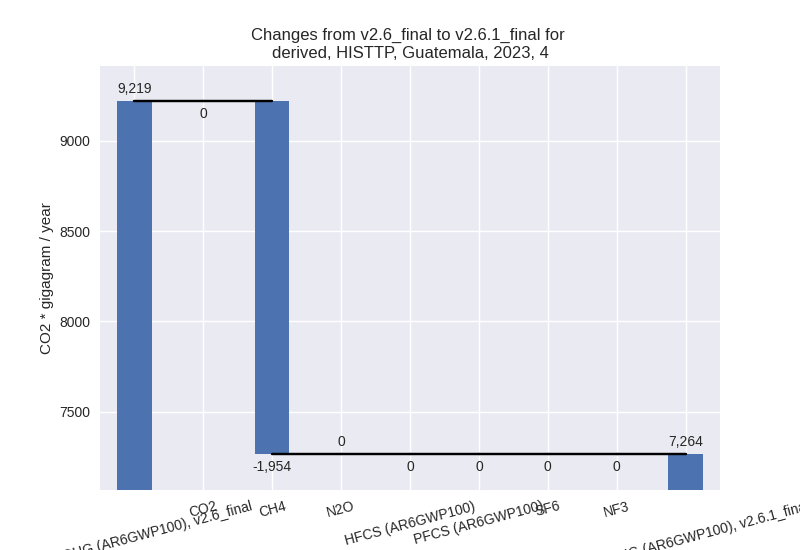
third party scenario (HISTTP):
Most important changes per time frame
For 2023 the following sector-gas combinations have the highest absolute impact on national total KyotoGHG (AR6GWP100) emissions in 2023 (top 5):
- 1: 4, CH4 with -1954.40 Gg CO2 / year (-21.8%)
- 2: 1.A, N2O with 290.47 Gg CO2 / year (53.7%)
- 3: M.AG.ELV, N2O with -274.71 Gg CO2 / year (-7.6%)
- 4: M.AG.ELV, CO2 with -165.35 Gg CO2 / year (-27.2%)
- 5: 2, CO2 with -142.89 Gg CO2 / year (-9.4%)
For 1990-2023 the following sector-gas combinations have the highest absolute impact on national total KyotoGHG (AR6GWP100) emissions in 1990-2023 (top 5):
- 1: 4, CH4 with -1381.75 Gg CO2 / year (-23.5%)
- 2: 1.A, N2O with 83.99 Gg CO2 / year (23.8%)
- 3: 2, CO2 with -65.43 Gg CO2 / year (-6.4%)
- 4: 5, N2O with -21.82 Gg CO2 / year (-8.1%)
- 5: M.AG.ELV, N2O with -14.22 Gg CO2 / year (-0.5%)
Changes in the main sectors for aggregate KyotoGHG (AR6GWP100) are
- 1: Total sectoral emissions in 2022 are 20835.66 Gg CO2 / year which is 50.3% of M.0.EL emissions. 2023 Emissions have changed by 1.5% (338.87 Gg CO2 / year). 1990-2023 Emissions have changed by 0.7% (85.76 Gg CO2 / year).
- 2: Total sectoral emissions in 2022 are 1722.66 Gg
CO2 / year which is 4.2% of M.0.EL emissions. 2023 Emissions have
changed by -7.6% (-144.84 Gg CO2 /
year). 1990-2023 Emissions have changed by -5.7% (-65.52 Gg CO2 / year). For 2023 the
changes per gas
are:
For 1990-2023 the changes per gas are: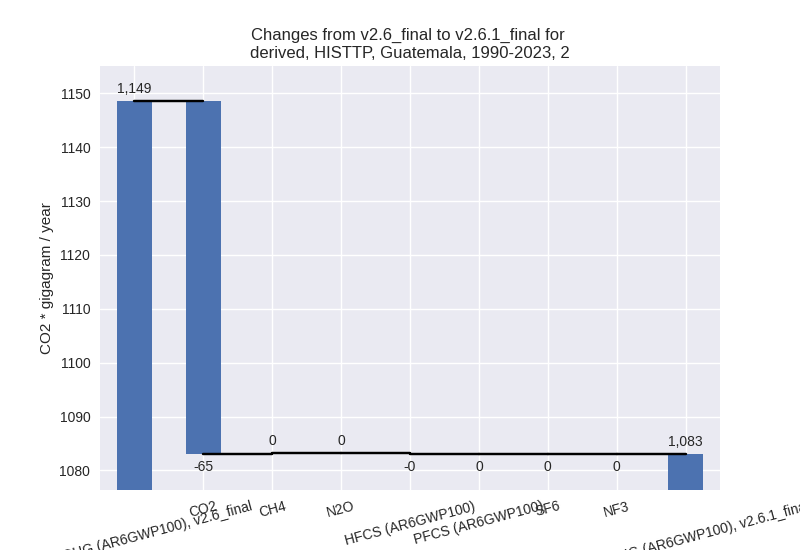
- M.AG: Total sectoral emissions in 2022 are 11471.57
Gg CO2 / year which is 27.7% of M.0.EL emissions. 2023 Emissions have
changed by -4.6% (-554.75 Gg CO2 /
year). 1990-2023 Emissions have changed by -0.3% (-28.04 Gg CO2 / year). For 2023 the
changes per gas
are:
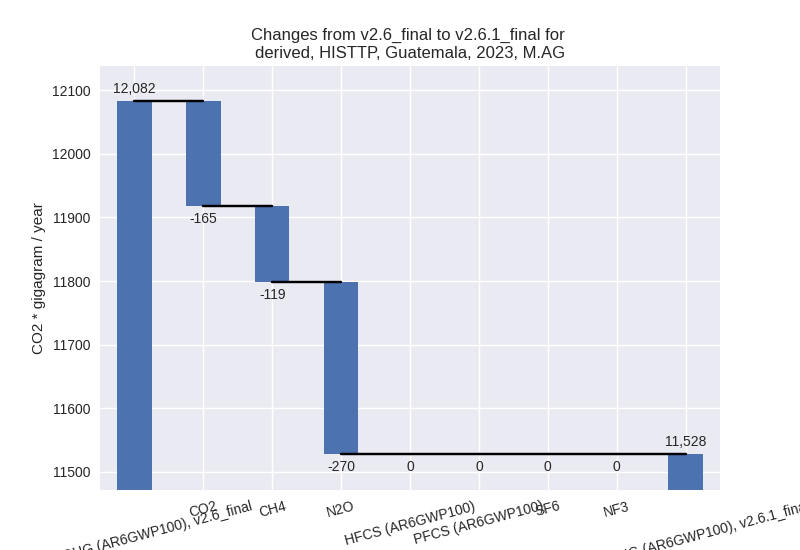
The changes come from the following subsectors:- 3.A: Total sectoral emissions in 2022 are 7612.49 Gg CO2 / year which is 66.4% of category M.AG emissions. 2023 Emissions have changed by -1.5% (-118.33 Gg CO2 / year). 1990-2023 Emissions have changed by -0.0% (-1.84 Gg CO2 / year).
- M.AG.ELV: Total sectoral emissions in 2022 are
3859.08 Gg CO2 / year which is 33.6% of category M.AG emissions. 2023
Emissions have changed by -10.0%
(-436.43 Gg CO2 / year). 1990-2023 Emissions have changed by -0.8% (-26.19 Gg CO2 / year). For 2023 the
changes per gas
are:
There is no subsector information available in PRIMAP-hist.
- 4: Total sectoral emissions in 2022 are 7090.45 Gg
CO2 / year which is 17.1% of M.0.EL emissions. 2023 Emissions have
changed by -21.2% (-1954.19 Gg CO2 /
year). 1990-2023 Emissions have changed by -22.9% (-1381.69 Gg CO2 / year). For 2023
the changes per gas
are:
For 1990-2023 the changes per gas are:
- 5: Total sectoral emissions in 2022 are 339.99 Gg
CO2 / year which is 0.8% of M.0.EL emissions. 2023 Emissions have
changed by -3.4% (-12.57 Gg CO2 /
year). 1990-2023 Emissions have changed by -8.1% (-21.82 Gg CO2 / year). For 2023 the
changes per gas
are:

For 1990-2023 the changes per gas are: