Changes in PRIMAP-hist v2.6.1_final compared to v2.6_final for Hong Kong
2025-03-19
Johannes Gütschow
Change analysis for Hong Kong for PRIMAP-hist v2.6.1_final compared to v2.6_final
Overview over emissions by sector and gas
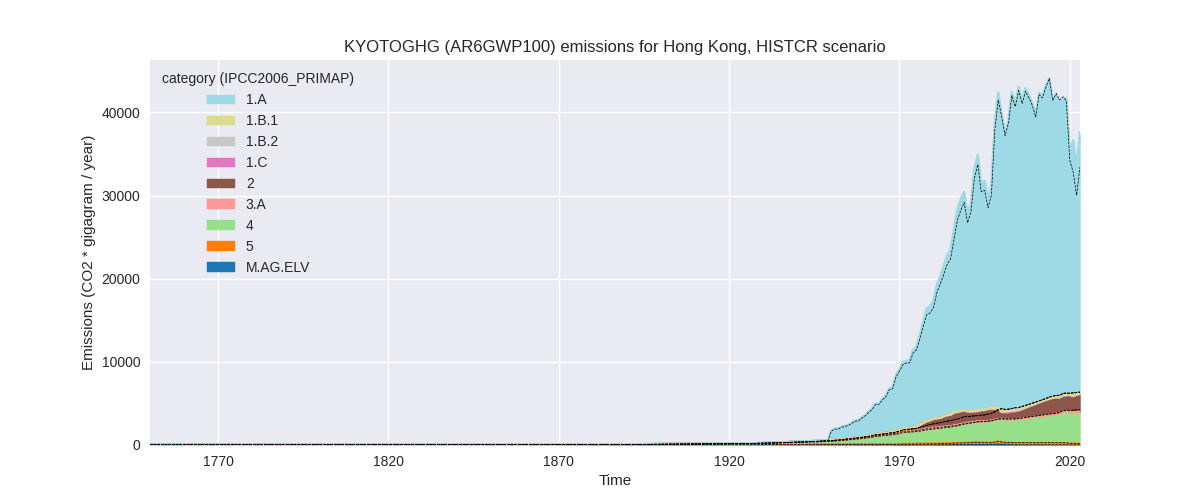
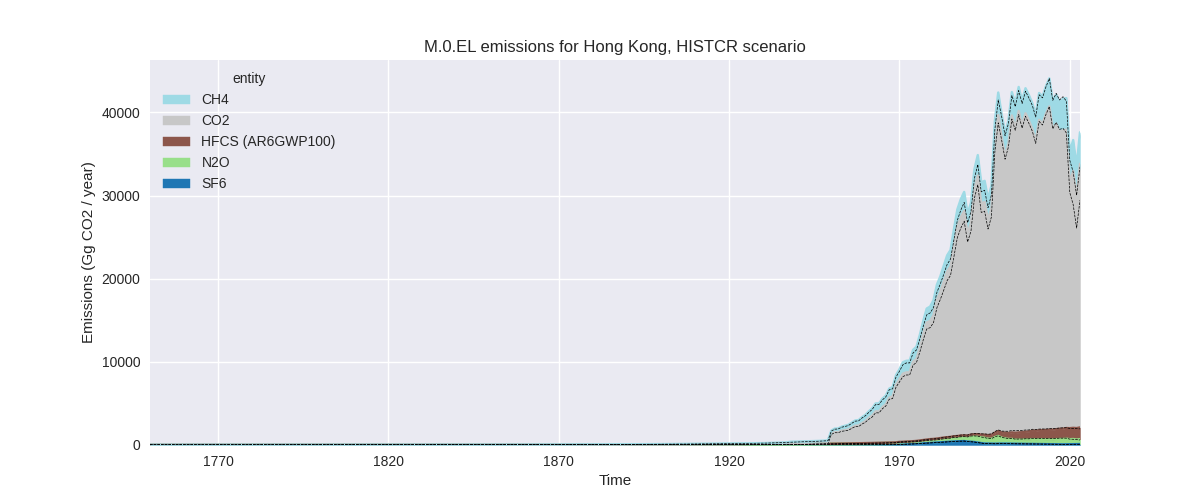
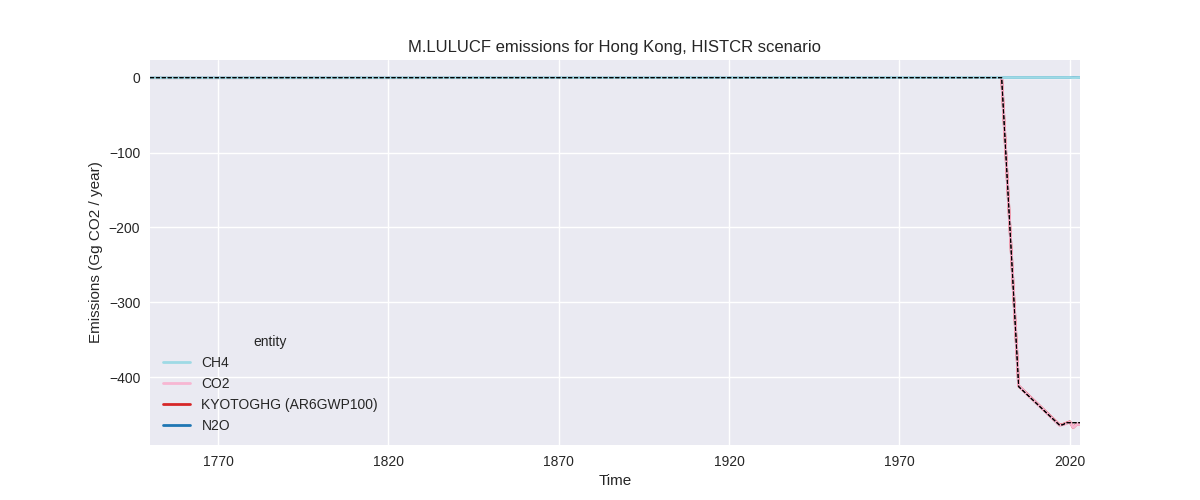
The following figures show the aggregate national total emissions excluding LULUCF AR6GWP100 for the country reported priority scenario. The dotted linesshow the v2.6_final data.
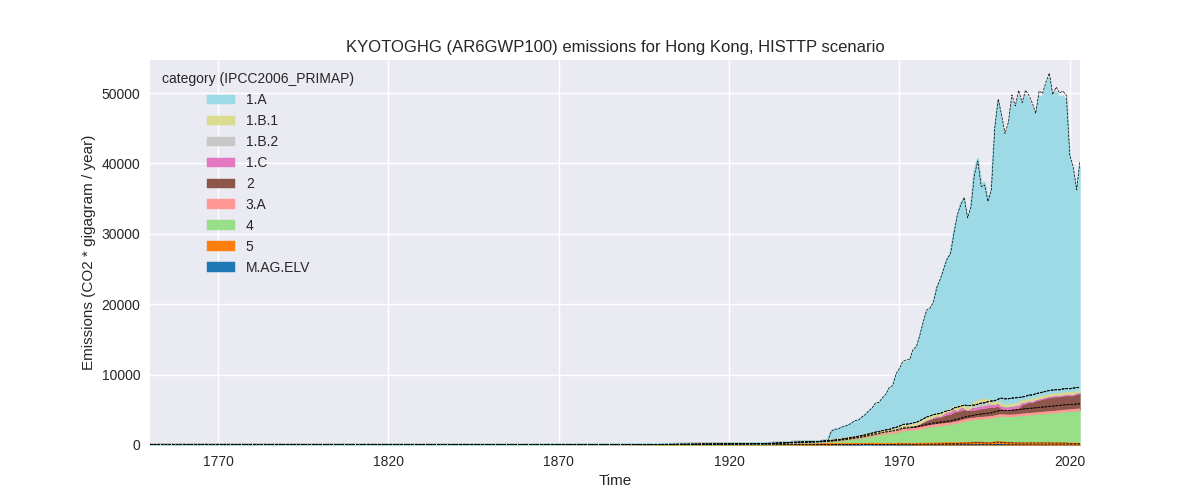
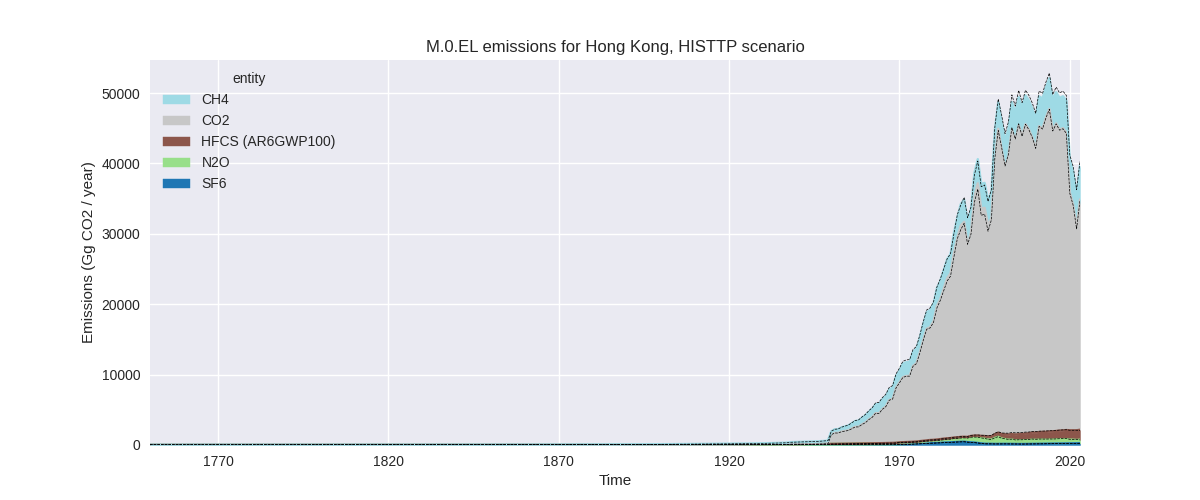
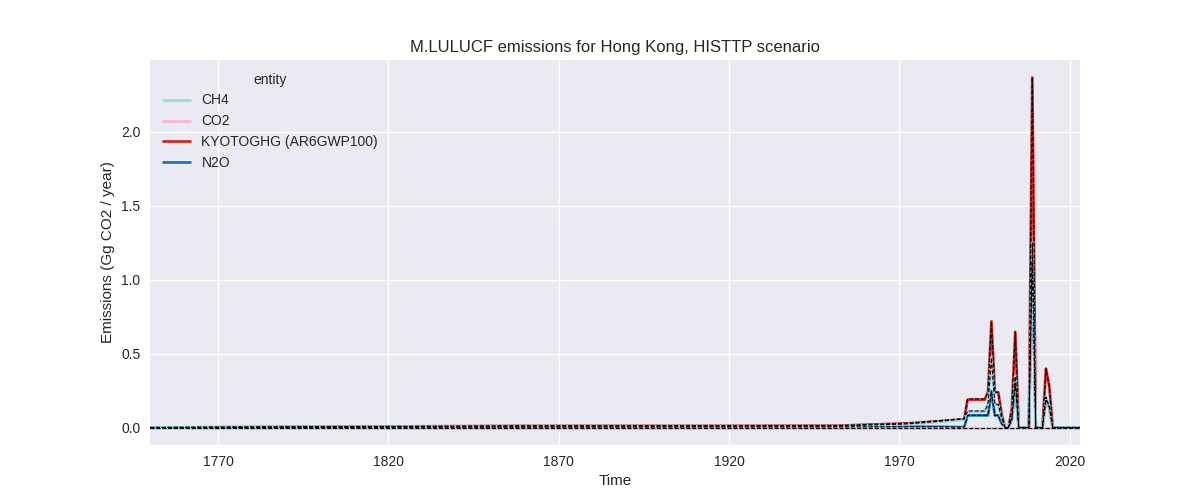
The following figures show the aggregate national total emissions excluding LULUCF AR6GWP100 for the third party priority scenario. The dotted linesshow the v2.6_final data.
Overview over changes
In the country reported priority scenario we have the following changes for aggregate Kyoto GHG and national total emissions excluding LULUCF (M.0.EL):
- Emissions in 2023 have changed by 12.4%% (4163.63 Gg CO2 / year)
- Emissions in 1990-2023 have changed by 2.1%% (794.55 Gg CO2 / year)
In the third party priority scenario we have the following changes for aggregate Kyoto GHG and national total emissions excluding LULUCF (M.0.EL):
- Emissions in 2023 have changed by -1.7%% (-676.53 Gg CO2 / year)
- Emissions in 1990-2023 have changed by -1.3%% (-586.97 Gg CO2 / year)
Most important changes per scenario and time frame
In the country reported priority scenario the following sector-gas combinations have the highest absolute impact on national total KyotoGHG (AR6GWP100) emissions in 2023 (top 5):
- 1: 1.A, CO2 with 4261.94 Gg CO2 / year (15.9%)
- 2: 4, CH4 with -206.04 Gg CO2 / year (-5.3%)
- 3: 1.A, N2O with 89.93 Gg CO2 / year (51.1%)
- 4: 2, HFCS (AR6GWP100) with 78.08 Gg CO2 / year (5.8%)
- 5: 2, CO2 with -74.84 Gg CO2 / year (-11.2%)
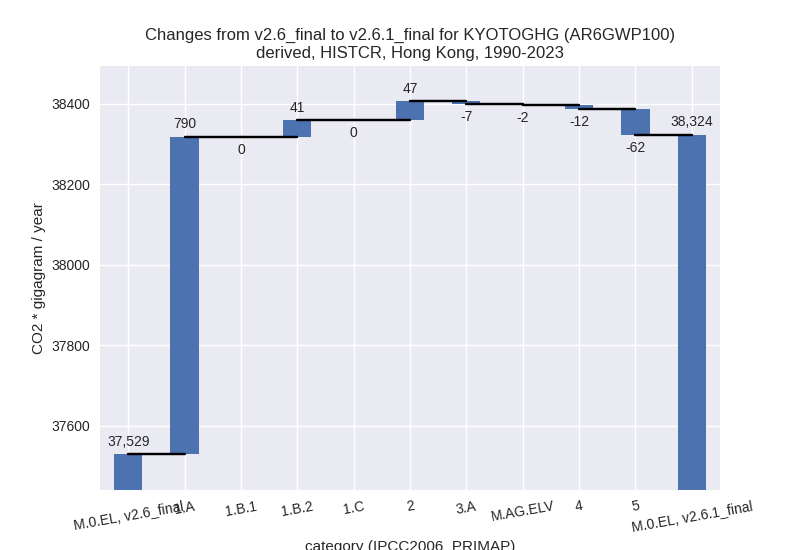
In the country reported priority scenario the following sector-gas combinations have the highest absolute impact on national total KyotoGHG (AR6GWP100) emissions in 1990-2023 (top 5):
- 1: 1.A, CO2 with 824.53 Gg CO2 / year (2.5%)
- 2: 2, CO2 with 105.92 Gg CO2 / year (29.5%)
- 3: 5, N2O with -62.35 Gg CO2 / year (-23.2%)
- 4: 2, HFCS (AR6GWP100) with -58.76 Gg CO2 / year (-6.4%)
- 5: 1.A, CH4 with -41.83 Gg CO2 / year (-54.9%)
In the third party priority scenario the following sector-gas combinations have the highest absolute impact on national total KyotoGHG (AR6GWP100) emissions in 2023 (top 5):
- 1: 4, CH4 with -841.99 Gg CO2 / year (-15.4%)
- 2: 2, HFCS (AR6GWP100) with 78.08 Gg CO2 / year (5.8%)
- 3: 1.B.2, CO2 with 74.03 Gg CO2 / year (inf%)
- 4: 5, N2O with -22.56 Gg CO2 / year (-15.4%)
- 5: 1.A, N2O with 21.64 Gg CO2 / year (15.0%)
In the third party priority scenario the following sector-gas combinations have the highest absolute impact on national total KyotoGHG (AR6GWP100) emissions in 1990-2023 (top 5):
- 1: 4, CH4 with -723.92 Gg CO2 / year (-15.6%)
- 2: 1.B.2, CO2 with 343.06 Gg CO2 / year (inf%)
- 3: 2, CO2 with -87.25 Gg CO2 / year (-11.9%)
- 4: 5, N2O with -62.35 Gg CO2 / year (-23.2%)
- 5: 2, HFCS (AR6GWP100) with -58.76 Gg CO2 / year (-6.4%)
Notes on data changes
Here we list notes explaining important emissions changes for the country.
- CRT data from BTR1 covering 2005, 2020, 2021 has been added. It
replaces BUR3 data for 2005 and extends BUR3 for 2020-2021. Other
country reported sources used are BUR3 for 2018 and NC4 for 2017.
- The main change in the CR scenario is that energy CO2 emissions are higher after 2020 because of the CRT data. Waste CH4 and cement CO2 are lower for the latest years (also from new CRT data)
- For the TP scenario lower waste CHY4 emissions in EDGAR are the main
source of change.
- CO2 in 1.B.2 has been added to EDGAR data. This mostly affects cumulative emissions as 2023 emissions in the sector are low.
Changes by sector and gas
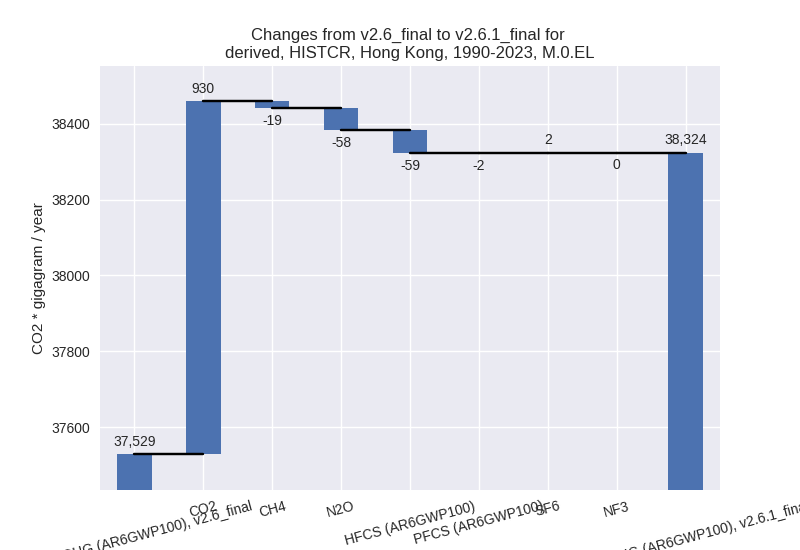
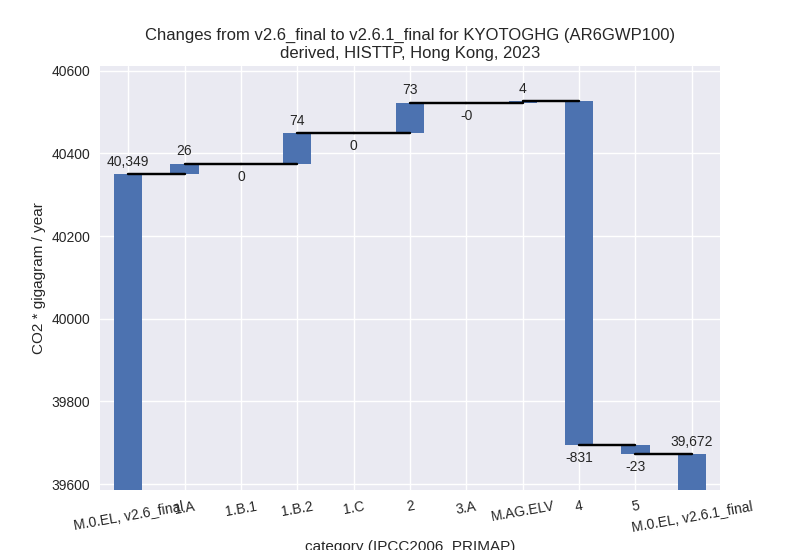
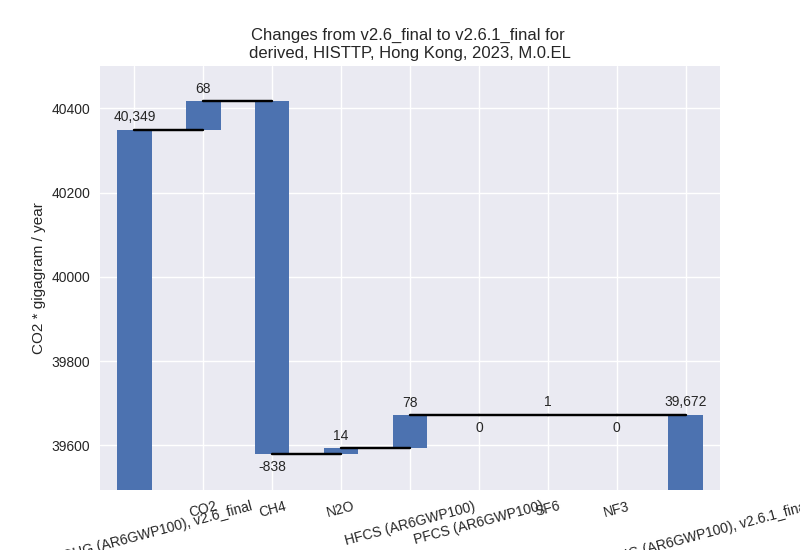
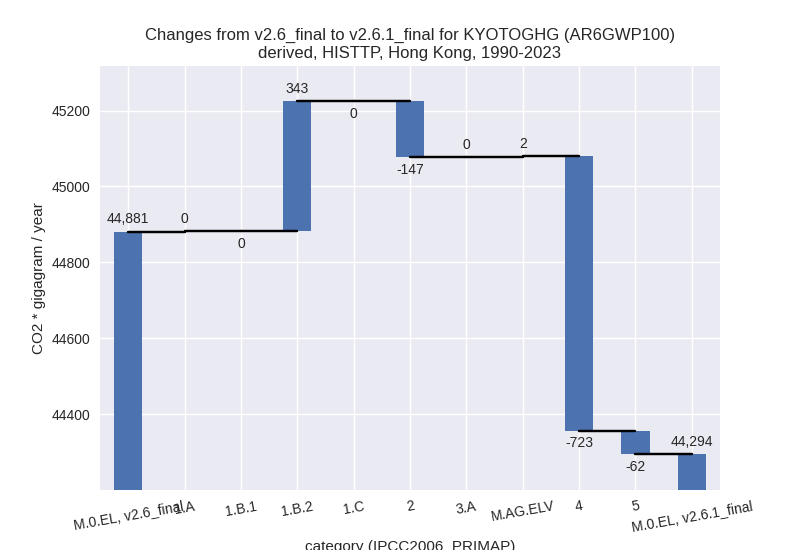
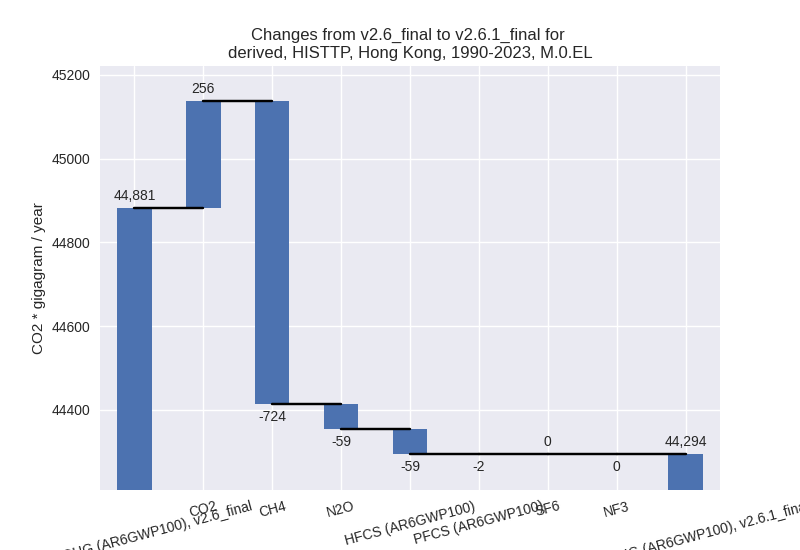
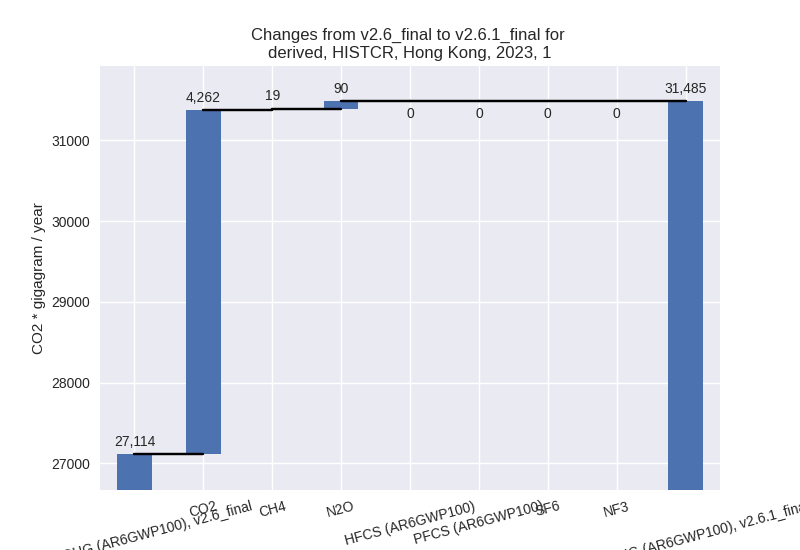
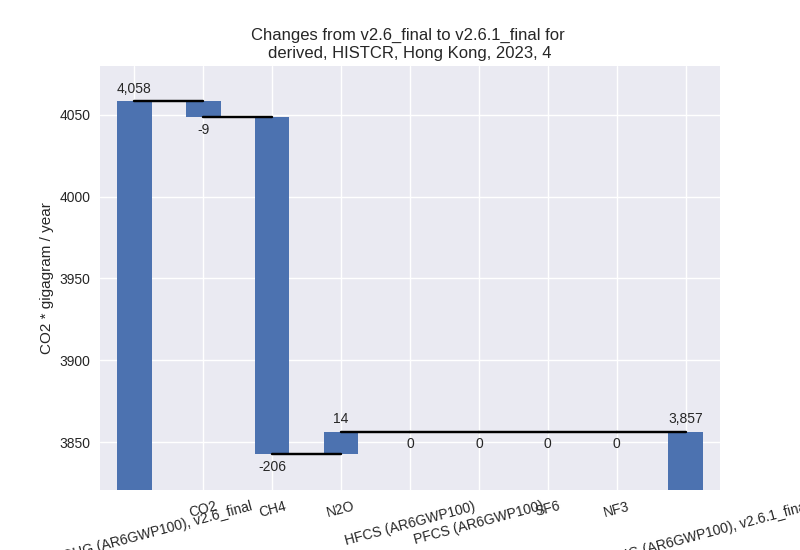
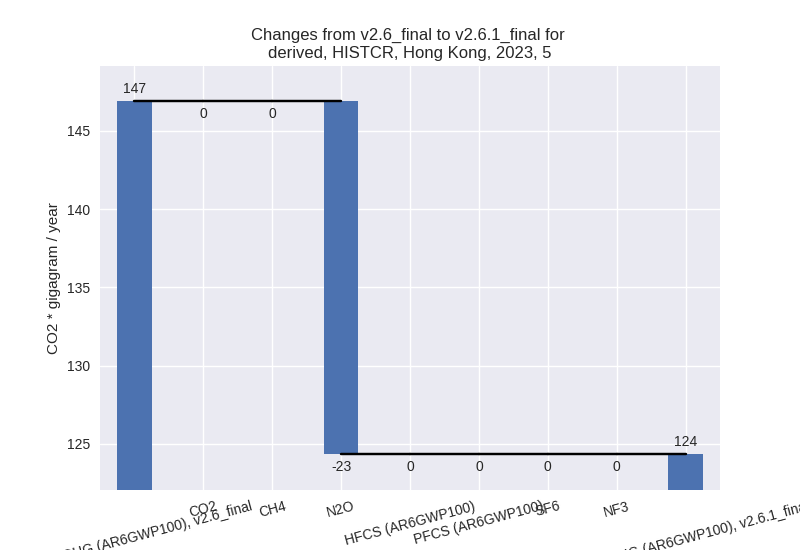
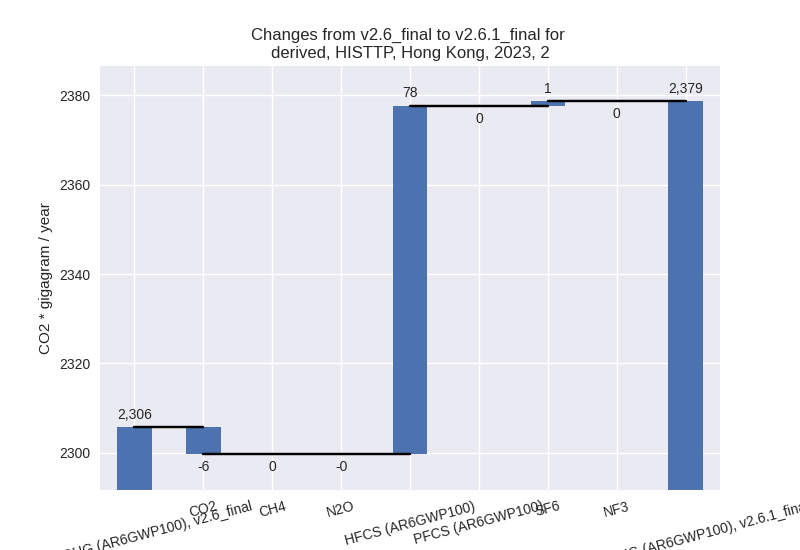
For each scenario and time frame the changes are displayed for all individual sectors and all individual gases. In the sector plot we use aggregate Kyoto GHGs in AR6GWP100. In the gas plot we usenational total emissions without LULUCF.
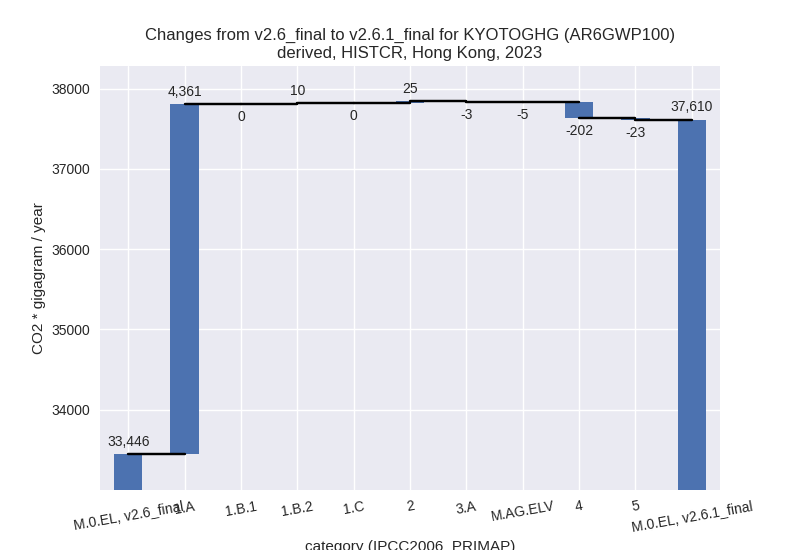
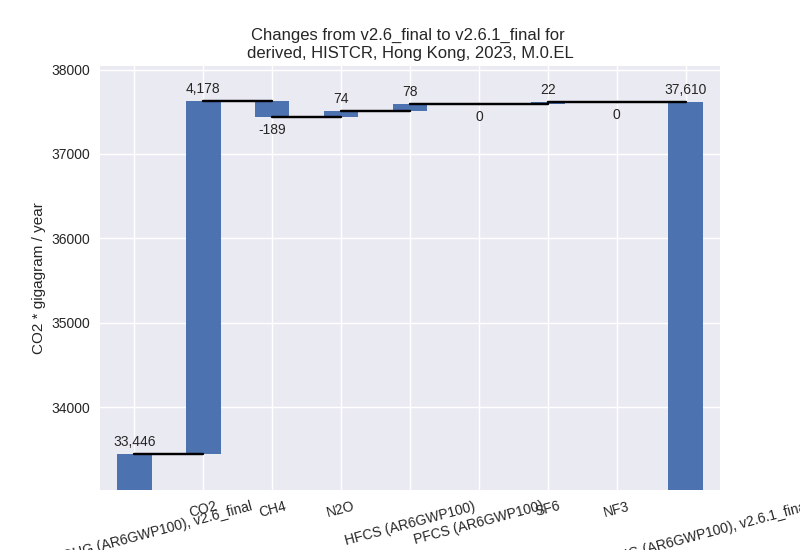
country reported scenario
2023
1990-2023
third party scenario
2023
1990-2023
Detailed changes for the scenarios:
country reported scenario (HISTCR):
Most important changes per time frame
For 2023 the following sector-gas combinations have the highest absolute impact on national total KyotoGHG (AR6GWP100) emissions in 2023 (top 5):
- 1: 1.A, CO2 with 4261.94 Gg CO2 / year (15.9%)
- 2: 4, CH4 with -206.04 Gg CO2 / year (-5.3%)
- 3: 1.A, N2O with 89.93 Gg CO2 / year (51.1%)
- 4: 2, HFCS (AR6GWP100) with 78.08 Gg CO2 / year (5.8%)
- 5: 2, CO2 with -74.84 Gg CO2 / year (-11.2%)
For 1990-2023 the following sector-gas combinations have the highest absolute impact on national total KyotoGHG (AR6GWP100) emissions in 1990-2023 (top 5):
- 1: 1.A, CO2 with 824.53 Gg CO2 / year (2.5%)
- 2: 2, CO2 with 105.92 Gg CO2 / year (29.5%)
- 3: 5, N2O with -62.35 Gg CO2 / year (-23.2%)
- 4: 2, HFCS (AR6GWP100) with -58.76 Gg CO2 / year (-6.4%)
- 5: 1.A, CH4 with -41.83 Gg CO2 / year (-54.9%)
Changes in the main sectors for aggregate KyotoGHG (AR6GWP100) are
- 1: Total sectoral emissions in 2022 are 27493.53 Gg
CO2 / year which is 82.0% of M.0.EL emissions. 2023 Emissions have
changed by 16.1% (4371.02 Gg CO2 /
year). 1990-2023 Emissions have changed by 2.5% (830.12 Gg CO2 / year). For 2023 the
changes per gas
are:
For 1990-2023 the changes per gas are: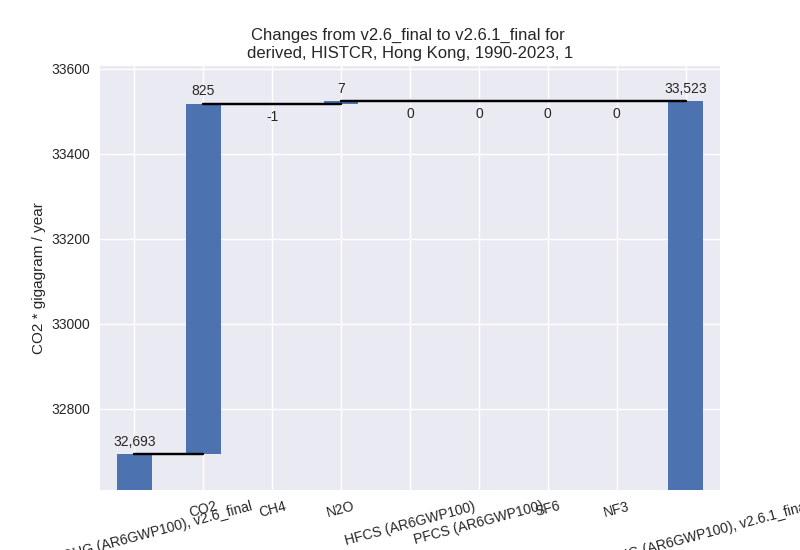
The changes come from the following subsectors:- 1.A: Total sectoral emissions in 2022 are 27444.17
Gg CO2 / year which is 99.8% of category 1 emissions. 2023 Emissions
have changed by 16.1% (4360.58 Gg
CO2 / year). 1990-2023 Emissions have changed by 2.4% (789.59 Gg CO2 / year). For 2023 the
changes per gas
are:
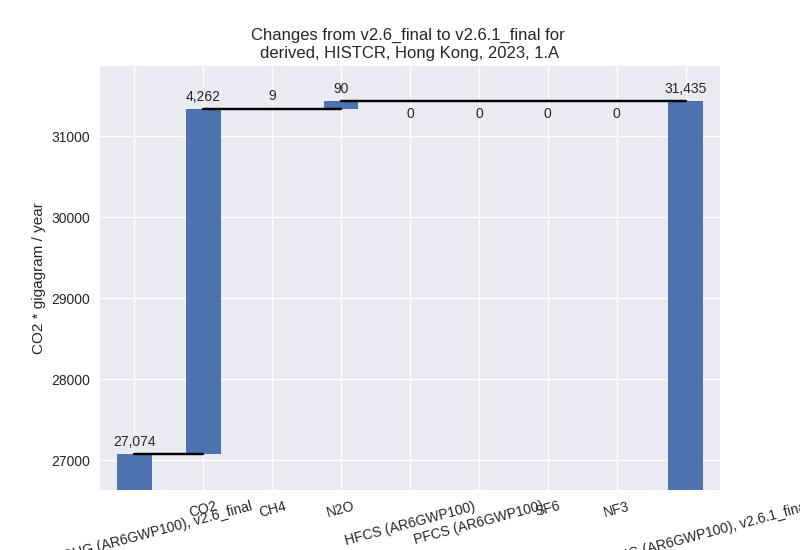
For 1990-2023 the changes per gas are: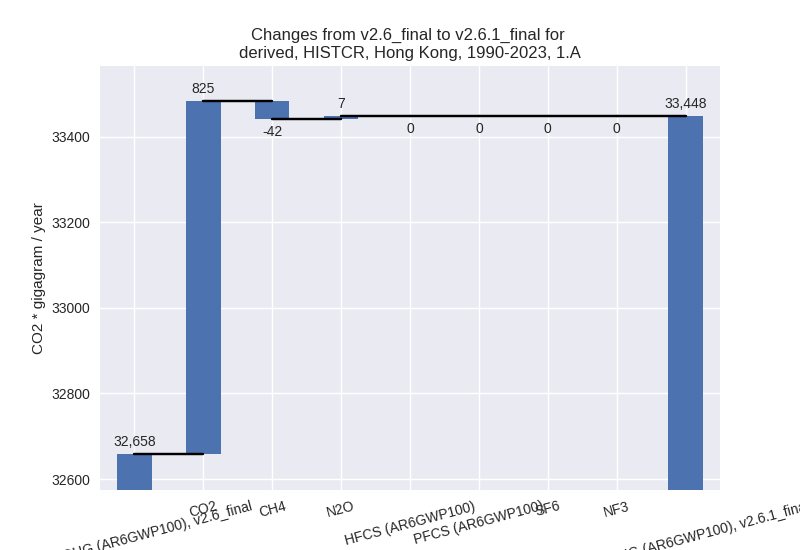
There is no subsector information available in PRIMAP-hist. - 1.B.2: Total sectoral emissions in 2022 are 49.36
Gg CO2 / year which is 0.2% of category 1 emissions. 2023 Emissions have
changed by 26.3% (10.43 Gg CO2 /
year). 1990-2023 Emissions have changed by 114.8% (40.53 Gg CO2 / year). For 2023 the
changes per gas
are:

For 1990-2023 the changes per gas are: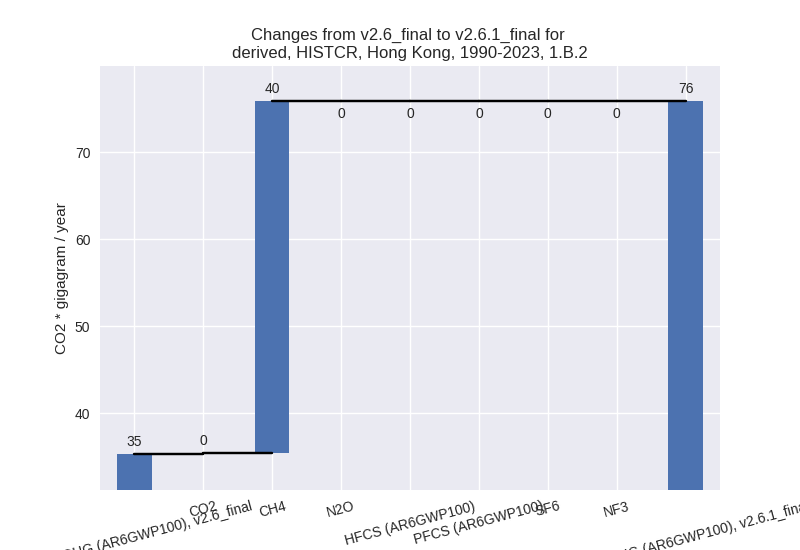
There is no subsector information available in PRIMAP-hist.
- 1.A: Total sectoral emissions in 2022 are 27444.17
Gg CO2 / year which is 99.8% of category 1 emissions. 2023 Emissions
have changed by 16.1% (4360.58 Gg
CO2 / year). 1990-2023 Emissions have changed by 2.4% (789.59 Gg CO2 / year). For 2023 the
changes per gas
are:
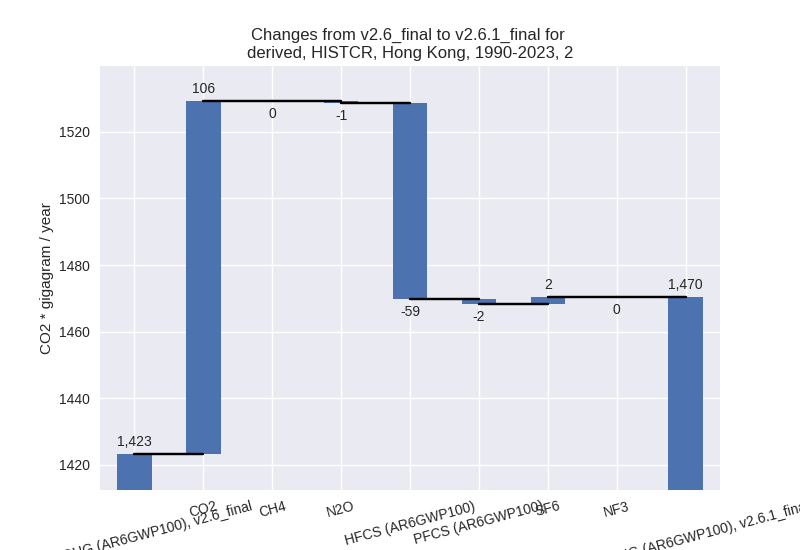
- 2: Total sectoral emissions in 2022 are 2077.94 Gg
CO2 / year which is 6.2% of M.0.EL emissions. 2023 Emissions have
changed by 1.2% (25.04 Gg CO2 /
year). 1990-2023 Emissions have changed by 3.3% (47.15 Gg CO2 / year). For 1990-2023
the changes per gas
are:
- M.AG: Total sectoral emissions in 2022 are 30.63 Gg
CO2 / year which is 0.1% of M.0.EL emissions. 2023 Emissions have
changed by -21.1% (-8.21 Gg CO2 /
year). 1990-2023 Emissions have changed by -15.5% (-8.61 Gg CO2 / year). For 2023 the
changes per gas
are:
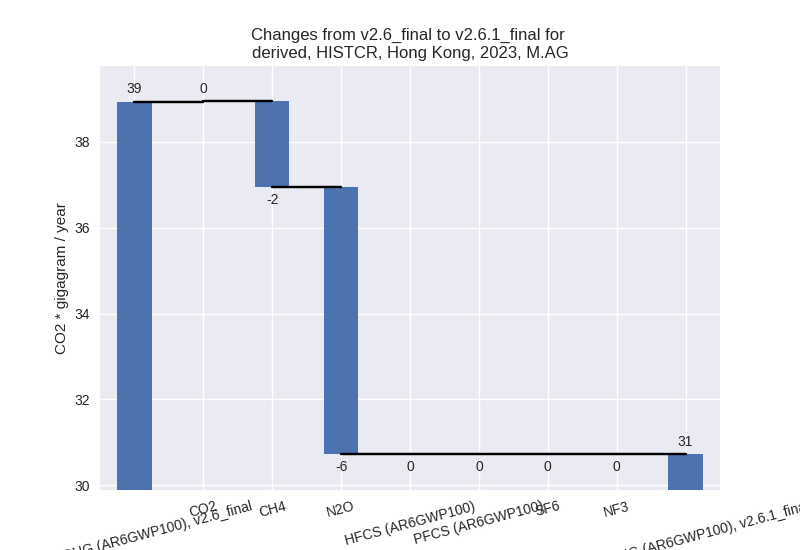
For 1990-2023 the changes per gas are: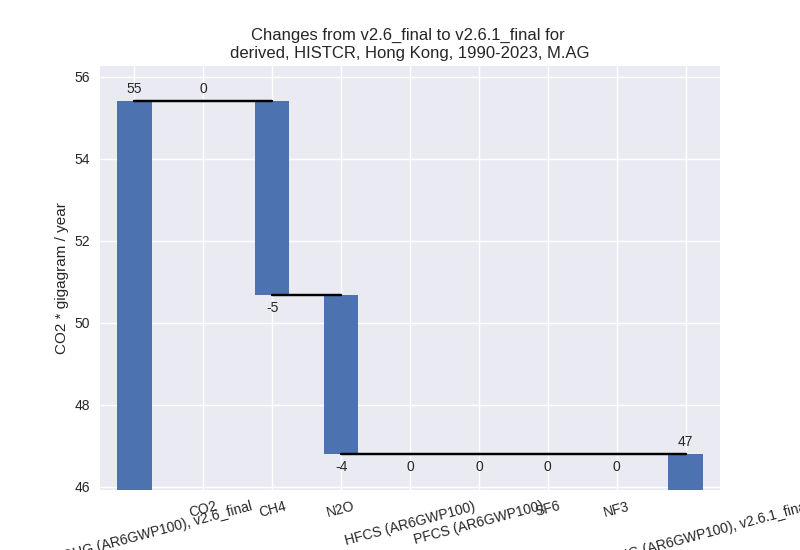
The changes come from the following subsectors:- 3.A: Total sectoral emissions in 2022 are 19.51 Gg
CO2 / year which is 63.7% of category M.AG emissions. 2023 Emissions
have changed by -15.1% (-3.48 Gg CO2
/ year). 1990-2023 Emissions have changed by -17.9% (-6.86 Gg CO2 / year). For 2023 the
changes per gas
are:
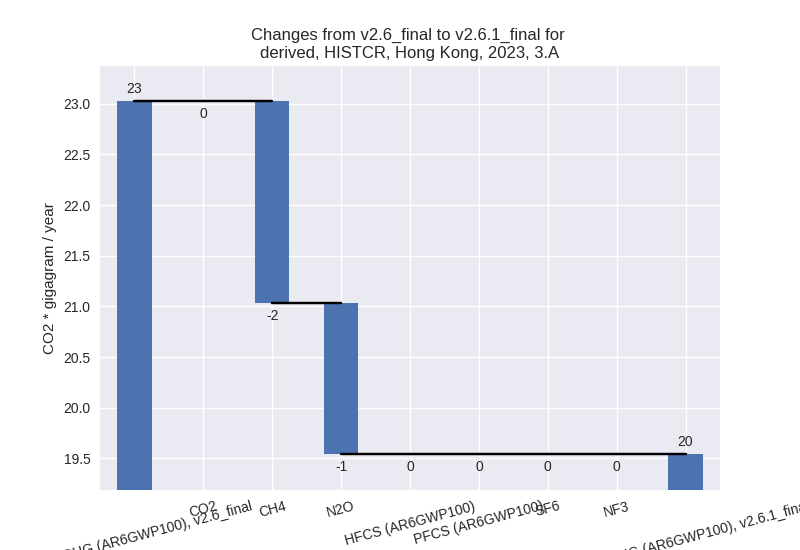
For 1990-2023 the changes per gas are: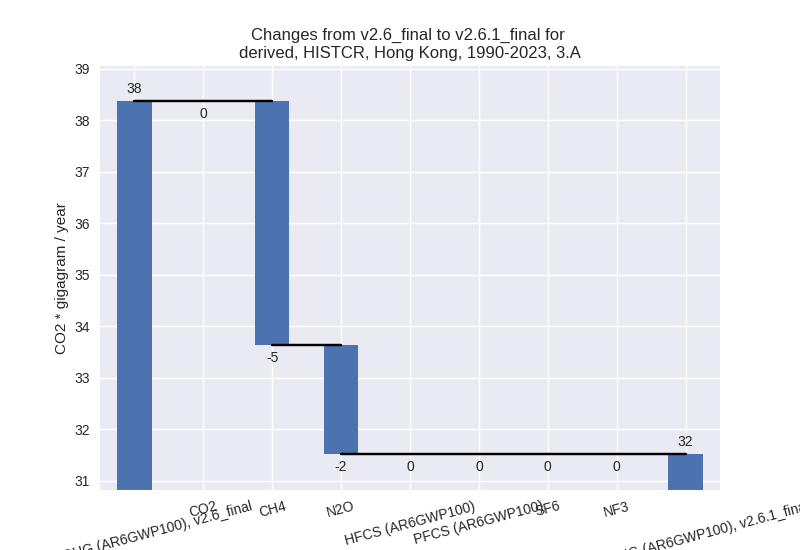
There is no subsector information available in PRIMAP-hist. - M.AG.ELV: Total sectoral emissions in 2022 are
11.12 Gg CO2 / year which is 36.3% of category M.AG emissions. 2023
Emissions have changed by -29.7%
(-4.73 Gg CO2 / year). 1990-2023 Emissions have changed by -10.3% (-1.75 Gg CO2 / year). For 2023 the
changes per gas
are:

For 1990-2023 the changes per gas are:
There is no subsector information available in PRIMAP-hist.
- 3.A: Total sectoral emissions in 2022 are 19.51 Gg
CO2 / year which is 63.7% of category M.AG emissions. 2023 Emissions
have changed by -15.1% (-3.48 Gg CO2
/ year). 1990-2023 Emissions have changed by -17.9% (-6.86 Gg CO2 / year). For 2023 the
changes per gas
are:
- 4: Total sectoral emissions in 2022 are 3815.81 Gg
CO2 / year which is 11.4% of M.0.EL emissions. 2023 Emissions have
changed by -5.0% (-201.64 Gg CO2 /
year). 1990-2023 Emissions have changed by -0.4% (-11.77 Gg CO2 / year). For 2023 the
changes per gas
are:
- 5: Total sectoral emissions in 2022 are 110.93 Gg
CO2 / year which is 0.3% of M.0.EL emissions. 2023 Emissions have
changed by -15.4% (-22.56 Gg CO2 /
year). 1990-2023 Emissions have changed by -23.2% (-62.35 Gg CO2 / year). For 2023
the changes per gas
are:
For 1990-2023 the changes per gas are:
third party scenario (HISTTP):
Most important changes per time frame
For 2023 the following sector-gas combinations have the highest absolute impact on national total KyotoGHG (AR6GWP100) emissions in 2023 (top 5):
- 1: 4, CH4 with -841.99 Gg CO2 / year (-15.4%)
- 2: 2, HFCS (AR6GWP100) with 78.08 Gg CO2 / year (5.8%)
- 3: 1.B.2, CO2 with 74.03 Gg CO2 / year (inf%)
- 4: 5, N2O with -22.56 Gg CO2 / year (-15.4%)
- 5: 1.A, N2O with 21.64 Gg CO2 / year (15.0%)
For 1990-2023 the following sector-gas combinations have the highest absolute impact on national total KyotoGHG (AR6GWP100) emissions in 1990-2023 (top 5):
- 1: 4, CH4 with -723.92 Gg CO2 / year (-15.6%)
- 2: 1.B.2, CO2 with 343.06 Gg CO2 / year (inf%)
- 3: 2, CO2 with -87.25 Gg CO2 / year (-11.9%)
- 4: 5, N2O with -62.35 Gg CO2 / year (-23.2%)
- 5: 2, HFCS (AR6GWP100) with -58.76 Gg CO2 / year (-6.4%)
Changes in the main sectors for aggregate KyotoGHG (AR6GWP100) are
- 1: Total sectoral emissions in 2022 are 28272.40 Gg CO2 / year which is 79.5% of M.0.EL emissions. 2023 Emissions have changed by 0.3% (100.15 Gg CO2 / year). 1990-2023 Emissions have changed by 0.9% (343.36 Gg CO2 / year).
- 2: Total sectoral emissions in 2022 are 2336.37 Gg
CO2 / year which is 6.6% of M.0.EL emissions. 2023 Emissions have
changed by 3.2% (73.01 Gg CO2 /
year). 1990-2023 Emissions have changed by -8.0% (-147.46 Gg CO2 / year). For 2023
the changes per gas
are:
For 1990-2023 the changes per gas are: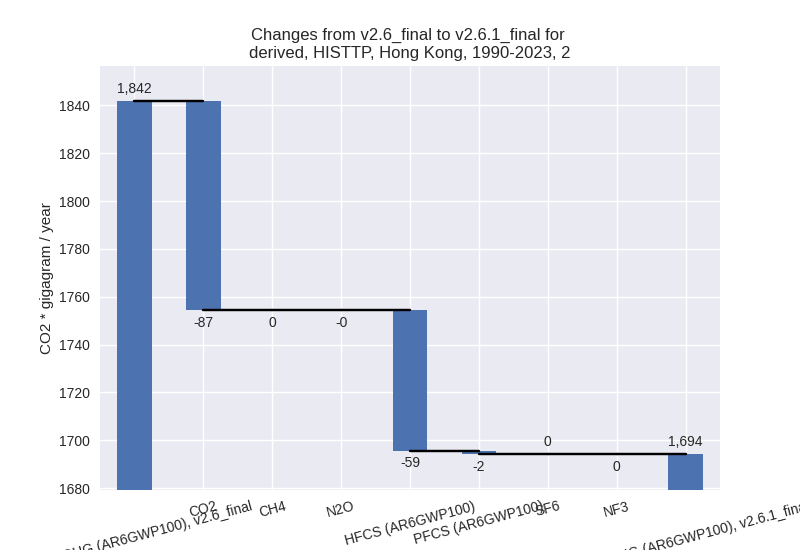
- M.AG: Total sectoral emissions in 2022 are 50.43 Gg
CO2 / year which is 0.1% of M.0.EL emissions. 2023 Emissions have
changed by 8.2% (3.84 Gg CO2 /
year). 1990-2023 Emissions have changed by 4.1% (2.24 Gg CO2 / year). For 2023 the
changes per gas
are:
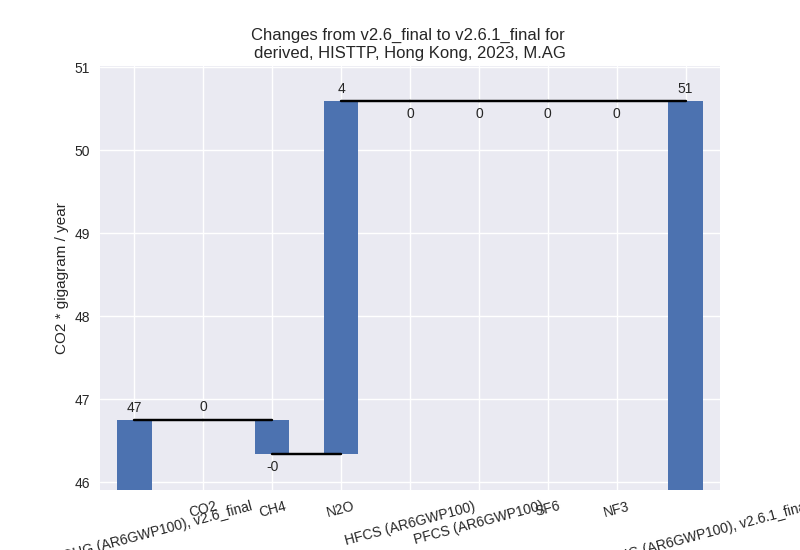
For 1990-2023 the changes per gas are: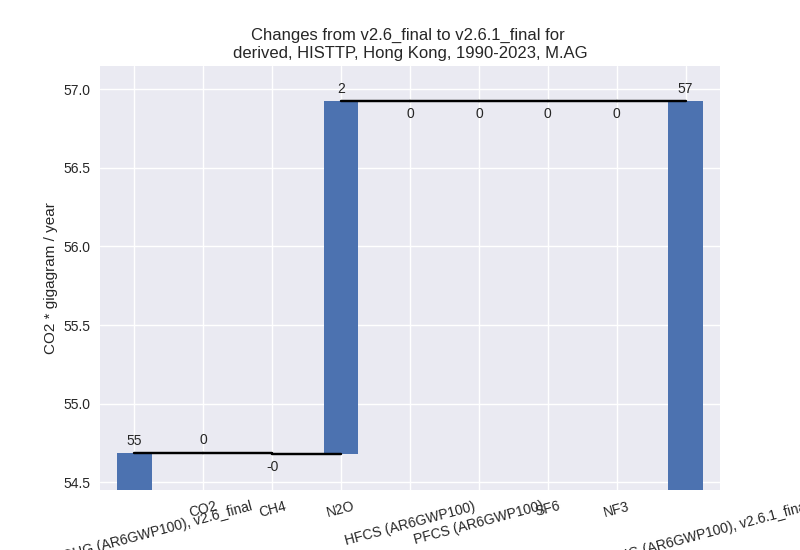
The changes come from the following subsectors:- 3.A: Total sectoral emissions in 2022 are 30.38 Gg CO2 / year which is 60.3% of category M.AG emissions. 2023 Emissions have changed by -0.4% (-0.13 Gg CO2 / year). 1990-2023 Emissions have changed by 0.0% (0.01 Gg CO2 / year).
- M.AG.ELV: Total sectoral emissions in 2022 are
20.05 Gg CO2 / year which is 39.7% of category M.AG emissions. 2023
Emissions have changed by 24.5%
(3.97 Gg CO2 / year). 1990-2023 Emissions have changed by 13.0% (2.23 Gg CO2 / year). For 2023 the
changes per gas
are:
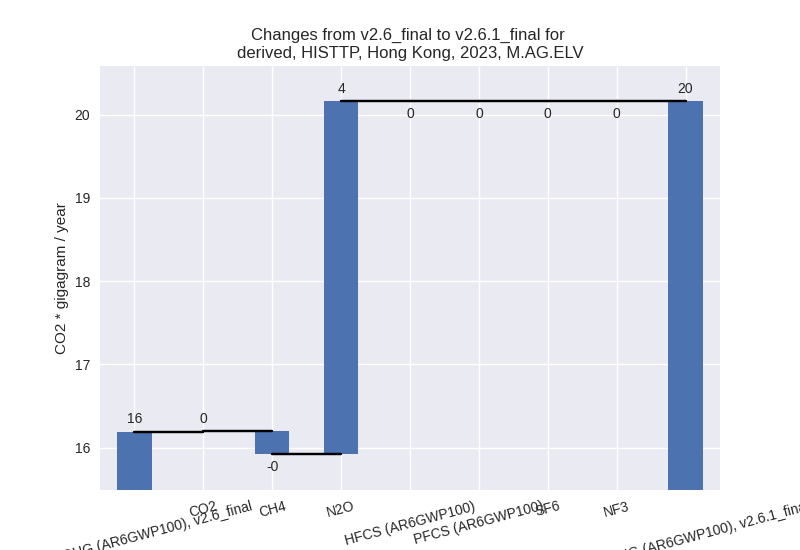
For 1990-2023 the changes per gas are:
There is no subsector information available in PRIMAP-hist.
- 4: Total sectoral emissions in 2022 are 4785.43 Gg
CO2 / year which is 13.5% of M.0.EL emissions. 2023 Emissions have
changed by -14.7% (-830.96 Gg CO2 /
year). 1990-2023 Emissions have changed by -15.1% (-722.76 Gg CO2 / year). For 2023
the changes per gas
are:
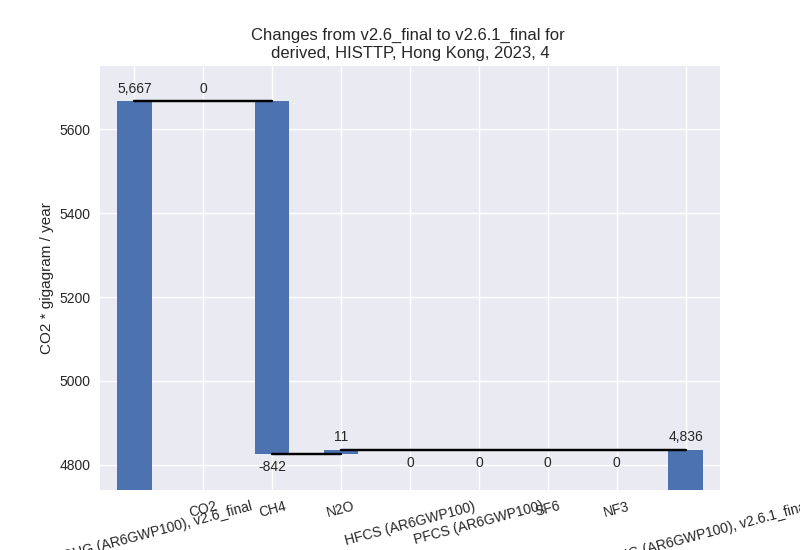
For 1990-2023 the changes per gas are:
- 5: Total sectoral emissions in 2022 are 110.93 Gg
CO2 / year which is 0.3% of M.0.EL emissions. 2023 Emissions have
changed by -15.4% (-22.56 Gg CO2 /
year). 1990-2023 Emissions have changed by -23.2% (-62.35 Gg CO2 / year). For 2023
the changes per gas
are:

For 1990-2023 the changes per gas are: