Changes in PRIMAP-hist v2.6.1_final compared to v2.6_final for Honduras
2025-03-19
Johannes Gütschow
Change analysis for Honduras for PRIMAP-hist v2.6.1_final compared to v2.6_final
Overview over emissions by sector and gas
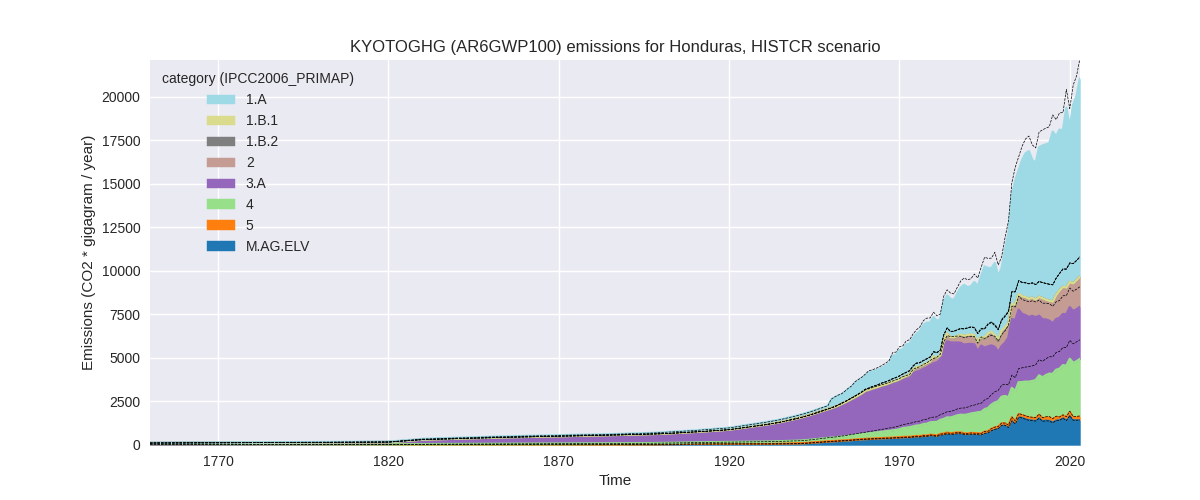
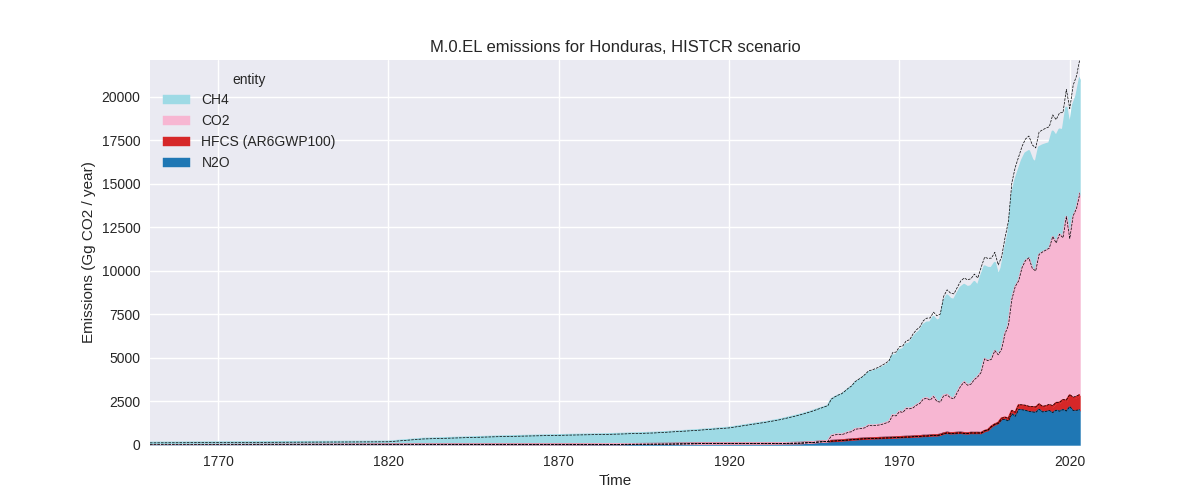
The following figures show the aggregate national total emissions excluding LULUCF AR6GWP100 for the country reported priority scenario. The dotted linesshow the v2.6_final data.
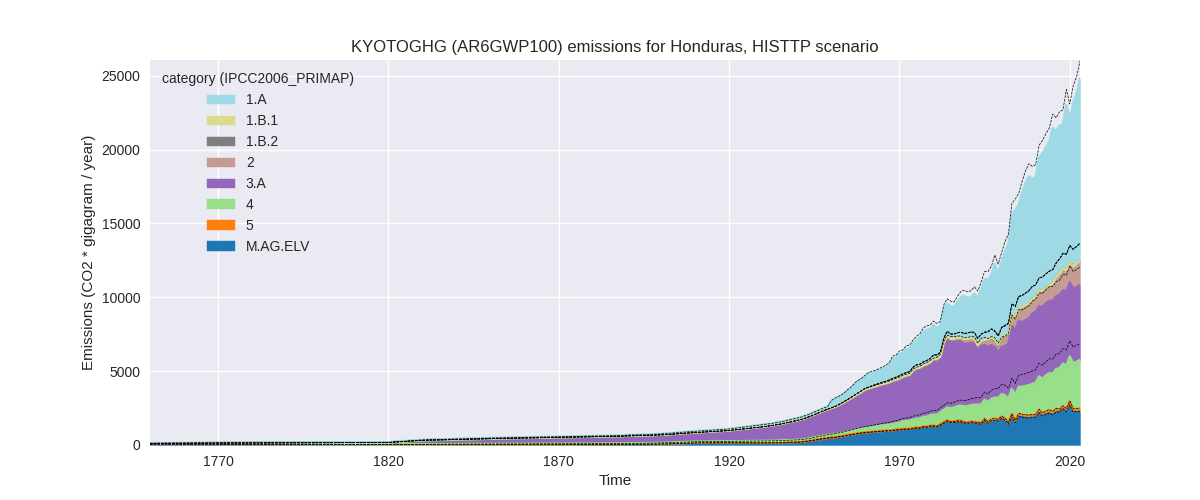
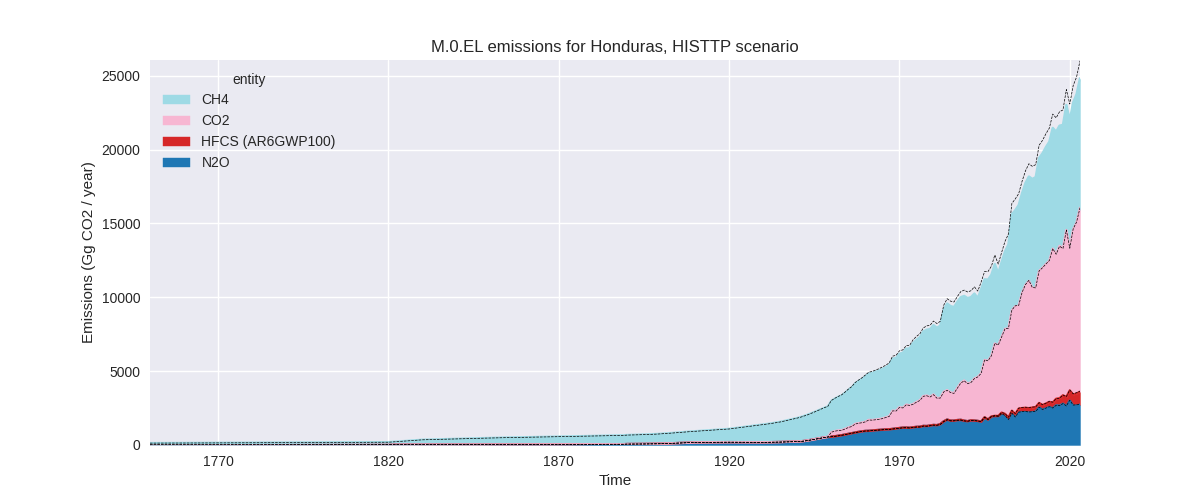
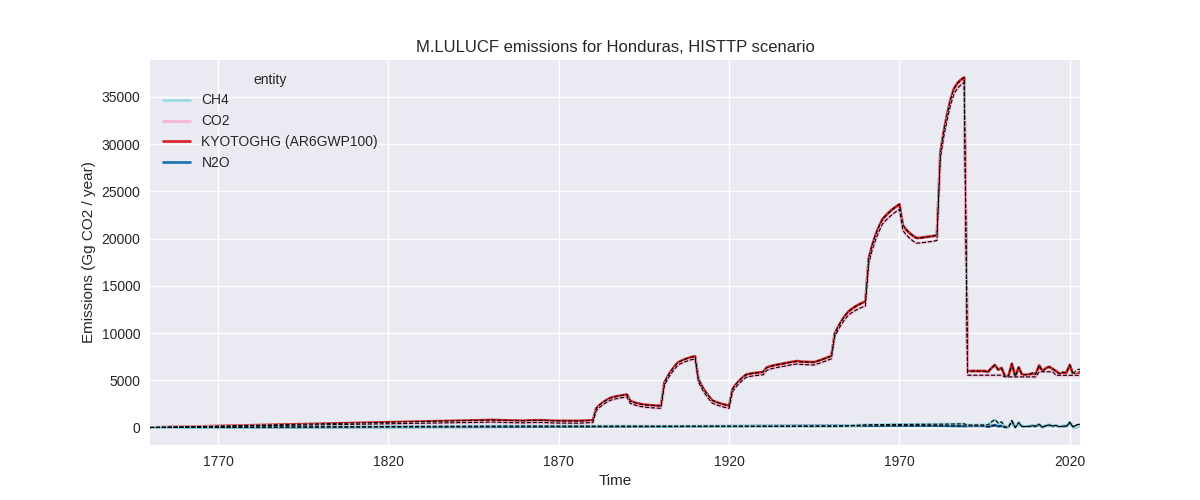
The following figures show the aggregate national total emissions excluding LULUCF AR6GWP100 for the third party priority scenario. The dotted linesshow the v2.6_final data.
Overview over changes
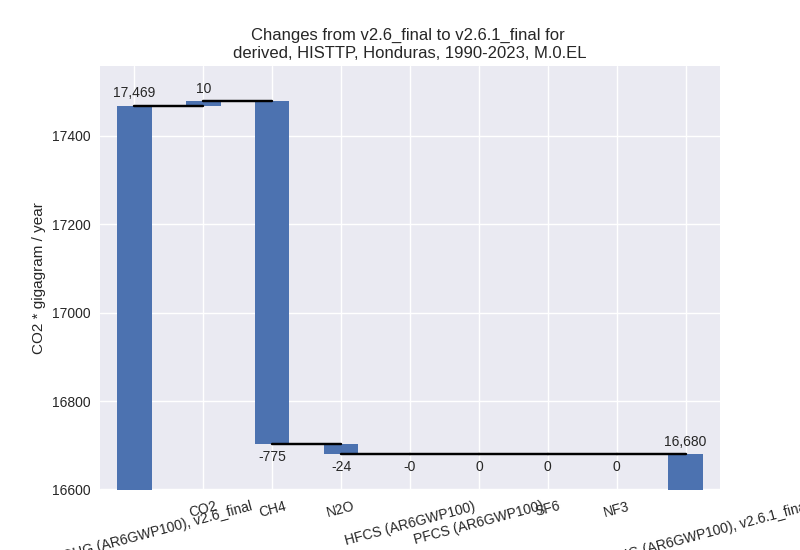
In the country reported priority scenario we have the following changes for aggregate Kyoto GHG and national total emissions excluding LULUCF (M.0.EL):
- Emissions in 2023 have changed by -5.2%% (-1156.48 Gg CO2 / year)
- Emissions in 1990-2023 have changed by -5.2%% (-794.55 Gg CO2 / year)
In the third party priority scenario we have the following changes for aggregate Kyoto GHG and national total emissions excluding LULUCF (M.0.EL):
- Emissions in 2023 have changed by -4.6%% (-1186.34 Gg CO2 / year)
- Emissions in 1990-2023 have changed by -4.5%% (-788.93 Gg CO2 / year)
Most important changes per scenario and time frame
In the country reported priority scenario the following sector-gas combinations have the highest absolute impact on national total KyotoGHG (AR6GWP100) emissions in 2023 (top 5):
- 1: 4, CH4 with -1056.86 Gg CO2 / year (-25.0%)
- 2: 3.A, CH4 with -58.93 Gg CO2 / year (-2.0%)
- 3: 1.A, CH4 with -24.30 Gg CO2 / year (-4.5%)
- 4: 5, N2O with -21.70 Gg CO2 / year (-9.1%)
- 5: 1.B.2, CO2 with 18.45 Gg CO2 / year (inf%)
In the country reported priority scenario the following sector-gas combinations have the highest absolute impact on national total KyotoGHG (AR6GWP100) emissions in 1990-2023 (top 5):
- 1: 4, CH4 with -763.03 Gg CO2 / year (-28.4%)
- 2: 5, N2O with -31.52 Gg CO2 / year (-18.1%)
- 3: 1.B.2, CO2 with 10.64 Gg CO2 / year (14100660.2%)
- 4: 3.A, CH4 with -6.79 Gg CO2 / year (-0.2%)
- 5: M.AG.ELV, N2O with -2.31 Gg CO2 / year (-0.2%)
In the third party priority scenario the following sector-gas combinations have the highest absolute impact on national total KyotoGHG (AR6GWP100) emissions in 2023 (top 5):
- 1: 4, CH4 with -1056.86 Gg CO2 / year (-25.0%)
- 2: 3.A, CH4 with -102.56 Gg CO2 / year (-2.0%)
- 3: 1.A, N2O with 29.77 Gg CO2 / year (21.8%)
- 4: M.AG.ELV, N2O with -28.05 Gg CO2 / year (-1.3%)
- 5: 1.A, CH4 with -23.16 Gg CO2 / year (-4.2%)
In the third party priority scenario the following sector-gas combinations have the highest absolute impact on national total KyotoGHG (AR6GWP100) emissions in 1990-2023 (top 5):
- 1: 4, CH4 with -763.03 Gg CO2 / year (-28.4%)
- 2: 5, N2O with -31.52 Gg CO2 / year (-18.1%)
- 3: 3.A, CH4 with -11.82 Gg CO2 / year (-0.3%)
- 4: 1.A, N2O with 11.34 Gg CO2 / year (9.1%)
- 5: 1.B.2, CO2 with 10.64 Gg CO2 / year (14100660.2%)
Notes on data changes
Here we list notes explaining important emissions changes for the country.
- No new country reported data has been included. While most changes in the CR time-series are small, there are some sectors where we don’t have country reported data which have higher changes, especially waste CH4 where EDGAR data is much lower than in the last release.
- Changes in the TP time-series are also based on new EDGAR and FAO data.
Changes by sector and gas
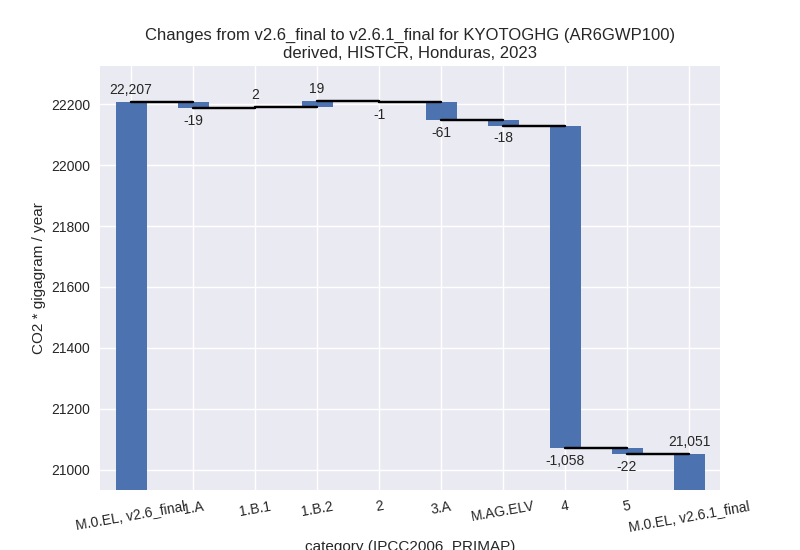
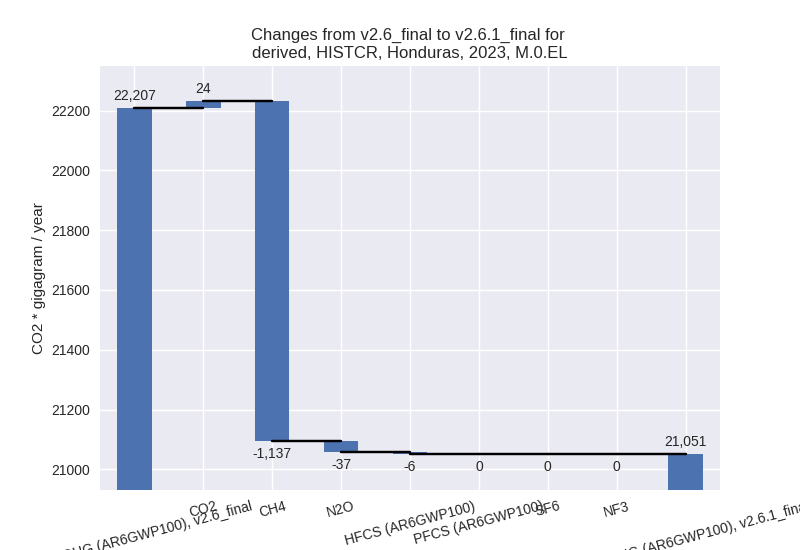
For each scenario and time frame the changes are displayed for all individual sectors and all individual gases. In the sector plot we use aggregate Kyoto GHGs in AR6GWP100. In the gas plot we usenational total emissions without LULUCF.
country reported scenario
2023
1990-2023

third party scenario
2023
1990-2023
Detailed changes for the scenarios:
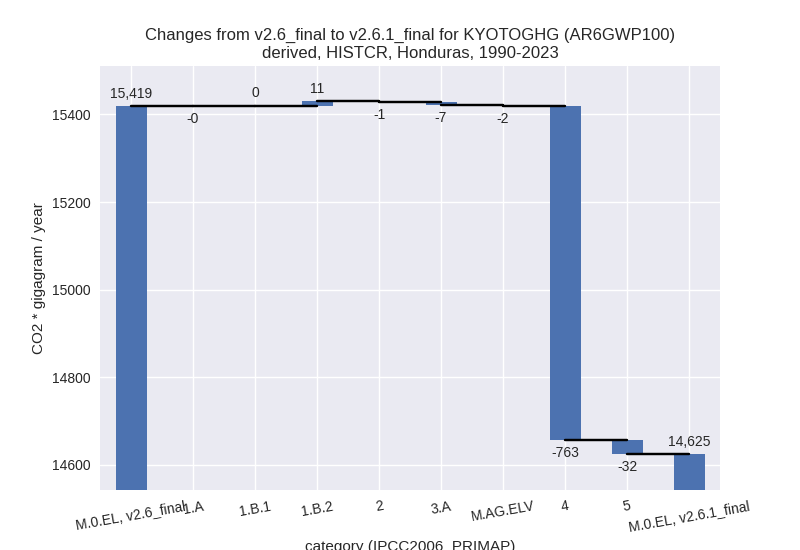
country reported scenario (HISTCR):
Most important changes per time frame
For 2023 the following sector-gas combinations have the highest absolute impact on national total KyotoGHG (AR6GWP100) emissions in 2023 (top 5):
- 1: 4, CH4 with -1056.86 Gg CO2 / year (-25.0%)
- 2: 3.A, CH4 with -58.93 Gg CO2 / year (-2.0%)
- 3: 1.A, CH4 with -24.30 Gg CO2 / year (-4.5%)
- 4: 5, N2O with -21.70 Gg CO2 / year (-9.1%)
- 5: 1.B.2, CO2 with 18.45 Gg CO2 / year (inf%)
For 1990-2023 the following sector-gas combinations have the highest absolute impact on national total KyotoGHG (AR6GWP100) emissions in 1990-2023 (top 5):
- 1: 4, CH4 with -763.03 Gg CO2 / year (-28.4%)
- 2: 5, N2O with -31.52 Gg CO2 / year (-18.1%)
- 3: 1.B.2, CO2 with 10.64 Gg CO2 / year (14100660.2%)
- 4: 3.A, CH4 with -6.79 Gg CO2 / year (-0.2%)
- 5: M.AG.ELV, N2O with -2.31 Gg CO2 / year (-0.2%)
Changes in the main sectors for aggregate KyotoGHG (AR6GWP100) are
- 1: Total sectoral emissions in 2022 are 10605.87 Gg CO2 / year which is 52.9% of M.0.EL emissions. 2023 Emissions have changed by 0.0% (2.53 Gg CO2 / year). 1990-2023 Emissions have changed by 0.2% (10.74 Gg CO2 / year).
- 2: Total sectoral emissions in 2022 are 1650.63 Gg CO2 / year which is 8.2% of M.0.EL emissions. 2023 Emissions have changed by -0.1% (-1.20 Gg CO2 / year). 1990-2023 Emissions have changed by -0.1% (-1.31 Gg CO2 / year).
- M.AG: Total sectoral emissions in 2022 are 4395.04 Gg CO2 / year which is 21.9% of M.0.EL emissions. 2023 Emissions have changed by -1.8% (-78.38 Gg CO2 / year). 1990-2023 Emissions have changed by -0.2% (-9.33 Gg CO2 / year).
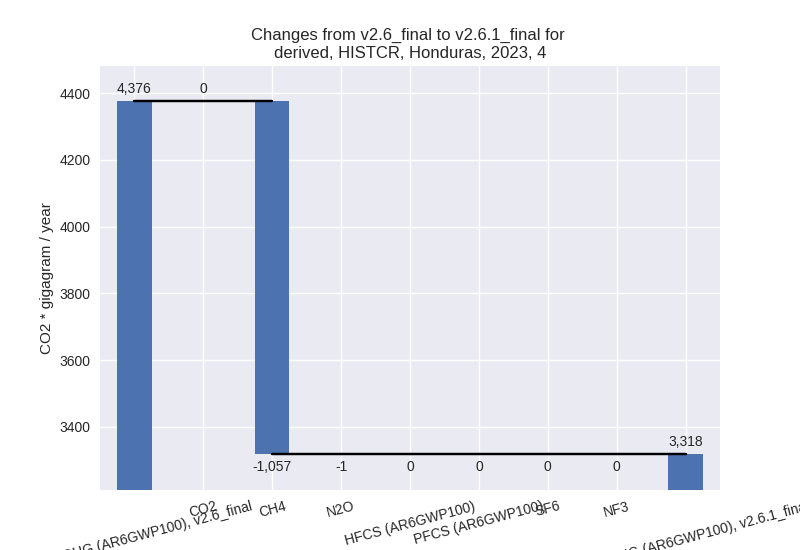
- 4: Total sectoral emissions in 2022 are 3232.05 Gg
CO2 / year which is 16.1% of M.0.EL emissions. 2023 Emissions have
changed by -24.2% (-1057.74 Gg CO2 /
year). 1990-2023 Emissions have changed by -27.2% (-763.12 Gg CO2 / year). For 2023
the changes per gas
are:
For 1990-2023 the changes per gas are:
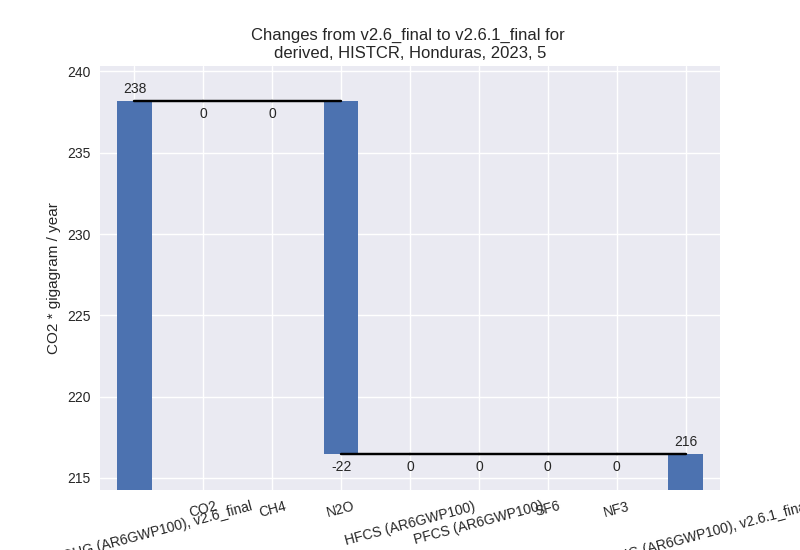
- 5: Total sectoral emissions in 2022 are 164.38 Gg
CO2 / year which is 0.8% of M.0.EL emissions. 2023 Emissions have
changed by -9.1% (-21.70 Gg CO2 /
year). 1990-2023 Emissions have changed by -18.1% (-31.52 Gg CO2 / year). For 2023
the changes per gas
are:
For 1990-2023 the changes per gas are:
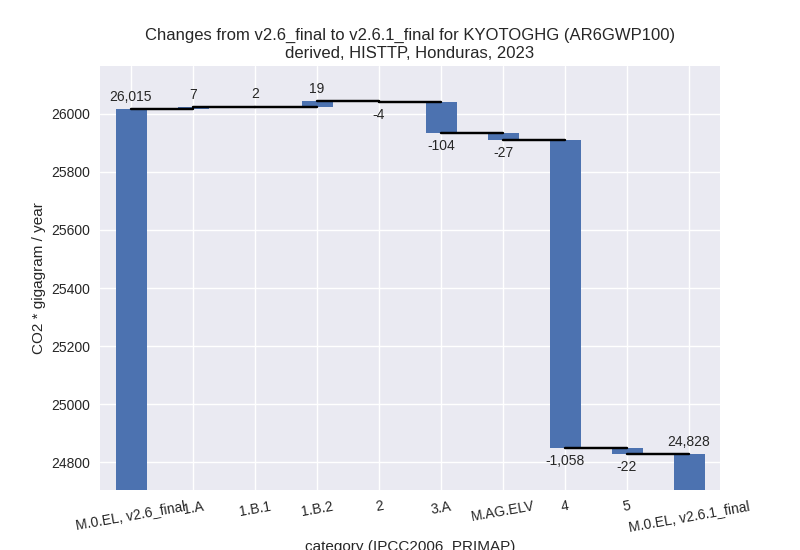
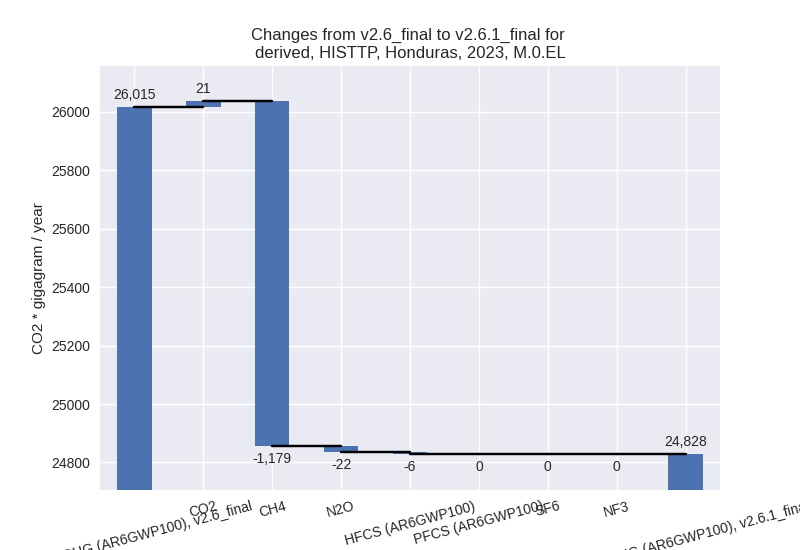
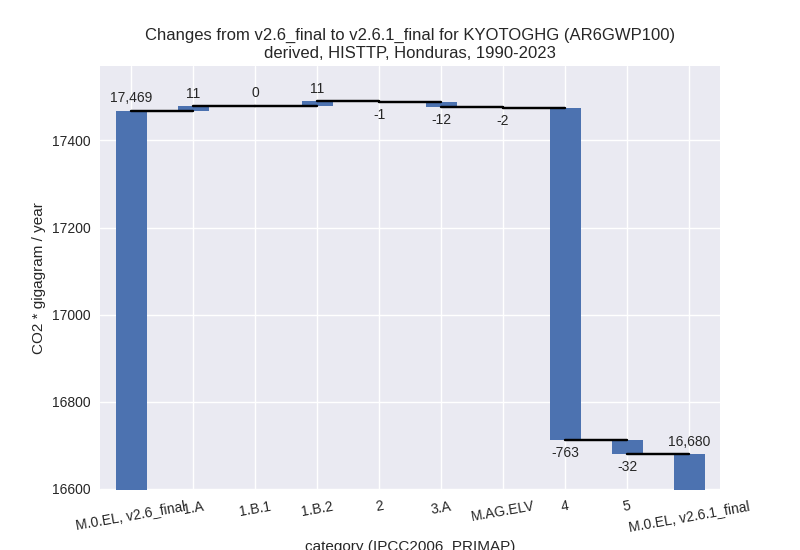
third party scenario (HISTTP):
Most important changes per time frame
For 2023 the following sector-gas combinations have the highest absolute impact on national total KyotoGHG (AR6GWP100) emissions in 2023 (top 5):
- 1: 4, CH4 with -1056.86 Gg CO2 / year (-25.0%)
- 2: 3.A, CH4 with -102.56 Gg CO2 / year (-2.0%)
- 3: 1.A, N2O with 29.77 Gg CO2 / year (21.8%)
- 4: M.AG.ELV, N2O with -28.05 Gg CO2 / year (-1.3%)
- 5: 1.A, CH4 with -23.16 Gg CO2 / year (-4.2%)
For 1990-2023 the following sector-gas combinations have the highest absolute impact on national total KyotoGHG (AR6GWP100) emissions in 1990-2023 (top 5):
- 1: 4, CH4 with -763.03 Gg CO2 / year (-28.4%)
- 2: 5, N2O with -31.52 Gg CO2 / year (-18.1%)
- 3: 3.A, CH4 with -11.82 Gg CO2 / year (-0.3%)
- 4: 1.A, N2O with 11.34 Gg CO2 / year (9.1%)
- 5: 1.B.2, CO2 with 10.64 Gg CO2 / year (14100660.2%)
Changes in the main sectors for aggregate KyotoGHG (AR6GWP100) are
- 1: Total sectoral emissions in 2022 are 11502.25 Gg CO2 / year which is 48.4% of M.0.EL emissions. 2023 Emissions have changed by 0.2% (27.68 Gg CO2 / year). 1990-2023 Emissions have changed by 0.3% (21.42 Gg CO2 / year).
- 2: Total sectoral emissions in 2022 are 1559.48 Gg CO2 / year which is 6.6% of M.0.EL emissions. 2023 Emissions have changed by -0.2% (-3.89 Gg CO2 / year). 1990-2023 Emissions have changed by -0.2% (-1.47 Gg CO2 / year).
- M.AG: Total sectoral emissions in 2022 are 7296.24 Gg CO2 / year which is 30.7% of M.0.EL emissions. 2023 Emissions have changed by -1.8% (-130.70 Gg CO2 / year). 1990-2023 Emissions have changed by -0.2% (-14.24 Gg CO2 / year).
- 4: Total sectoral emissions in 2022 are 3232.05 Gg
CO2 / year which is 13.6% of M.0.EL emissions. 2023 Emissions have
changed by -24.2% (-1057.74 Gg CO2 /
year). 1990-2023 Emissions have changed by -27.2% (-763.12 Gg CO2 / year). For 2023
the changes per gas
are:

For 1990-2023 the changes per gas are:
- 5: Total sectoral emissions in 2022 are 164.38 Gg
CO2 / year which is 0.7% of M.0.EL emissions. 2023 Emissions have
changed by -9.1% (-21.70 Gg CO2 /
year). 1990-2023 Emissions have changed by -18.1% (-31.52 Gg CO2 / year). For 2023
the changes per gas
are:

For 1990-2023 the changes per gas are: