Changes in PRIMAP-hist v2.6.1_final compared to v2.6_final for Croatia
2025-03-19
Johannes Gütschow
Change analysis for Croatia for PRIMAP-hist v2.6.1_final compared to v2.6_final
Overview over emissions by sector and gas
The following figures show the aggregate national total emissions excluding LULUCF AR6GWP100 for the country reported priority scenario. The dotted linesshow the v2.6_final data.
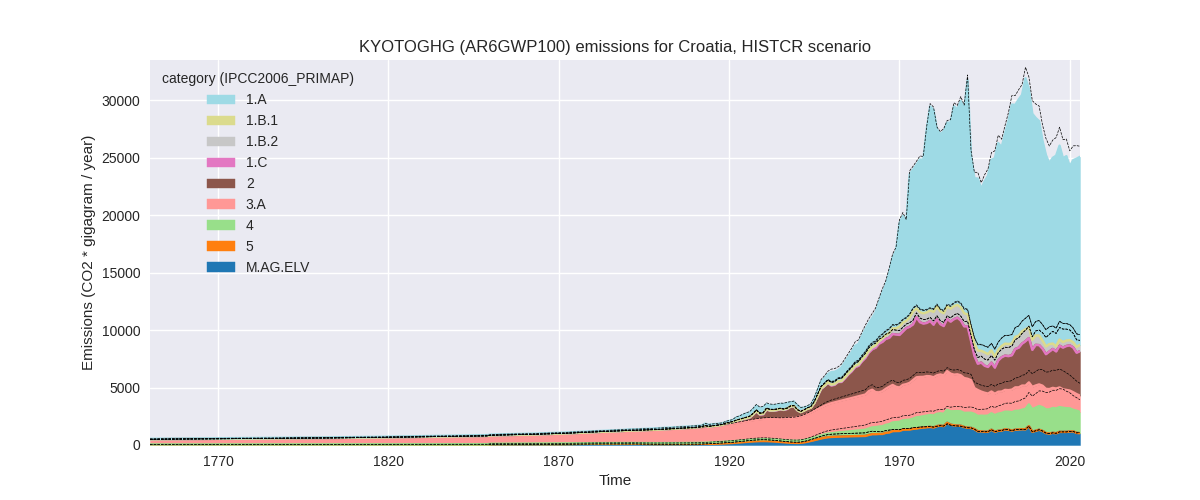
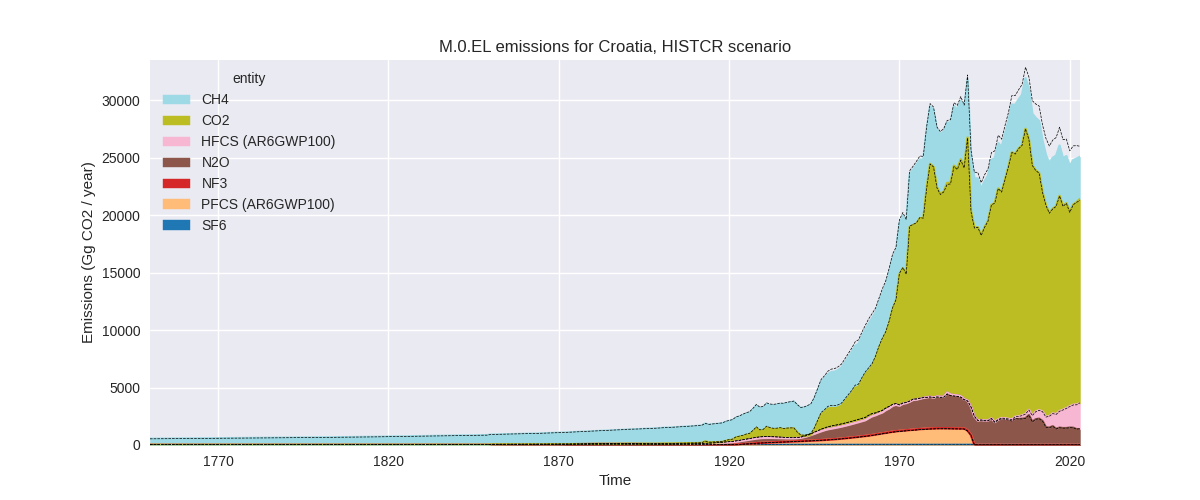
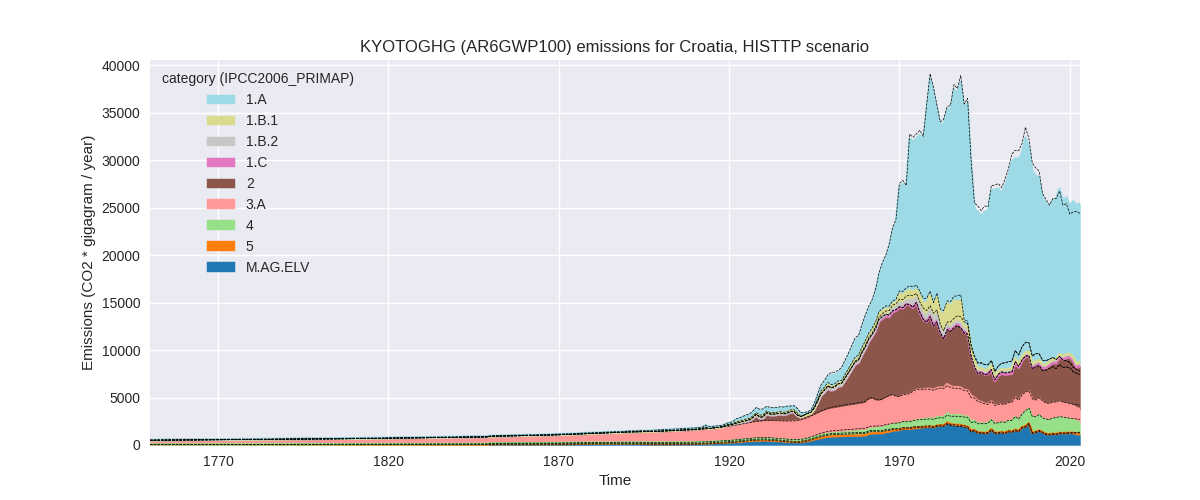
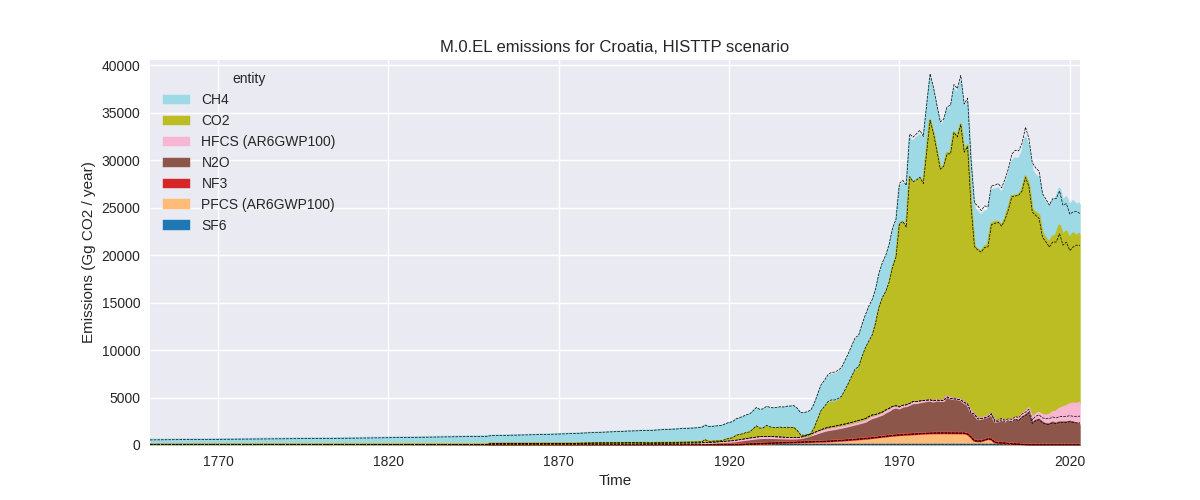
The following figures show the aggregate national total emissions excluding LULUCF AR6GWP100 for the third party priority scenario. The dotted linesshow the v2.6_final data.
Overview over changes
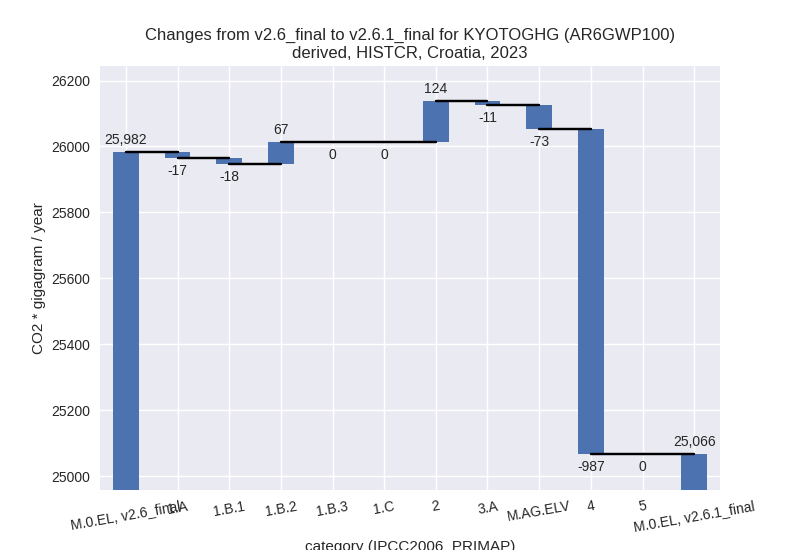
In the country reported priority scenario we have the following changes for aggregate Kyoto GHG and national total emissions excluding LULUCF (M.0.EL):
- Emissions in 2023 have changed by -3.5%% (-916.09 Gg CO2 / year)
- Emissions in 1990-2023 have changed by -3.6%% (-996.17 Gg CO2 / year)
In the third party priority scenario we have the following changes for aggregate Kyoto GHG and national total emissions excluding LULUCF (M.0.EL):
- Emissions in 2023 have changed by 4.3%% (1046.61 Gg CO2 / year)
- Emissions in 1990-2023 have changed by -1.2%% (-343.66 Gg CO2 / year)
Most important changes per scenario and time frame
In the country reported priority scenario the following sector-gas combinations have the highest absolute impact on national total KyotoGHG (AR6GWP100) emissions in 2023 (top 5):
- 1: 4, CH4 with -988.53 Gg CO2 / year (-36.2%)
- 2: 2, CO2 with 114.56 Gg CO2 / year (8.0%)
- 3: 1.B.2, CO2 with 59.26 Gg CO2 / year (17.3%)
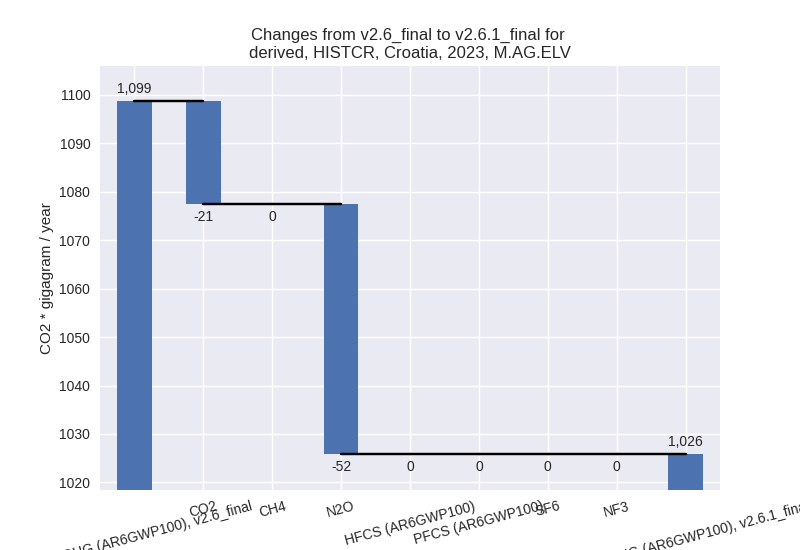
- 4: M.AG.ELV, N2O with -51.59 Gg CO2 / year (-5.1%)
- 5: M.AG.ELV, CO2 with -21.29 Gg CO2 / year (-27.6%)
In the country reported priority scenario the following sector-gas combinations have the highest absolute impact on national total KyotoGHG (AR6GWP100) emissions in 1990-2023 (top 5):
- 1: 4, CH4 with -998.51 Gg CO2 / year (-37.6%)
- 2: 1.B.1, CH4 with -6.43 Gg CO2 / year (-38.0%)
- 3: 2, HFCS (AR6GWP100) with 5.52 Gg CO2 / year (0.9%)
- 4: 2, CO2 with 3.37 Gg CO2 / year (0.2%)
- 5: 2, PFCS (AR6GWP100) with 1.90 Gg CO2 / year (3.2%)
In the third party priority scenario the following sector-gas combinations have the highest absolute impact on national total KyotoGHG (AR6GWP100) emissions in 2023 (top 5):
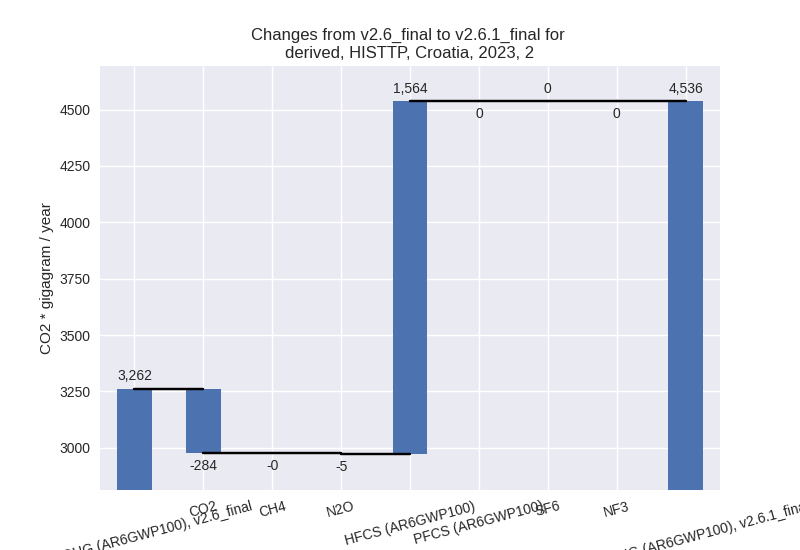
- 1: 2, HFCS (AR6GWP100) with 1564.03 Gg CO2 / year (226.9%)
- 2: 2, CO2 with -284.33 Gg CO2 / year (-15.6%)
- 3: M.AG.ELV, N2O with -168.03 Gg CO2 / year (-14.7%)
- 4: 1.B.2, CO2 with 167.47 Gg CO2 / year (inf%)
- 5: 1.B.2, CH4 with -139.65 Gg CO2 / year (-44.4%)
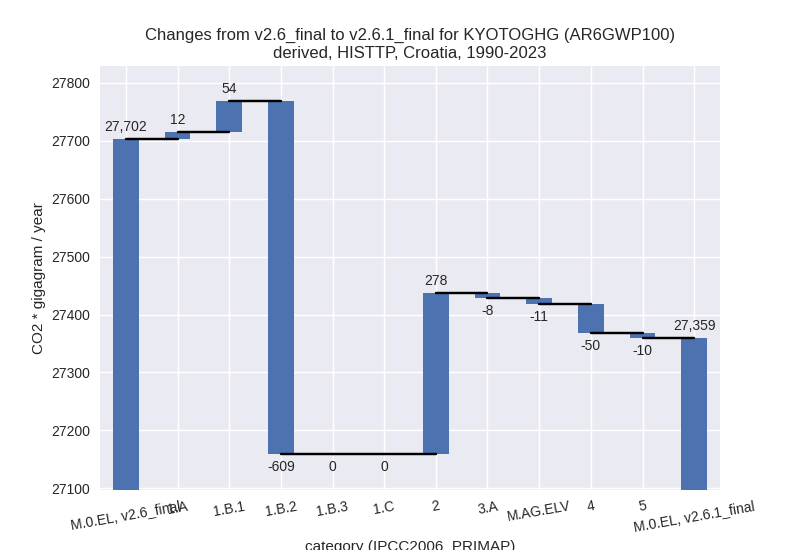
In the third party priority scenario the following sector-gas combinations have the highest absolute impact on national total KyotoGHG (AR6GWP100) emissions in 1990-2023 (top 5):
- 1: 1.B.2, CH4 with -720.33 Gg CO2 / year (-74.2%)
- 2: 2, HFCS (AR6GWP100) with 299.62 Gg CO2 / year (87.1%)
- 3: 1.B.2, CO2 with 110.91 Gg CO2 / year (1393.6%)
- 4: 1.B.1, CH4 with 53.55 Gg CO2 / year (249.6%)
- 5: 4, CH4 with -50.61 Gg CO2 / year (-4.0%)
Notes on data changes
Here we list notes explaining important emissions changes for the country.
- CRT data has been included. It replaces official data reported to
the EU which does not show noteworthy differences for most sectors but
differs for some.
- The dominating change in the CR scenario for both 2023 and cumulative emissions is that waste emissions are over 35% lower in the CRT data compared to the EU inventory data used in PRIMAP-hist v2.6. All other changes are small in their influence on total emissions and come from third party data.
- In the TP scenario the main changes for 2023 are HFCs where EDGAR
now follows the country reported emissions, lower CO2 in 2.B (from
EDGAR), lower N2O in M.AG.ELV due to an emission drop in 2022 in the new
FAO data, and changed fugitive emissions (from EDGAR)
- For cumulative emissions HFCs and fugitive emissions play the most important roles. Waste CH4 emissions are also lower (all from EDGAR data)
Changes by sector and gas
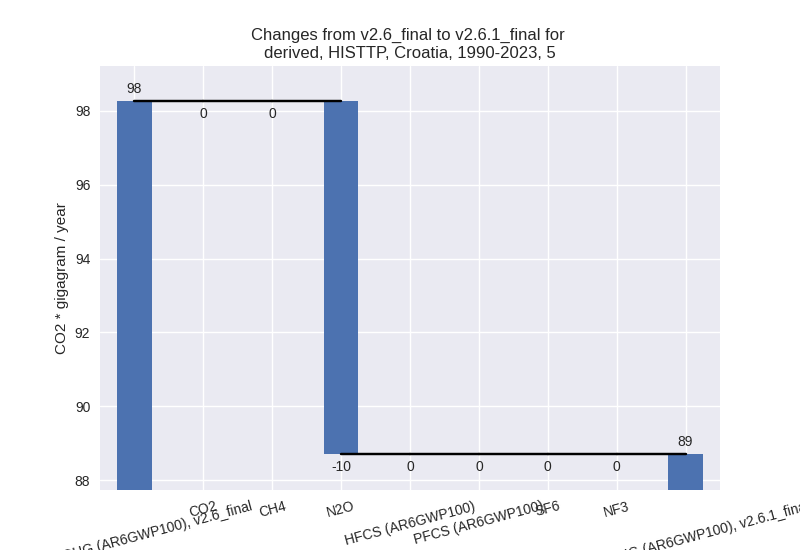
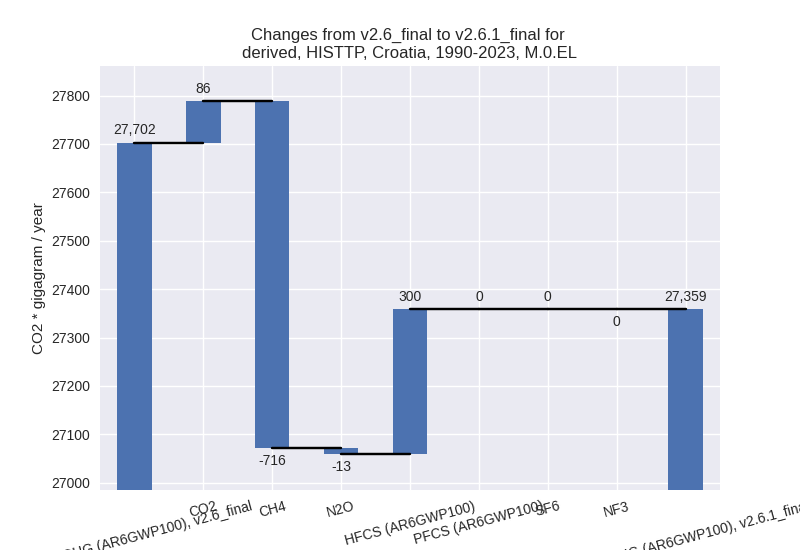
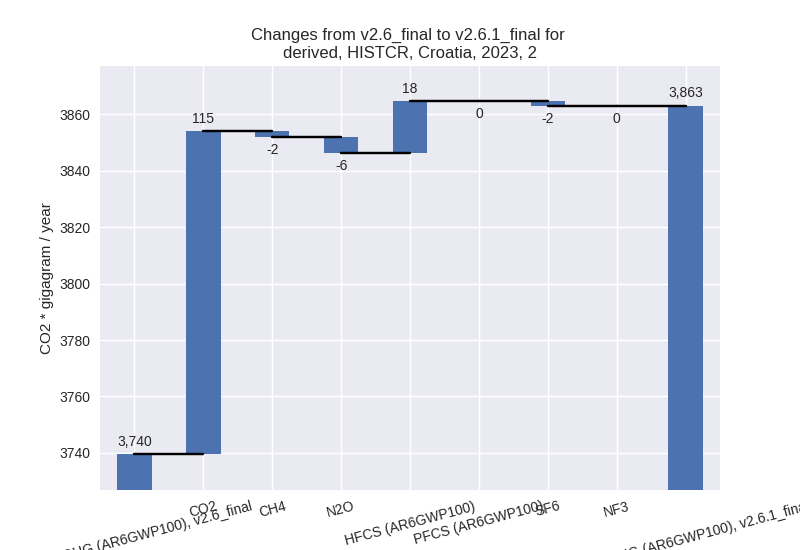
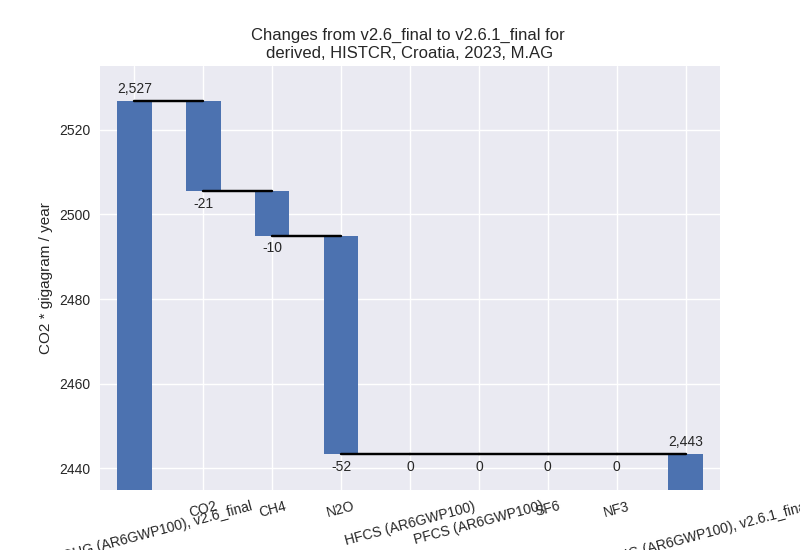
For each scenario and time frame the changes are displayed for all individual sectors and all individual gases. In the sector plot we use aggregate Kyoto GHGs in AR6GWP100. In the gas plot we usenational total emissions without LULUCF.
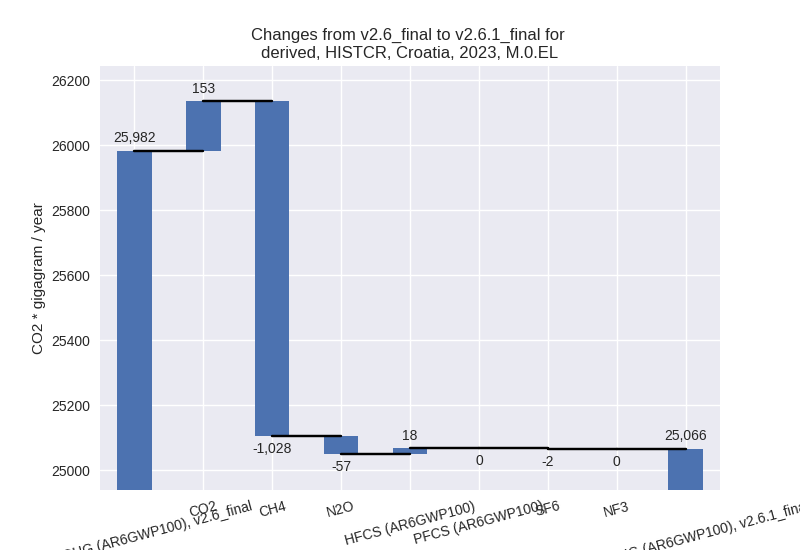
country reported scenario
2023
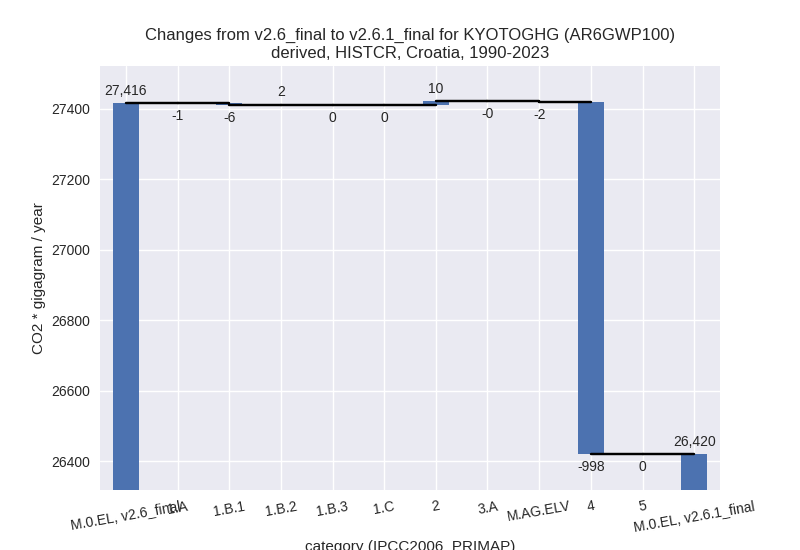
1990-2023

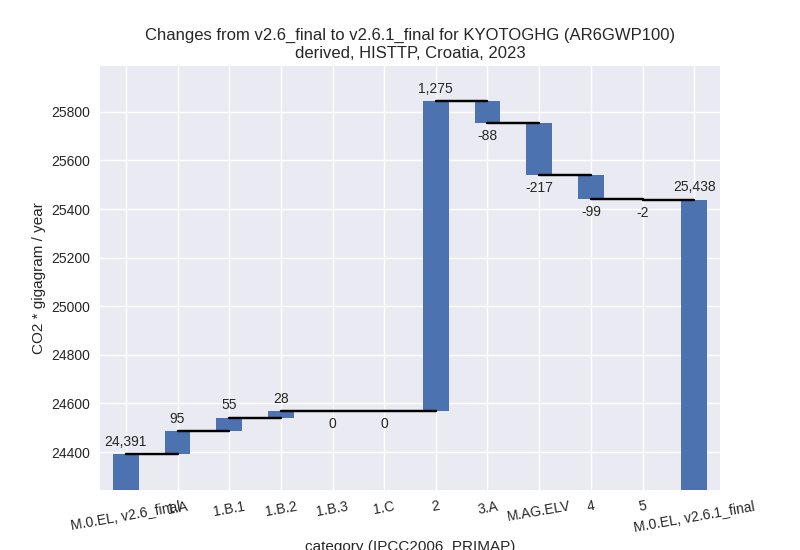
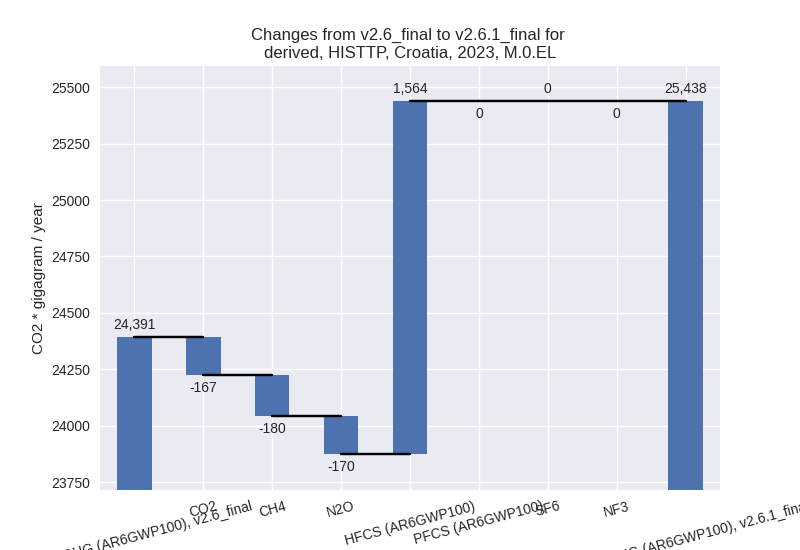
third party scenario
2023
1990-2023
Detailed changes for the scenarios:
country reported scenario (HISTCR):
Most important changes per time frame
For 2023 the following sector-gas combinations have the highest absolute impact on national total KyotoGHG (AR6GWP100) emissions in 2023 (top 5):
- 1: 4, CH4 with -988.53 Gg CO2 / year (-36.2%)
- 2: 2, CO2 with 114.56 Gg CO2 / year (8.0%)
- 3: 1.B.2, CO2 with 59.26 Gg CO2 / year (17.3%)
- 4: M.AG.ELV, N2O with -51.59 Gg CO2 / year (-5.1%)
- 5: M.AG.ELV, CO2 with -21.29 Gg CO2 / year (-27.6%)
For 1990-2023 the following sector-gas combinations have the highest absolute impact on national total KyotoGHG (AR6GWP100) emissions in 1990-2023 (top 5):
- 1: 4, CH4 with -998.51 Gg CO2 / year (-37.6%)
- 2: 1.B.1, CH4 with -6.43 Gg CO2 / year (-38.0%)
- 3: 2, HFCS (AR6GWP100) with 5.52 Gg CO2 / year (0.9%)
- 4: 2, CO2 with 3.37 Gg CO2 / year (0.2%)
- 5: 2, PFCS (AR6GWP100) with 1.90 Gg CO2 / year (3.2%)
Changes in the main sectors for aggregate KyotoGHG (AR6GWP100) are
- 1: Total sectoral emissions in 2022 are 16875.85 Gg CO2 / year which is 67.8% of M.0.EL emissions. 2023 Emissions have changed by 0.2% (31.28 Gg CO2 / year). 1990-2023 Emissions have changed by -0.0% (-4.98 Gg CO2 / year).
- 2: Total sectoral emissions in 2022 are 3600.91 Gg
CO2 / year which is 14.5% of M.0.EL emissions. 2023 Emissions have
changed by 3.3% (123.53 Gg CO2 /
year). 1990-2023 Emissions have changed by 0.3% (9.74 Gg CO2 / year). For 2023 the
changes per gas
are:
- M.AG: Total sectoral emissions in 2022 are 2492.91
Gg CO2 / year which is 10.0% of M.0.EL emissions. 2023 Emissions have
changed by -3.3% (-83.50 Gg CO2 /
year). 1990-2023 Emissions have changed by -0.1% (-2.46 Gg CO2 / year). For 2023 the
changes per gas
are:
The changes come from the following subsectors:- 3.A: Total sectoral emissions in 2022 are 1442.60 Gg CO2 / year which is 57.9% of category M.AG emissions. 2023 Emissions have changed by -0.7% (-10.62 Gg CO2 / year). 1990-2023 Emissions have changed by -0.0% (-0.31 Gg CO2 / year).
- M.AG.ELV: Total sectoral emissions in 2022 are
1050.31 Gg CO2 / year which is 42.1% of category M.AG emissions. 2023
Emissions have changed by -6.6%
(-72.88 Gg CO2 / year). 1990-2023 Emissions have changed by -0.2% (-2.14 Gg CO2 / year). For 2023 the
changes per gas
are:
There is no subsector information available in PRIMAP-hist.
- 4: Total sectoral emissions in 2022 are 1931.72 Gg
CO2 / year which is 7.8% of M.0.EL emissions. 2023 Emissions have
changed by -34.8% (-987.40 Gg CO2 /
year). 1990-2023 Emissions have changed by -36.5% (-998.48 Gg CO2 / year). For 2023
the changes per gas
are:

For 1990-2023 the changes per gas are: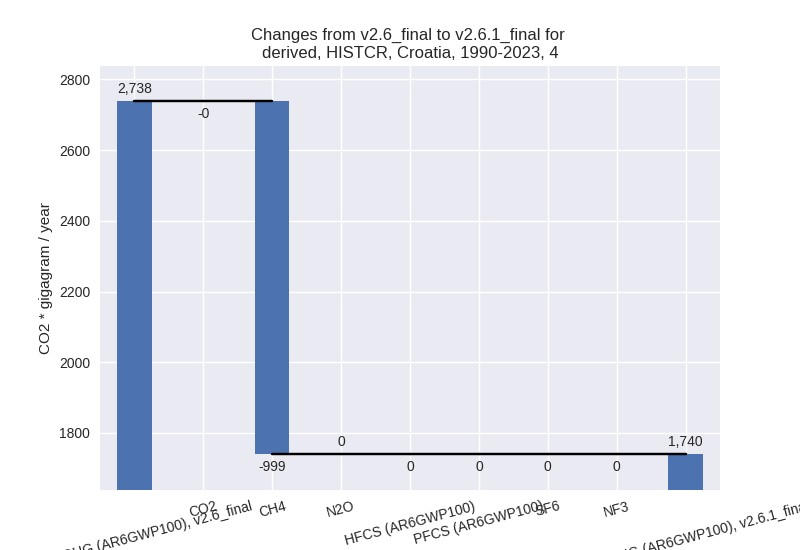
- 5: No data
third party scenario (HISTTP):
Most important changes per time frame
For 2023 the following sector-gas combinations have the highest absolute impact on national total KyotoGHG (AR6GWP100) emissions in 2023 (top 5):
- 1: 2, HFCS (AR6GWP100) with 1564.03 Gg CO2 / year (226.9%)
- 2: 2, CO2 with -284.33 Gg CO2 / year (-15.6%)
- 3: M.AG.ELV, N2O with -168.03 Gg CO2 / year (-14.7%)
- 4: 1.B.2, CO2 with 167.47 Gg CO2 / year (inf%)
- 5: 1.B.2, CH4 with -139.65 Gg CO2 / year (-44.4%)
For 1990-2023 the following sector-gas combinations have the highest absolute impact on national total KyotoGHG (AR6GWP100) emissions in 1990-2023 (top 5):
- 1: 1.B.2, CH4 with -720.33 Gg CO2 / year (-74.2%)
- 2: 2, HFCS (AR6GWP100) with 299.62 Gg CO2 / year (87.1%)
- 3: 1.B.2, CO2 with 110.91 Gg CO2 / year (1393.6%)
- 4: 1.B.1, CH4 with 53.55 Gg CO2 / year (249.6%)
- 5: 4, CH4 with -50.61 Gg CO2 / year (-4.0%)
Changes in the main sectors for aggregate KyotoGHG (AR6GWP100) are
- 1: Total sectoral emissions in 2022 are 17126.58 Gg
CO2 / year which is 67.8% of M.0.EL emissions. 2023 Emissions have
changed by 1.0% (177.42 Gg CO2 /
year). 1990-2023 Emissions have changed by -2.8% (-543.52 Gg CO2 / year). For
1990-2023 the changes per gas
are:
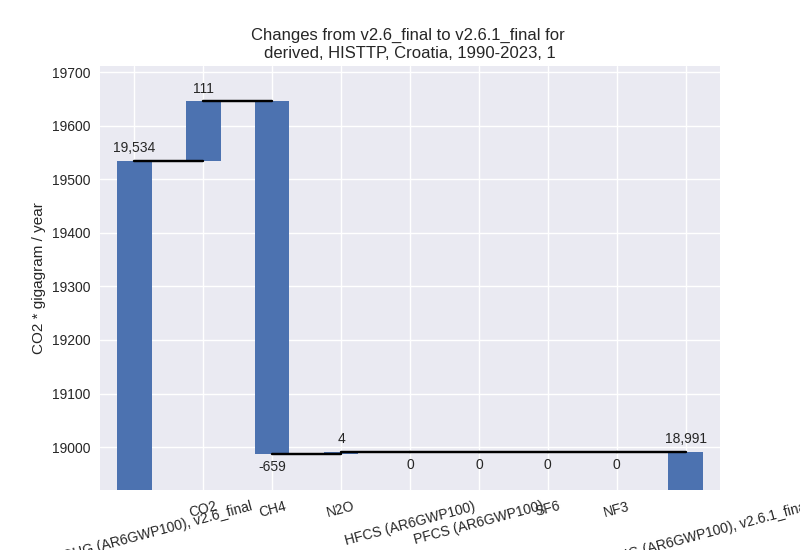
The changes come from the following subsectors:- 1.A: Total sectoral emissions in 2022 are 16705.61 Gg CO2 / year which is 97.5% of category 1 emissions. 2023 Emissions have changed by 0.6% (94.78 Gg CO2 / year). 1990-2023 Emissions have changed by 0.1% (12.01 Gg CO2 / year).
- 1.B.1: Total sectoral emissions in 2022 are 91.64
Gg CO2 / year which is 0.5% of category 1 emissions. 2023 Emissions have
changed by 148.0% (54.77 Gg CO2 /
year). 1990-2023 Emissions have changed by 121.6% (53.86 Gg CO2 / year). For 2023 the
changes per gas
are:

For 1990-2023 the changes per gas are: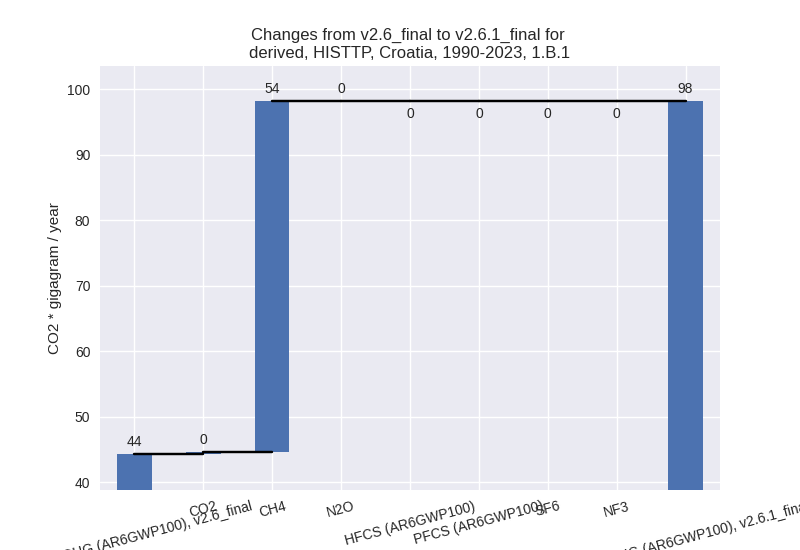
There is no subsector information available in PRIMAP-hist. - 1.B.2: Total sectoral emissions in 2022 are 329.33
Gg CO2 / year which is 1.9% of category 1 emissions. 2023 Emissions have
changed by 8.9% (27.87 Gg CO2 /
year). 1990-2023 Emissions have changed by -62.3% (-609.38 Gg CO2 / year). For 2023
the changes per gas
are:
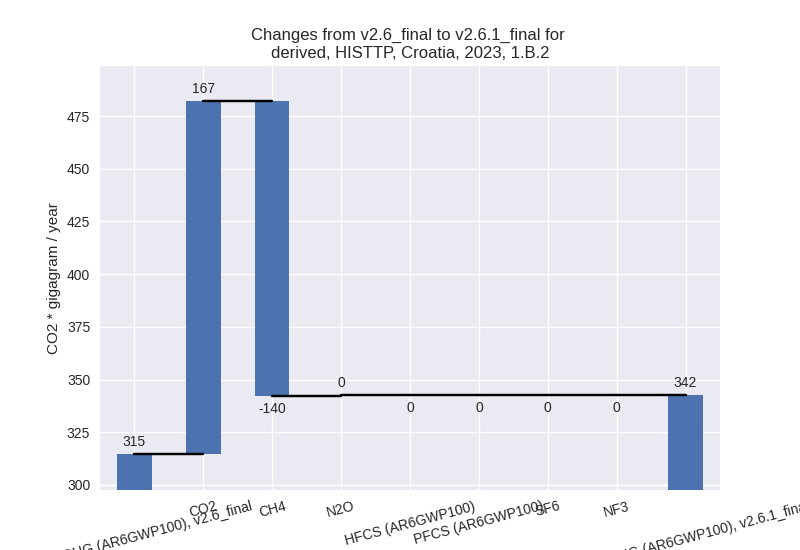
For 1990-2023 the changes per gas are: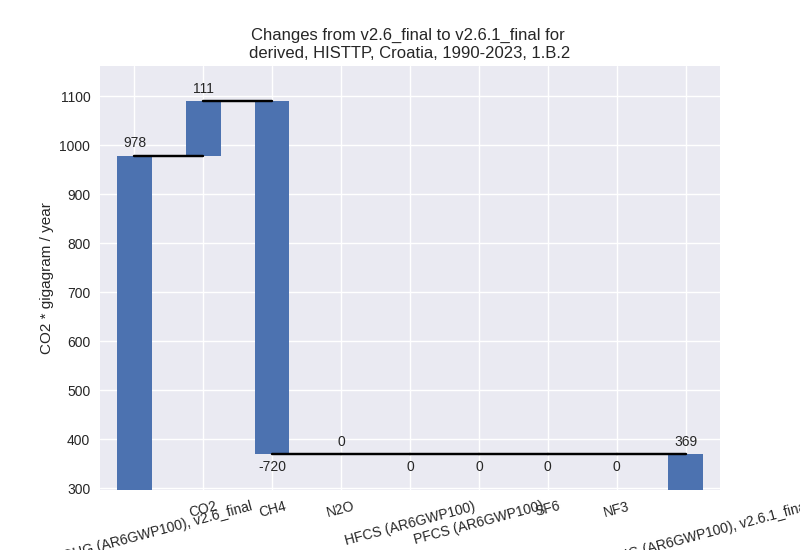
There is no subsector information available in PRIMAP-hist.
- 2: Total sectoral emissions in 2022 are 4275.86 Gg
CO2 / year which is 16.9% of M.0.EL emissions. 2023 Emissions have
changed by 39.1% (1274.86 Gg CO2 /
year). 1990-2023 Emissions have changed by 7.9% (277.74 Gg CO2 / year). For 2023 the
changes per gas
are:
For 1990-2023 the changes per gas are: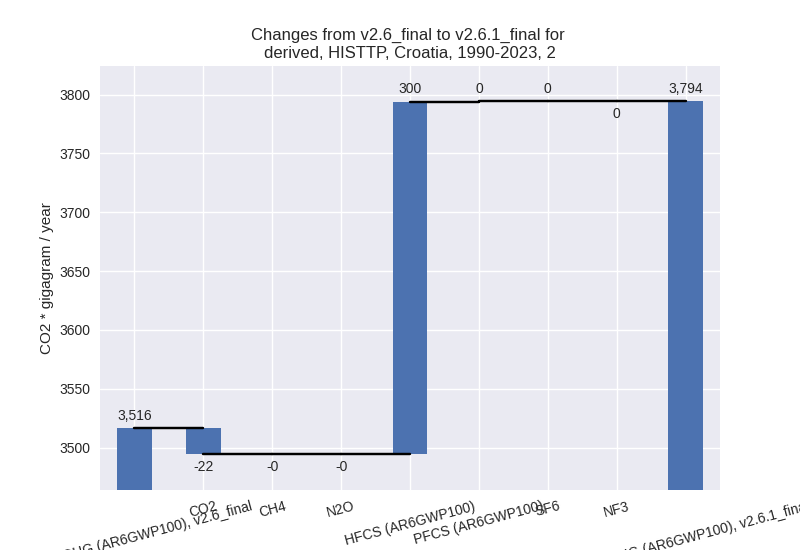
- M.AG: Total sectoral emissions in 2022 are 2511.17
Gg CO2 / year which is 9.9% of M.0.EL emissions. 2023 Emissions have
changed by -11.0% (-304.79 Gg CO2 /
year). 1990-2023 Emissions have changed by -0.6% (-18.64 Gg CO2 / year). For 2023 the
changes per gas
are:

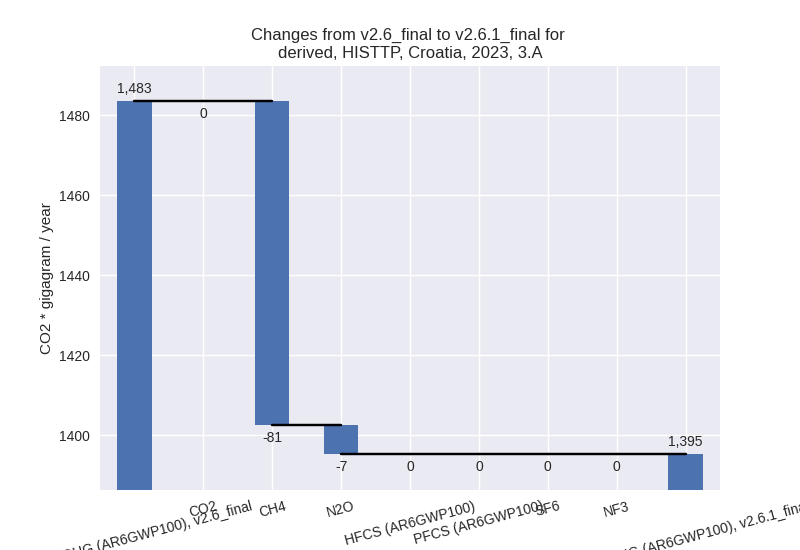
The changes come from the following subsectors:- 3.A: Total sectoral emissions in 2022 are 1420.33
Gg CO2 / year which is 56.6% of category M.AG emissions. 2023 Emissions
have changed by -6.0% (-88.27 Gg CO2
/ year). 1990-2023 Emissions have changed by -0.4% (-7.55 Gg CO2 / year). For 2023 the
changes per gas
are:
There is no subsector information available in PRIMAP-hist. - M.AG.ELV: Total sectoral emissions in 2022 are
1090.84 Gg CO2 / year which is 43.4% of category M.AG emissions. 2023
Emissions have changed by -16.9%
(-216.52 Gg CO2 / year). 1990-2023 Emissions have changed by -0.8% (-11.10 Gg CO2 / year). For 2023 the
changes per gas
are:
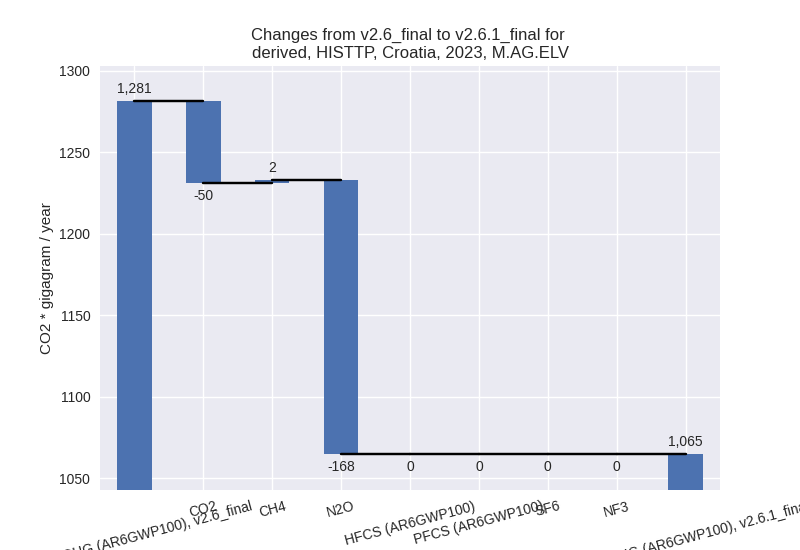
There is no subsector information available in PRIMAP-hist.
- 3.A: Total sectoral emissions in 2022 are 1420.33
Gg CO2 / year which is 56.6% of category M.AG emissions. 2023 Emissions
have changed by -6.0% (-88.27 Gg CO2
/ year). 1990-2023 Emissions have changed by -0.4% (-7.55 Gg CO2 / year). For 2023 the
changes per gas
are:
- 4: Total sectoral emissions in 2022 are 1294.60 Gg
CO2 / year which is 5.1% of M.0.EL emissions. 2023 Emissions have
changed by -7.4% (-98.52 Gg CO2 /
year). 1990-2023 Emissions have changed by -3.8% (-49.68 Gg CO2 / year). For 2023 the
changes per gas
are:

For 1990-2023 the changes per gas are:
- 5: Total sectoral emissions in 2022 are 69.77 Gg
CO2 / year which is 0.3% of M.0.EL emissions. 2023 Emissions have
changed by -3.4% (-2.36 Gg CO2 /
year). 1990-2023 Emissions have changed by -9.7% (-9.56 Gg CO2 / year). For 2023 the
changes per gas
are:

For 1990-2023 the changes per gas are: