Changes in PRIMAP-hist v2.6.1_final compared to v2.6_final for Haiti
2025-03-19
Johannes Gütschow
Change analysis for Haiti for PRIMAP-hist v2.6.1_final compared to v2.6_final
Overview over emissions by sector and gas
The following figures show the aggregate national total emissions excluding LULUCF AR6GWP100 for the country reported priority scenario. The dotted linesshow the v2.6_final data.
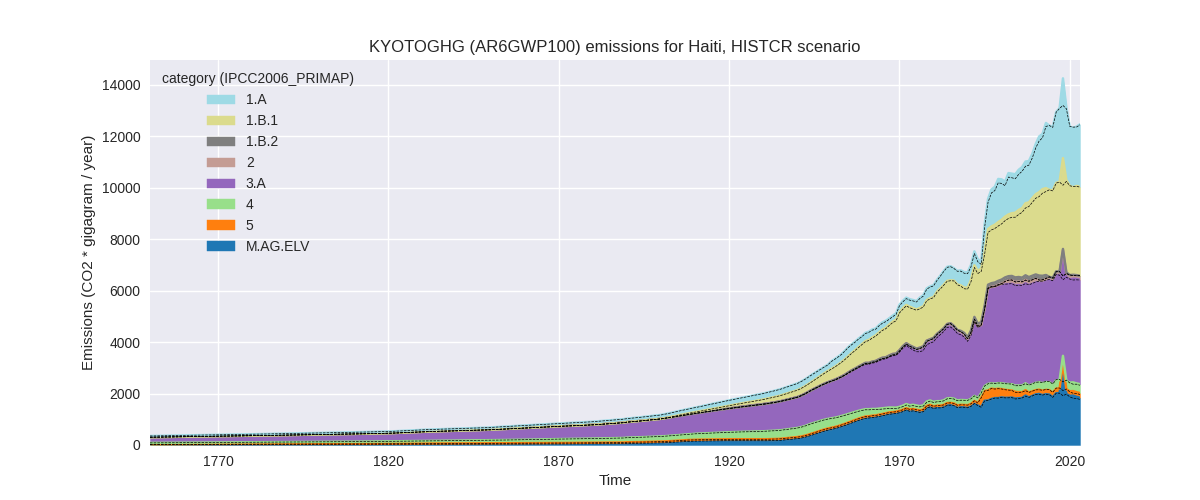
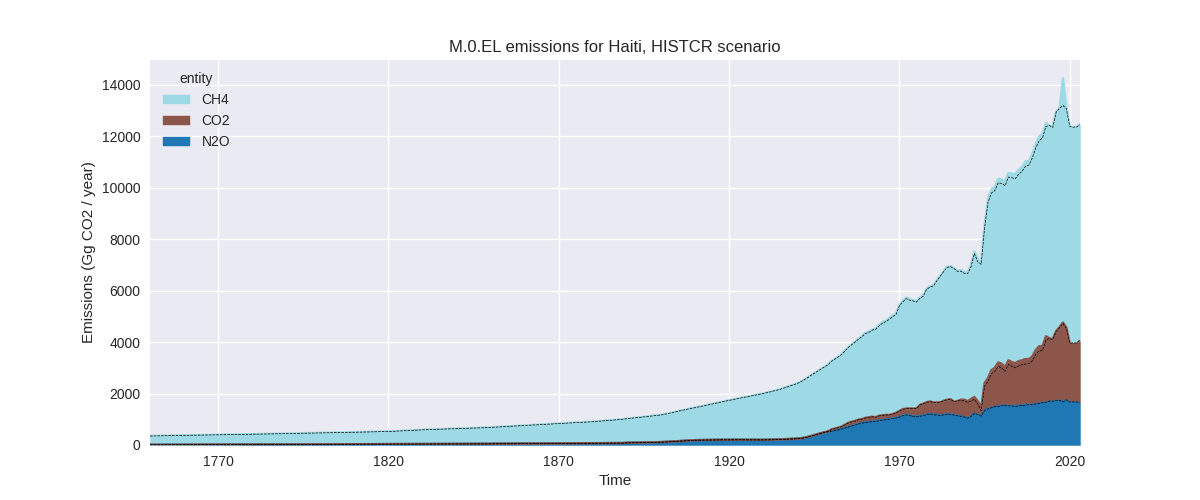
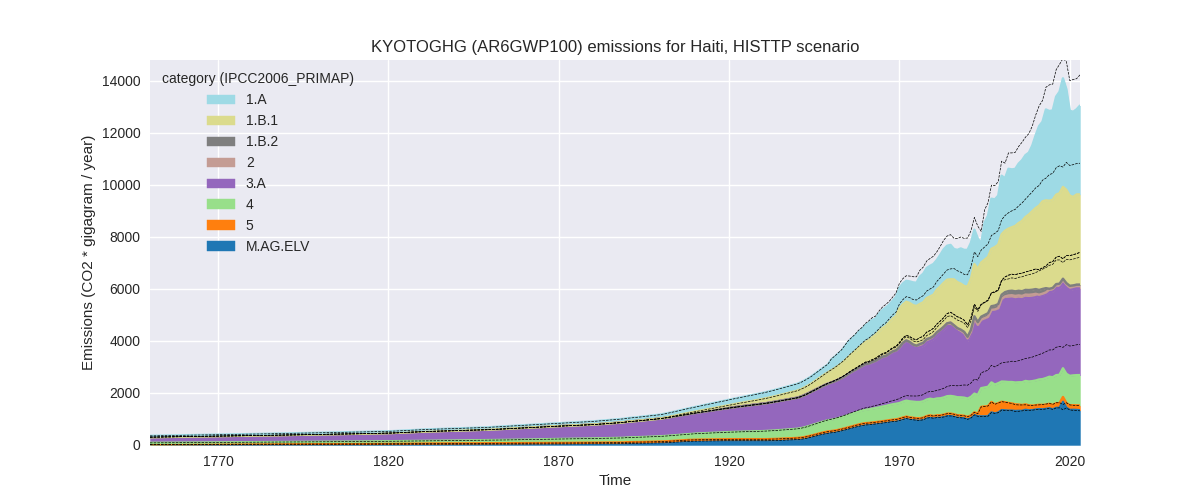
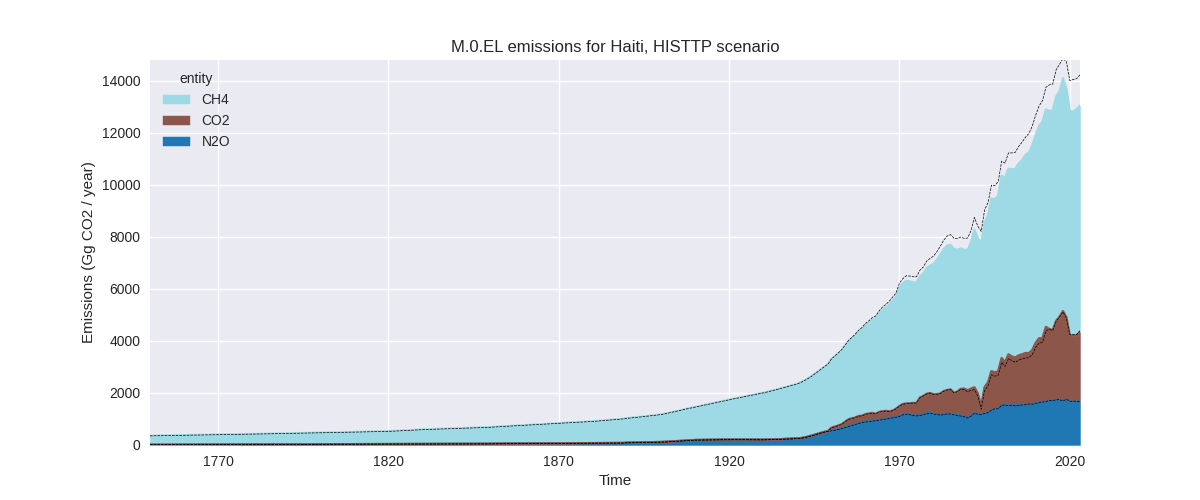
The following figures show the aggregate national total emissions excluding LULUCF AR6GWP100 for the third party priority scenario. The dotted linesshow the v2.6_final data.
Overview over changes
In the country reported priority scenario we have the following changes for aggregate Kyoto GHG and national total emissions excluding LULUCF (M.0.EL):
- Emissions in 2023 have changed by 0.2%% (22.33 Gg CO2 / year)
- Emissions in 1990-2023 have changed by 1.3%% (133.41 Gg CO2 / year)
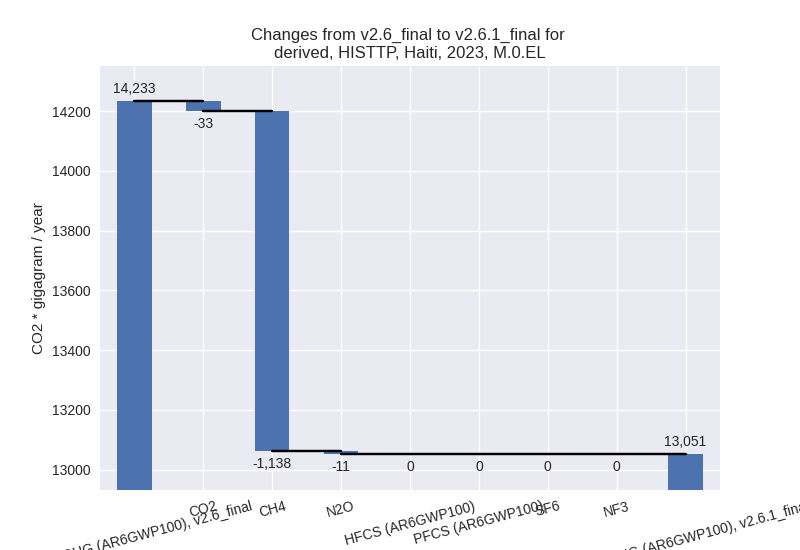
In the third party priority scenario we have the following changes for aggregate Kyoto GHG and national total emissions excluding LULUCF (M.0.EL):
- Emissions in 2023 have changed by -8.3%% (-1181.69 Gg CO2 / year)
- Emissions in 1990-2023 have changed by -6.3%% (-747.39 Gg CO2 / year)
Most important changes per scenario and time frame
In the country reported priority scenario the following sector-gas combinations have the highest absolute impact on national total KyotoGHG (AR6GWP100) emissions in 2023 (top 5):
- 1: M.AG.ELV, CH4 with 71.04 Gg CO2 / year (12.5%)
- 2: 2, CO2 with -45.52 Gg CO2 / year (-24.9%)
- 3: 1.B.1, CH4 with 41.94 Gg CO2 / year (1.2%)
- 4: 3.A, CH4 with -36.23 Gg CO2 / year (-0.9%)
- 5: 4, CH4 with -12.99 Gg CO2 / year (-4.4%)
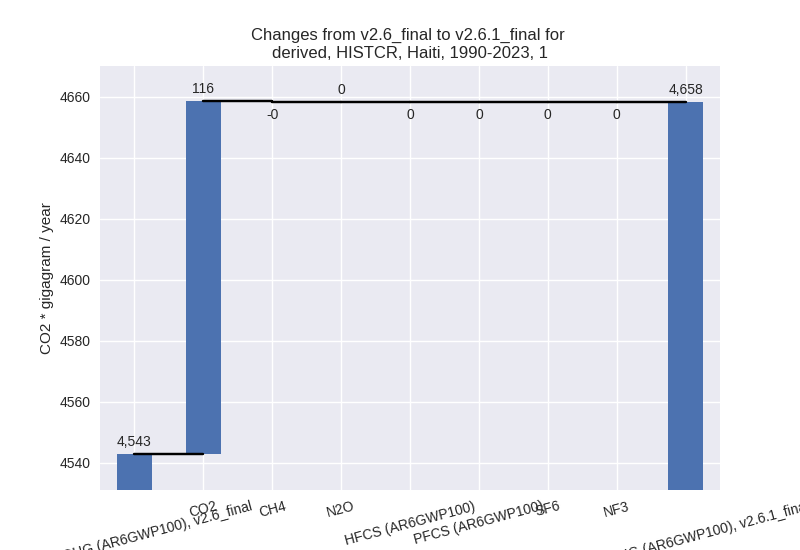
In the country reported priority scenario the following sector-gas combinations have the highest absolute impact on national total KyotoGHG (AR6GWP100) emissions in 1990-2023 (top 5):
- 1: 1.B.2, CO2 with 115.58 Gg CO2 / year (inf%)
- 2: M.AG.ELV, CH4 with 39.26 Gg CO2 / year (5.9%)
- 3: 5, N2O with -8.88 Gg CO2 / year (-5.9%)
- 4: 2, CO2 with -7.54 Gg CO2 / year (-7.4%)
- 5: 4, CH4 with -5.01 Gg CO2 / year (-2.3%)
In the third party priority scenario the following sector-gas combinations have the highest absolute impact on national total KyotoGHG (AR6GWP100) emissions in 2023 (top 5):
- 1: 4, CH4 with -1186.97 Gg CO2 / year (-52.3%)
- 2: 2, CO2 with -45.52 Gg CO2 / year (-24.9%)
- 3: 1.B.1, CH4 with 41.94 Gg CO2 / year (1.2%)
- 4: 3.A, CH4 with -29.41 Gg CO2 / year (-0.9%)
- 5: M.AG.ELV, CH4 with 20.45 Gg CO2 / year (12.5%)
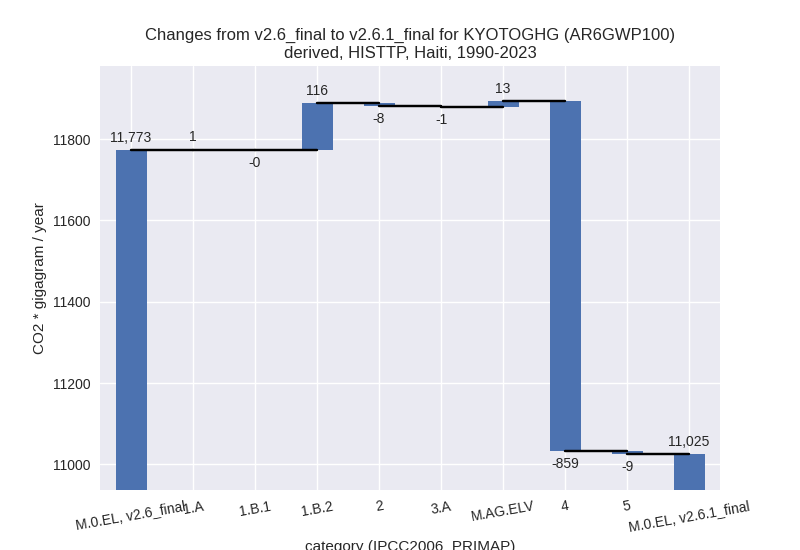
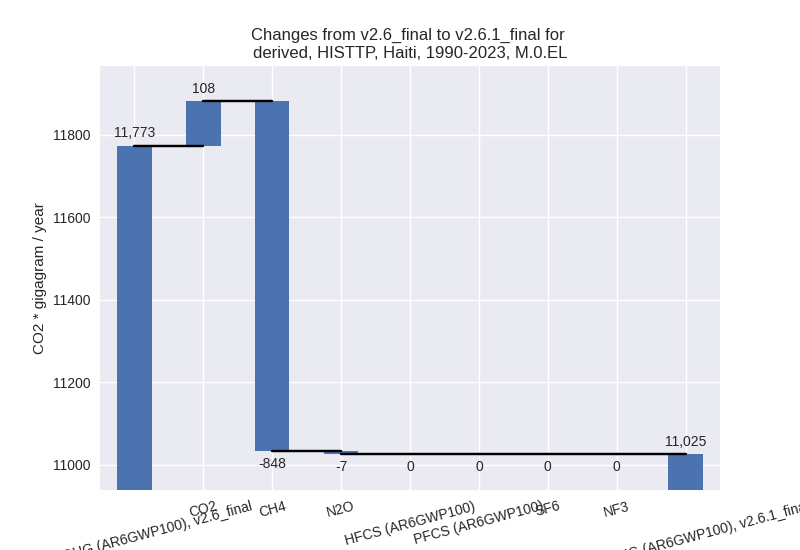
In the third party priority scenario the following sector-gas combinations have the highest absolute impact on national total KyotoGHG (AR6GWP100) emissions in 1990-2023 (top 5):
- 1: 4, CH4 with -858.57 Gg CO2 / year (-50.7%)
- 2: 1.B.2, CO2 with 115.58 Gg CO2 / year (inf%)
- 3: M.AG.ELV, CH4 with 11.30 Gg CO2 / year (5.7%)
- 4: 5, N2O with -8.88 Gg CO2 / year (-5.9%)
- 5: 2, CO2 with -7.54 Gg CO2 / year (-7.4%)
Notes on data changes
Here we list notes explaining important emissions changes for the country.
- No new country reported data has been included. Changes in the CR
time-series come from updated third party data (EDGAR, FAO) which is
used to extrapolate the country reported data. This also affects
cumulative emissions as country reported data only overs a few years.
- Changes are mostly in the agricultural sectors, where FAO data has been updated and fugitive emissions where the updated EDGAR data is the only data source.
- Total emissions changes are very small in the CR scenario because different sectoral changes cancel.
- Changes in the TP scenario are larger as the waste sector has high changes in EDGAR data.
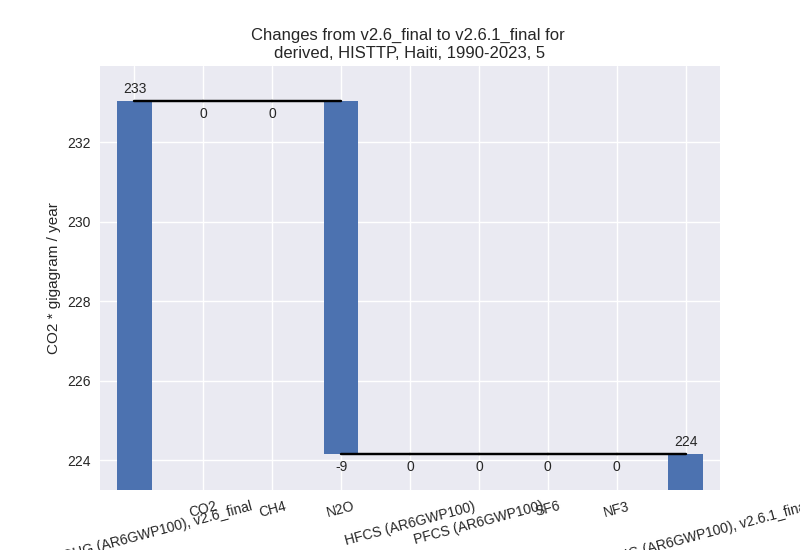
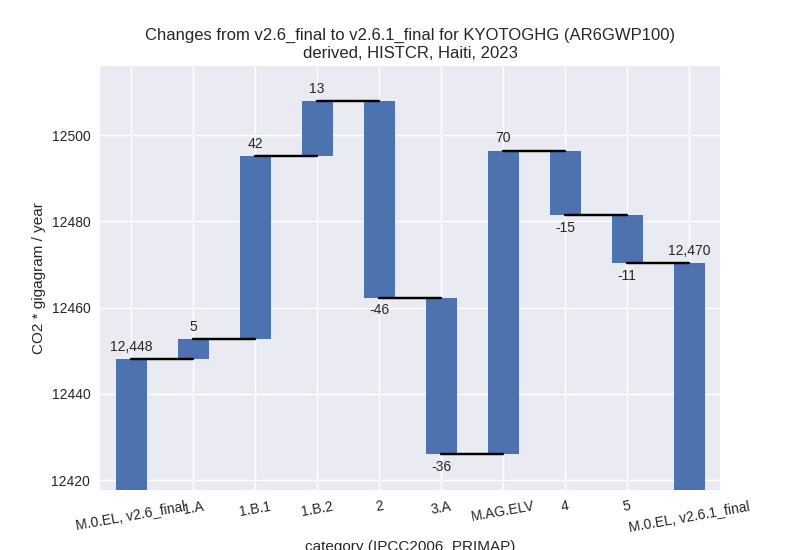
Changes by sector and gas
For each scenario and time frame the changes are displayed for all individual sectors and all individual gases. In the sector plot we use aggregate Kyoto GHGs in AR6GWP100. In the gas plot we usenational total emissions without LULUCF.
country reported scenario
2023
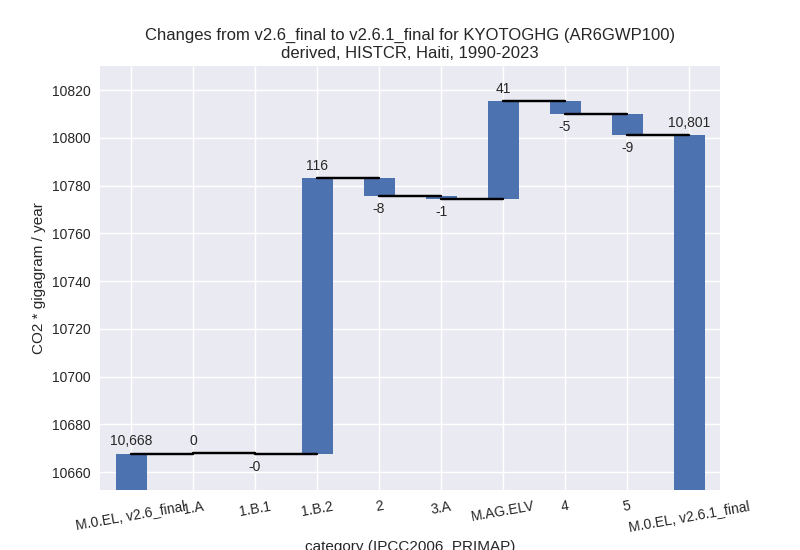
1990-2023
third party scenario
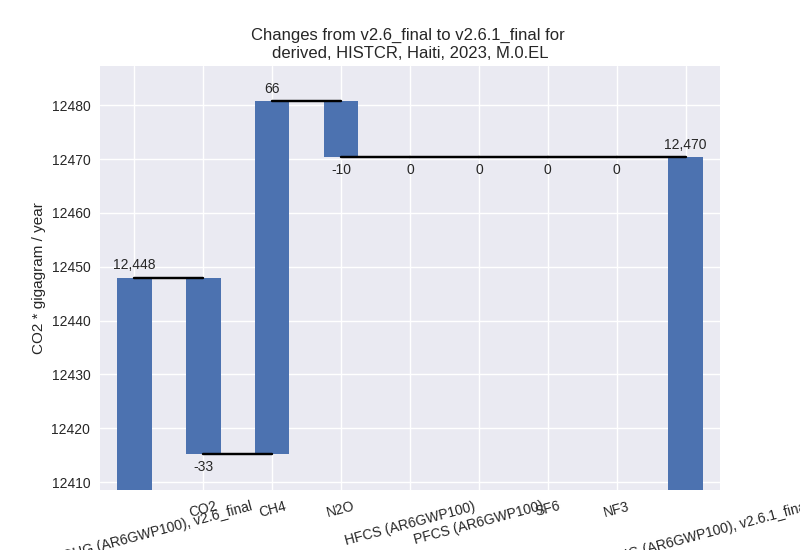
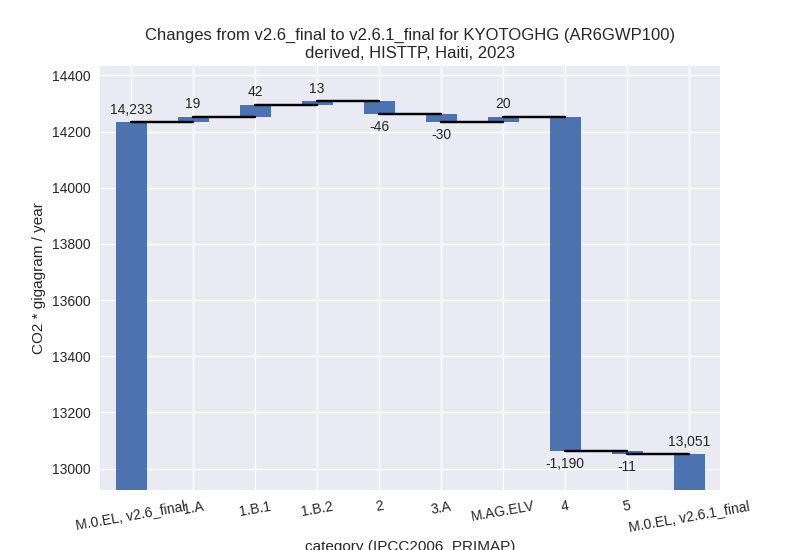
2023
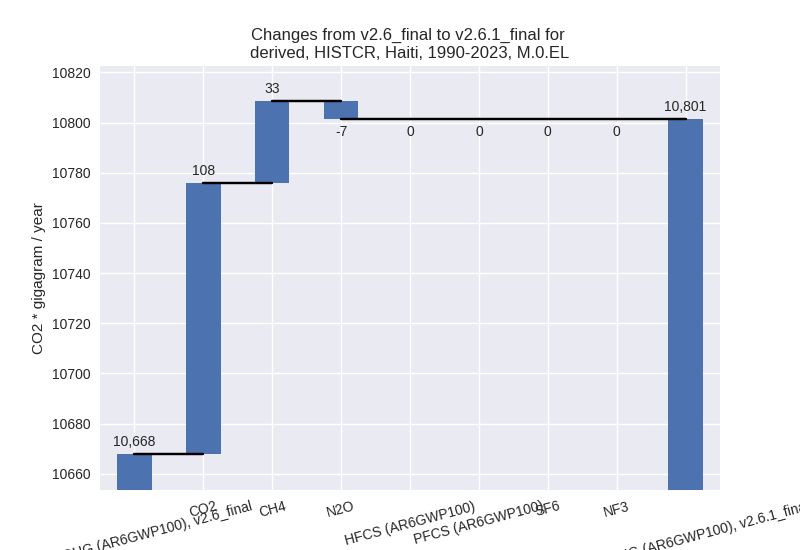
1990-2023
Detailed changes for the scenarios:
country reported scenario (HISTCR):
Most important changes per time frame
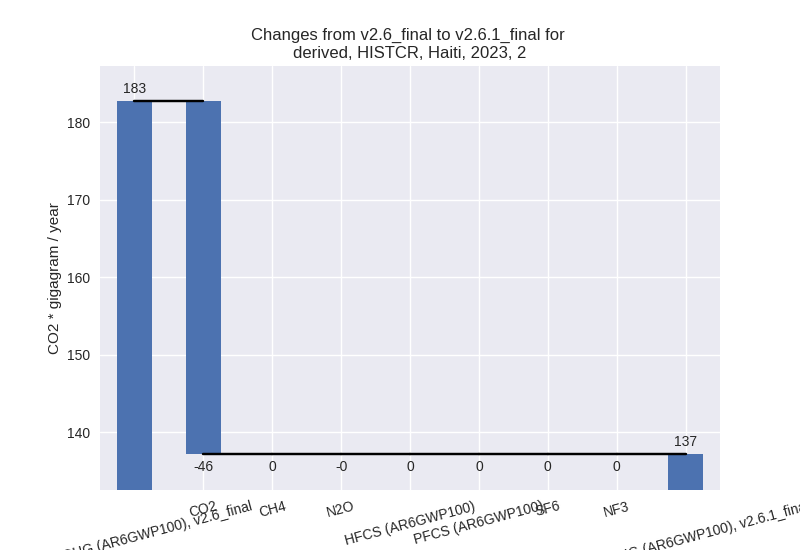
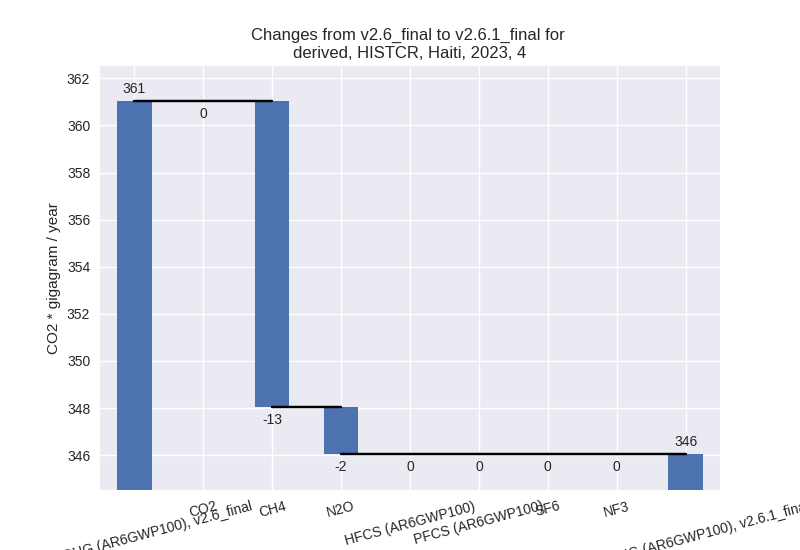
For 2023 the following sector-gas combinations have the highest absolute impact on national total KyotoGHG (AR6GWP100) emissions in 2023 (top 5):
- 1: M.AG.ELV, CH4 with 71.04 Gg CO2 / year (12.5%)
- 2: 2, CO2 with -45.52 Gg CO2 / year (-24.9%)
- 3: 1.B.1, CH4 with 41.94 Gg CO2 / year (1.2%)
- 4: 3.A, CH4 with -36.23 Gg CO2 / year (-0.9%)
- 5: 4, CH4 with -12.99 Gg CO2 / year (-4.4%)
For 1990-2023 the following sector-gas combinations have the highest absolute impact on national total KyotoGHG (AR6GWP100) emissions in 1990-2023 (top 5):
- 1: 1.B.2, CO2 with 115.58 Gg CO2 / year (inf%)
- 2: M.AG.ELV, CH4 with 39.26 Gg CO2 / year (5.9%)
- 3: 5, N2O with -8.88 Gg CO2 / year (-5.9%)
- 4: 2, CO2 with -7.54 Gg CO2 / year (-7.4%)
- 5: 4, CH4 with -5.01 Gg CO2 / year (-2.3%)
Changes in the main sectors for aggregate KyotoGHG (AR6GWP100) are
- 1: Total sectoral emissions in 2022 are 5785.32 Gg
CO2 / year which is 46.7% of M.0.EL emissions. 2023 Emissions have
changed by 1.0% (59.89 Gg CO2 /
year). 1990-2023 Emissions have changed by 2.5% (115.33 Gg CO2 / year). For 1990-2023
the changes per gas
are:
The changes come from the following subsectors:- 1.A: Total sectoral emissions in 2022 are 2304.92 Gg CO2 / year which is 39.8% of category 1 emissions. 2023 Emissions have changed by 0.2% (4.69 Gg CO2 / year). 1990-2023 Emissions have changed by 0.0% (0.21 Gg CO2 / year).
- 1.B.1: Total sectoral emissions in 2022 are 3468.48 Gg CO2 / year which is 60.0% of category 1 emissions. 2023 Emissions have changed by 1.2% (42.50 Gg CO2 / year). 1990-2023 Emissions have changed by -0.0% (-0.46 Gg CO2 / year).
- 1.B.2: Total sectoral emissions in 2022 are 11.93
Gg CO2 / year which is 0.2% of category 1 emissions. 2023 Emissions have
changed by 3751.1% (12.70 Gg CO2 /
year). 1990-2023 Emissions have changed by 98517.8% (115.58 Gg CO2 / year). For 2023
the changes per gas
are:

For 1990-2023 the changes per gas are: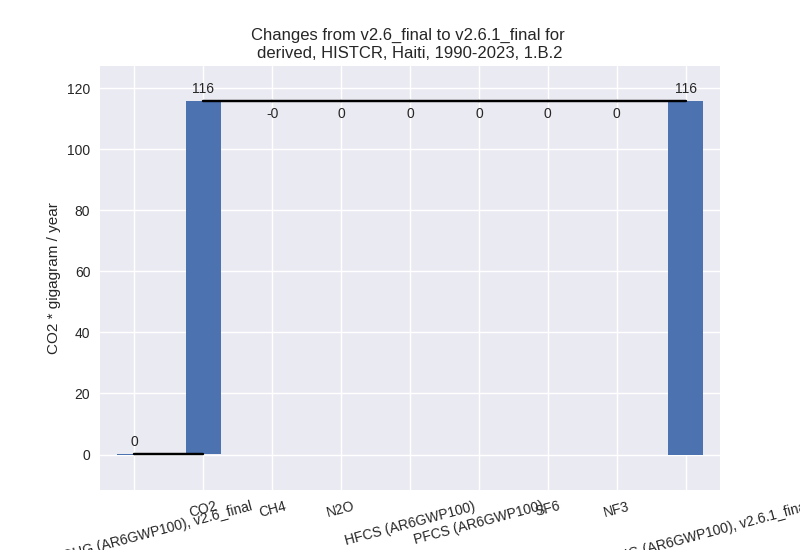
There is no subsector information available in PRIMAP-hist.
- 2: Total sectoral emissions in 2022 are 135.98 Gg
CO2 / year which is 1.1% of M.0.EL emissions. 2023 Emissions have
changed by -24.9% (-45.52 Gg CO2 /
year). 1990-2023 Emissions have changed by -7.4% (-7.54 Gg CO2 / year). For 2023 the
changes per gas
are:
For 1990-2023 the changes per gas are:
- M.AG: Total sectoral emissions in 2022 are 5934.71 Gg CO2 / year which is 47.9% of M.0.EL emissions. 2023 Emissions have changed by 0.6% (34.07 Gg CO2 / year). 1990-2023 Emissions have changed by 0.7% (39.73 Gg CO2 / year).
- 4: Total sectoral emissions in 2022 are 342.64 Gg
CO2 / year which is 2.8% of M.0.EL emissions. 2023 Emissions have
changed by -4.2% (-14.99 Gg CO2 /
year). 1990-2023 Emissions have changed by -1.9% (-5.23 Gg CO2 / year). For 2023 the
changes per gas
are:
- 5: Total sectoral emissions in 2022 are 179.52 Gg
CO2 / year which is 1.5% of M.0.EL emissions. 2023 Emissions have
changed by -5.8% (-11.12 Gg CO2 /
year). 1990-2023 Emissions have changed by -3.8% (-8.88 Gg CO2 / year). For 2023 the
changes per gas
are:

For 1990-2023 the changes per gas are:
third party scenario (HISTTP):
Most important changes per time frame
For 2023 the following sector-gas combinations have the highest absolute impact on national total KyotoGHG (AR6GWP100) emissions in 2023 (top 5):
- 1: 4, CH4 with -1186.97 Gg CO2 / year (-52.3%)
- 2: 2, CO2 with -45.52 Gg CO2 / year (-24.9%)
- 3: 1.B.1, CH4 with 41.94 Gg CO2 / year (1.2%)
- 4: 3.A, CH4 with -29.41 Gg CO2 / year (-0.9%)
- 5: M.AG.ELV, CH4 with 20.45 Gg CO2 / year (12.5%)
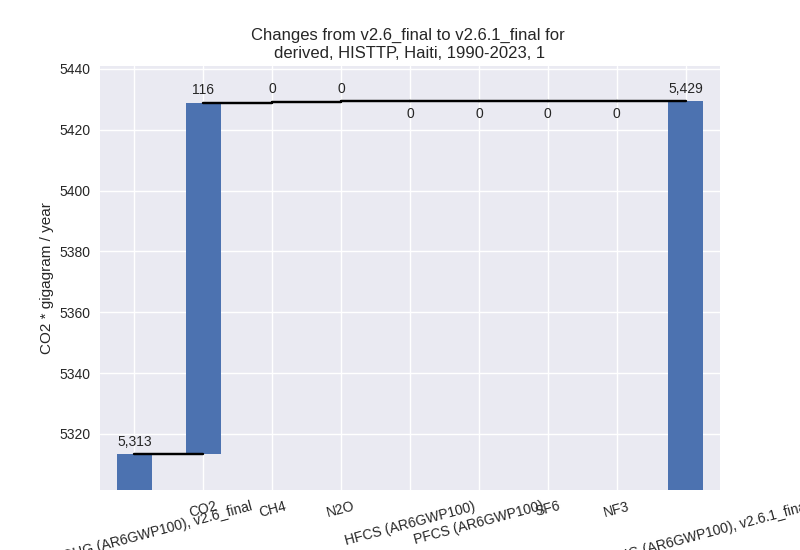
For 1990-2023 the following sector-gas combinations have the highest absolute impact on national total KyotoGHG (AR6GWP100) emissions in 1990-2023 (top 5):
- 1: 4, CH4 with -858.57 Gg CO2 / year (-50.7%)
- 2: 1.B.2, CO2 with 115.58 Gg CO2 / year (inf%)
- 3: M.AG.ELV, CH4 with 11.30 Gg CO2 / year (5.7%)
- 4: 5, N2O with -8.88 Gg CO2 / year (-5.9%)
- 5: 2, CO2 with -7.54 Gg CO2 / year (-7.4%)
Changes in the main sectors for aggregate KyotoGHG (AR6GWP100) are
- 1: Total sectoral emissions in 2022 are 6753.83 Gg
CO2 / year which is 52.3% of M.0.EL emissions. 2023 Emissions have
changed by 1.1% (74.51 Gg CO2 /
year). 1990-2023 Emissions have changed by 2.2% (116.00 Gg CO2 / year). For 1990-2023
the changes per gas
are:
The changes come from the following subsectors:- 1.A: Total sectoral emissions in 2022 are 3273.42 Gg CO2 / year which is 48.5% of category 1 emissions. 2023 Emissions have changed by 0.6% (19.31 Gg CO2 / year). 1990-2023 Emissions have changed by 0.0% (0.88 Gg CO2 / year).
- 1.B.1: Total sectoral emissions in 2022 are 3468.48 Gg CO2 / year which is 51.4% of category 1 emissions. 2023 Emissions have changed by 1.2% (42.50 Gg CO2 / year). 1990-2023 Emissions have changed by -0.0% (-0.46 Gg CO2 / year).
- 1.B.2: Total sectoral emissions in 2022 are 11.93
Gg CO2 / year which is 0.2% of category 1 emissions. 2023 Emissions have
changed by 3751.1% (12.70 Gg CO2 /
year). 1990-2023 Emissions have changed by 98517.8% (115.58 Gg CO2 / year). For 2023
the changes per gas
are:
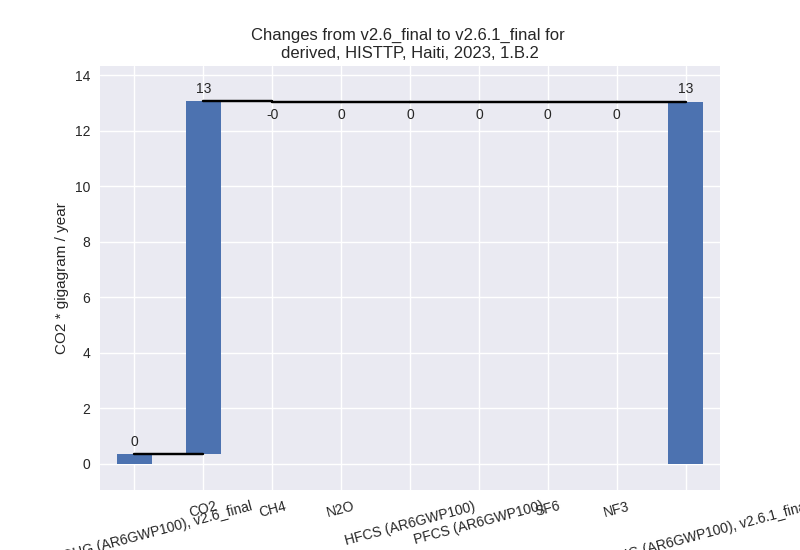
For 1990-2023 the changes per gas are:
There is no subsector information available in PRIMAP-hist.
- 2: Total sectoral emissions in 2022 are 135.98 Gg
CO2 / year which is 1.1% of M.0.EL emissions. 2023 Emissions have
changed by -24.9% (-45.52 Gg CO2 /
year). 1990-2023 Emissions have changed by -7.4% (-7.54 Gg CO2 / year). For 2023 the
changes per gas
are:

For 1990-2023 the changes per gas are:
- M.AG: Total sectoral emissions in 2022 are 4679.69 Gg CO2 / year which is 36.3% of M.0.EL emissions. 2023 Emissions have changed by -0.2% (-9.75 Gg CO2 / year). 1990-2023 Emissions have changed by 0.3% (11.91 Gg CO2 / year).
- 4: Total sectoral emissions in 2022 are 1159.46 Gg
CO2 / year which is 9.0% of M.0.EL emissions. 2023 Emissions have
changed by -50.4% (-1189.80 Gg CO2 /
year). 1990-2023 Emissions have changed by -48.6% (-858.87 Gg CO2 / year). For 2023
the changes per gas
are:

For 1990-2023 the changes per gas are: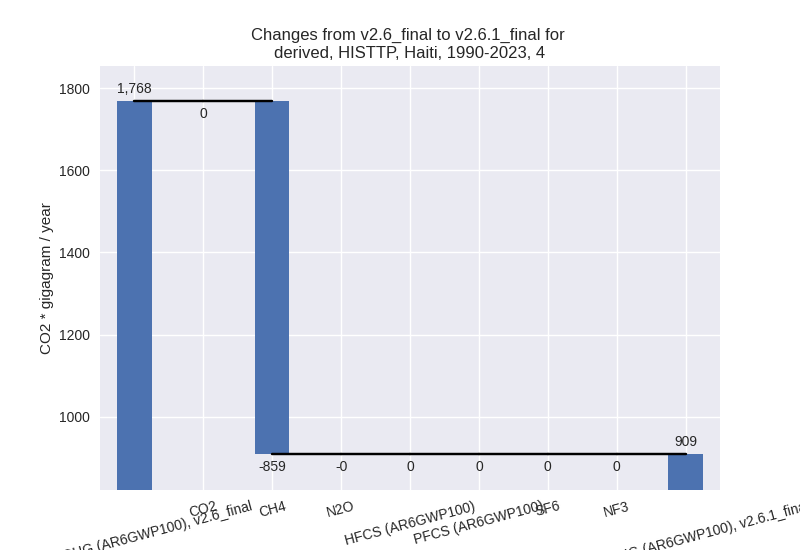
- 5: Total sectoral emissions in 2022 are 179.52 Gg
CO2 / year which is 1.4% of M.0.EL emissions. 2023 Emissions have
changed by -5.8% (-11.12 Gg CO2 /
year). 1990-2023 Emissions have changed by -3.8% (-8.88 Gg CO2 / year). For 2023 the
changes per gas
are:

For 1990-2023 the changes per gas are: