Changes in PRIMAP-hist v2.6.1_final compared to v2.6_final for Ireland
2025-03-19
Johannes Gütschow
Change analysis for Ireland for PRIMAP-hist v2.6.1_final compared to v2.6_final
Overview over emissions by sector and gas
The following figures show the aggregate national total emissions excluding LULUCF AR6GWP100 for the country reported priority scenario. The dotted linesshow the v2.6_final data.
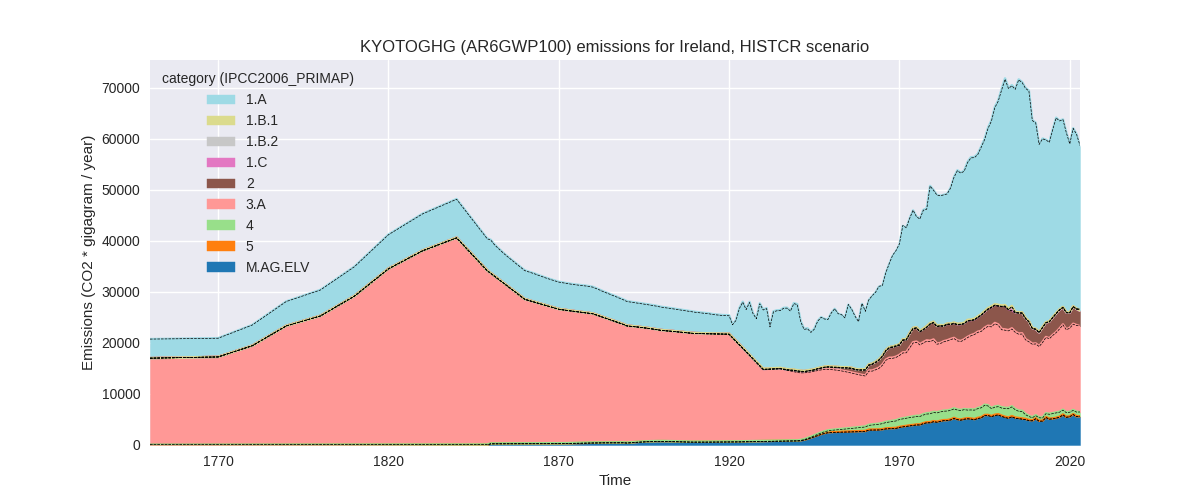
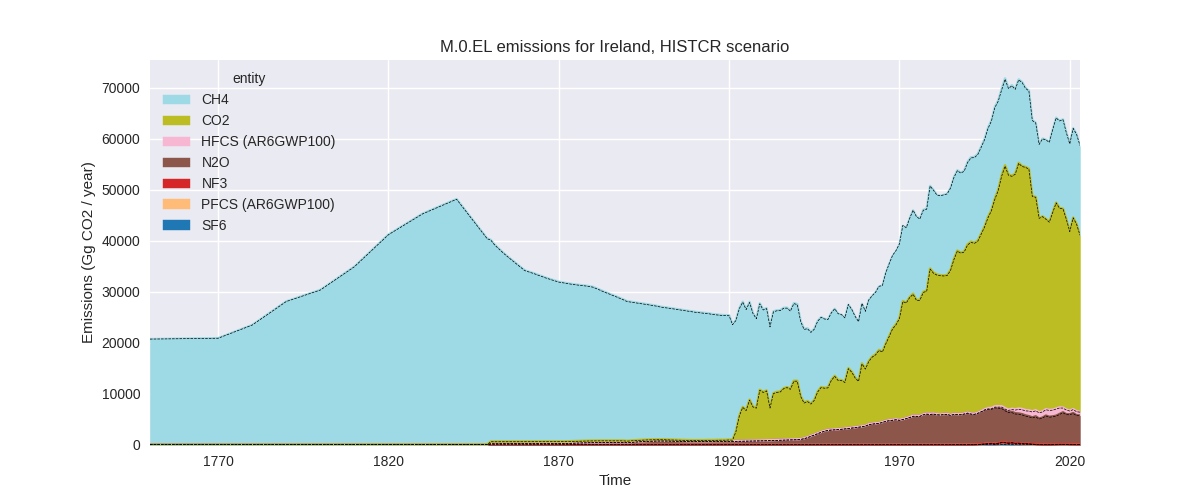
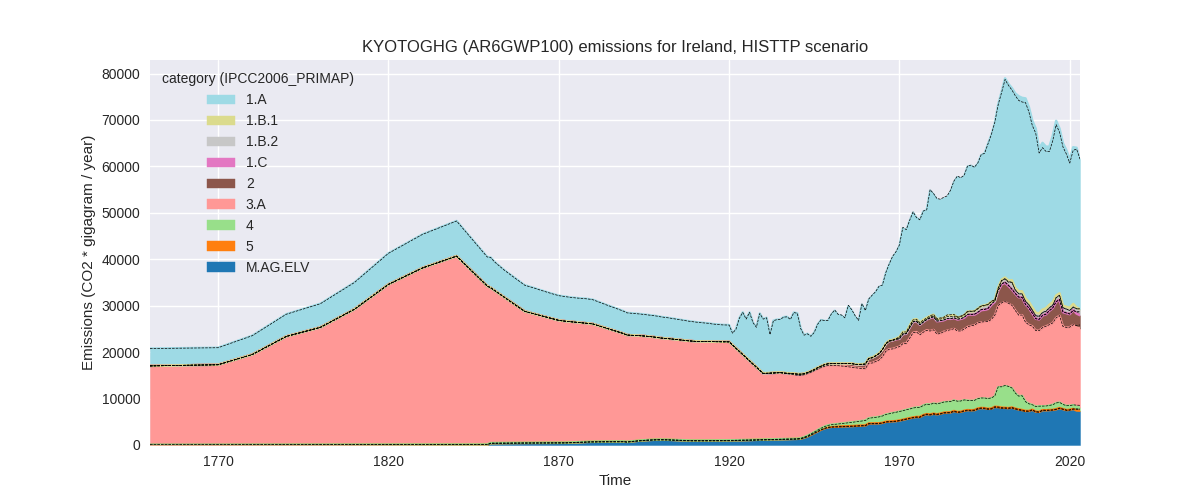
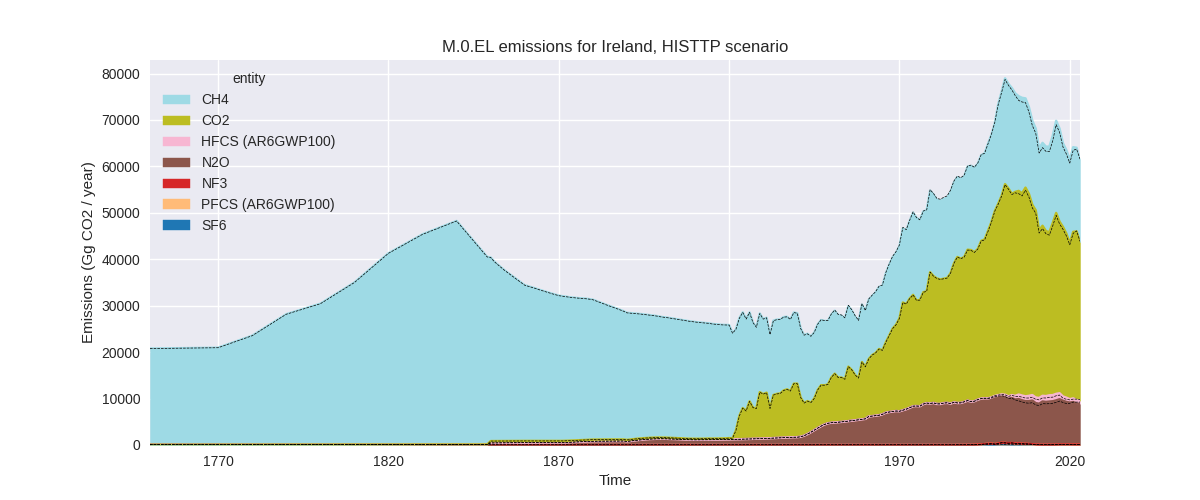
The following figures show the aggregate national total emissions excluding LULUCF AR6GWP100 for the third party priority scenario. The dotted linesshow the v2.6_final data.
Overview over changes
In the country reported priority scenario we have the following changes for aggregate Kyoto GHG and national total emissions excluding LULUCF (M.0.EL):
- Emissions in 2023 have changed by -0.5%% (-319.25 Gg CO2 / year)
- Emissions in 1990-2023 have changed by 0.1%% (83.16 Gg CO2 / year)
In the third party priority scenario we have the following changes for aggregate Kyoto GHG and national total emissions excluding LULUCF (M.0.EL):
- Emissions in 2023 have changed by -0.2%% (-108.53 Gg CO2 / year)
- Emissions in 1990-2023 have changed by 0.7%% (485.78 Gg CO2 / year)
Most important changes per scenario and time frame
In the country reported priority scenario the following sector-gas combinations have the highest absolute impact on national total KyotoGHG (AR6GWP100) emissions in 2023 (top 5):
- 1: 2, CO2 with -172.66 Gg CO2 / year (-7.5%)
- 2: 3.A, CH4 with -108.51 Gg CO2 / year (-0.7%)
- 3: 5, N2O with 72.62 Gg CO2 / year (inf%)
- 4: M.AG.ELV, N2O with -55.42 Gg CO2 / year (-1.1%)
- 5: 4, CH4 with -44.08 Gg CO2 / year (-6.6%)
In the country reported priority scenario the following sector-gas combinations have the highest absolute impact on national total KyotoGHG (AR6GWP100) emissions in 1990-2023 (top 5):
- 1: 5, N2O with 116.04 Gg CO2 / year (inf%)
- 2: 2, CO2 with -36.26 Gg CO2 / year (-1.6%)
- 3: 2, HFCS (AR6GWP100) with 7.10 Gg CO2 / year (1.0%)
- 4: 2, PFCS (AR6GWP100) with 3.43 Gg CO2 / year (3.2%)
- 5: 3.A, CH4 with -3.19 Gg CO2 / year (-0.0%)
In the third party priority scenario the following sector-gas combinations have the highest absolute impact on national total KyotoGHG (AR6GWP100) emissions in 2023 (top 5):
- 1: 1.B.2, CH4 with 491.36 Gg CO2 / year (81.3%)
- 2: M.AG.ELV, N2O with -372.76 Gg CO2 / year (-5.0%)
- 3: 3.A, CH4 with -269.75 Gg CO2 / year (-1.7%)
- 4: 2, HFCS (AR6GWP100) with 162.74 Gg CO2 / year (30.8%)
- 5: 2, CO2 with -134.27 Gg CO2 / year (-6.3%)
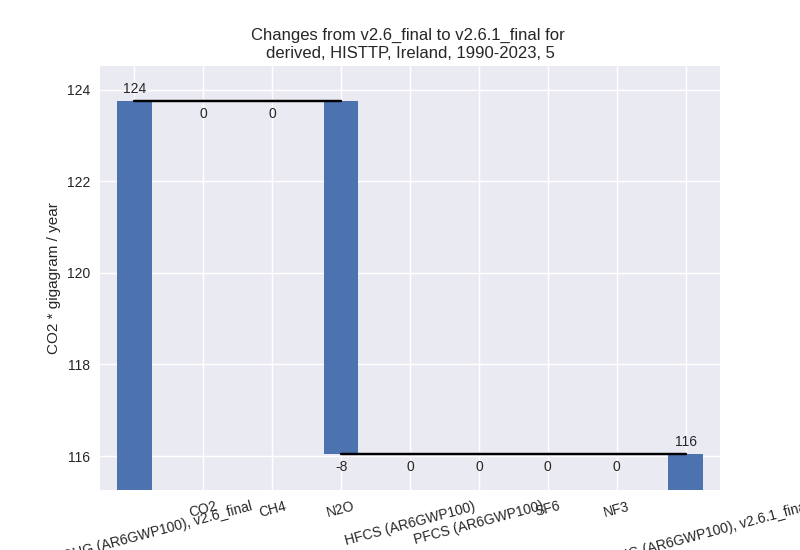
In the third party priority scenario the following sector-gas combinations have the highest absolute impact on national total KyotoGHG (AR6GWP100) emissions in 1990-2023 (top 5):
- 1: 1.B.2, CH4 with 200.28 Gg CO2 / year (29.1%)
- 2: 1.A, N2O with 194.48 Gg CO2 / year (74.9%)
- 3: 1.B.2, CO2 with 134.20 Gg CO2 / year (5143765.9%)
- 4: 1.B.1, CH4 with 56.23 Gg CO2 / year (10910.0%)
- 5: 4, CH4 with -50.47 Gg CO2 / year (-2.6%)
Notes on data changes
Here we list notes explaining important emissions changes for the country.
- CRT data has been included but replaces official data reported to the EU which does not show noteworthy differences. Chnages in the CR time-series are very small.
- Changes in the TP time-series come from updated EDGAR and FAO data. FAO has adjusted data for the latest years while EDGAR has updated full time-series with the main changes coming from fugitive emissions and N2O in the energy sector. The influence on total emissions is small.
Changes by sector and gas
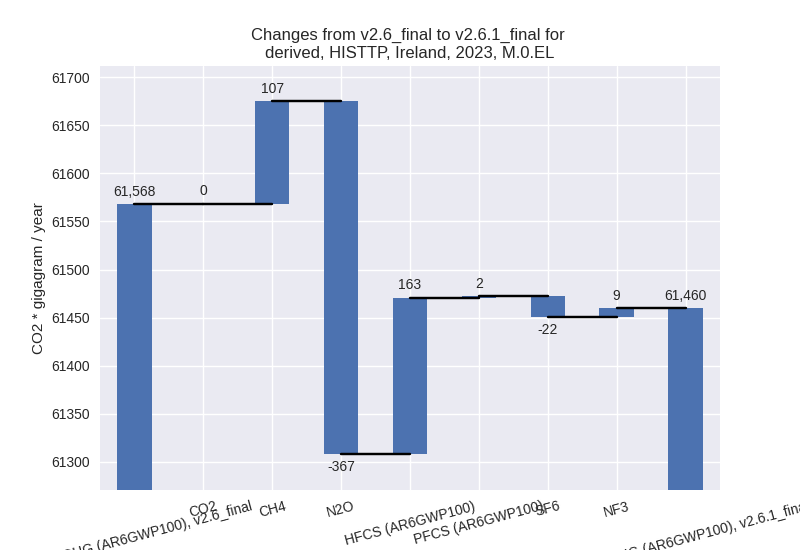
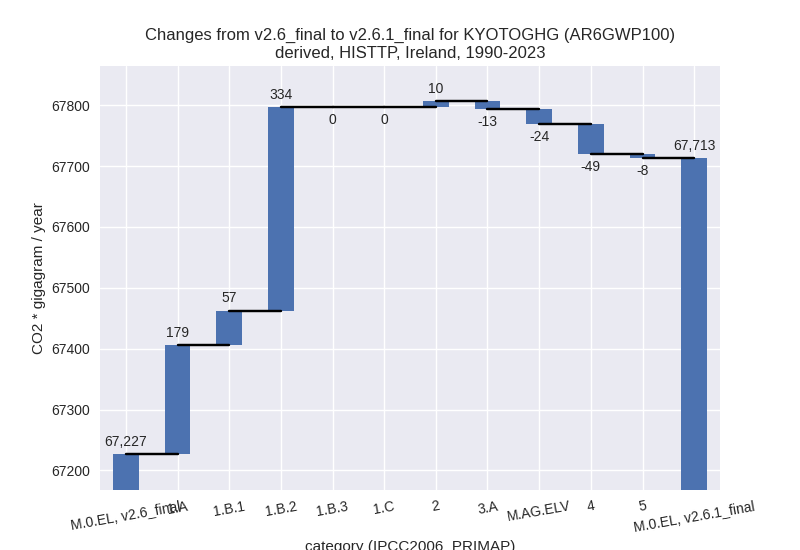
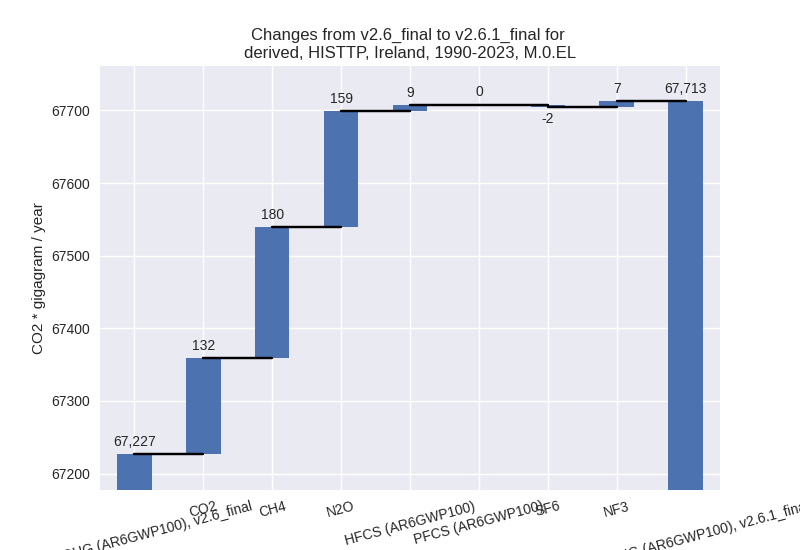
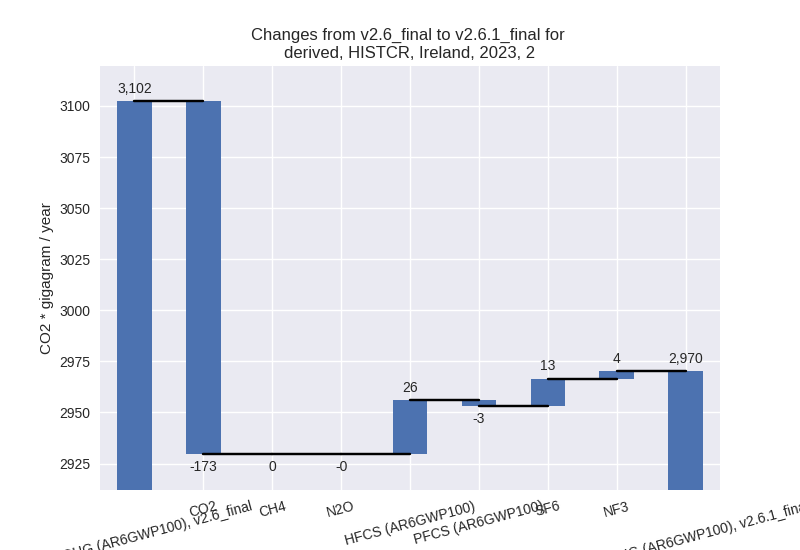
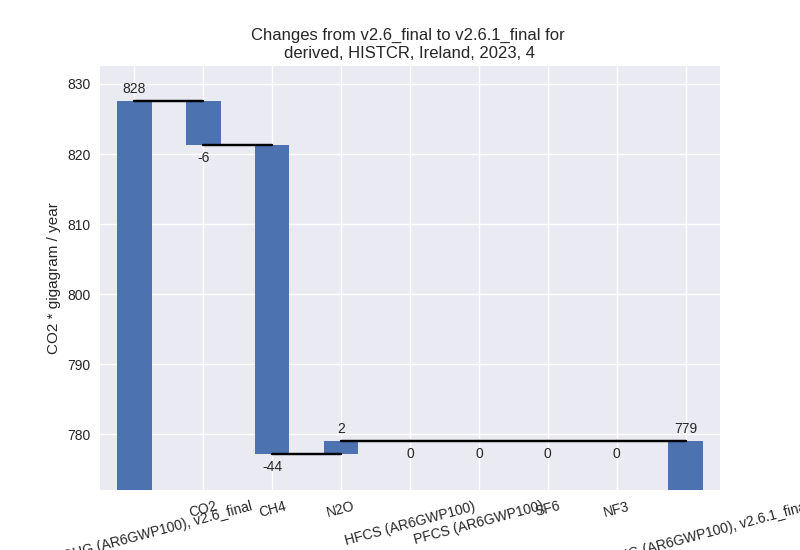
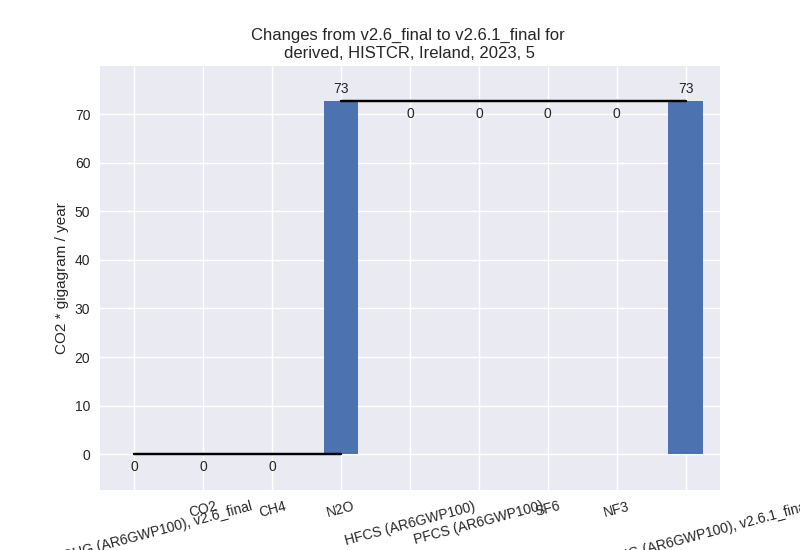
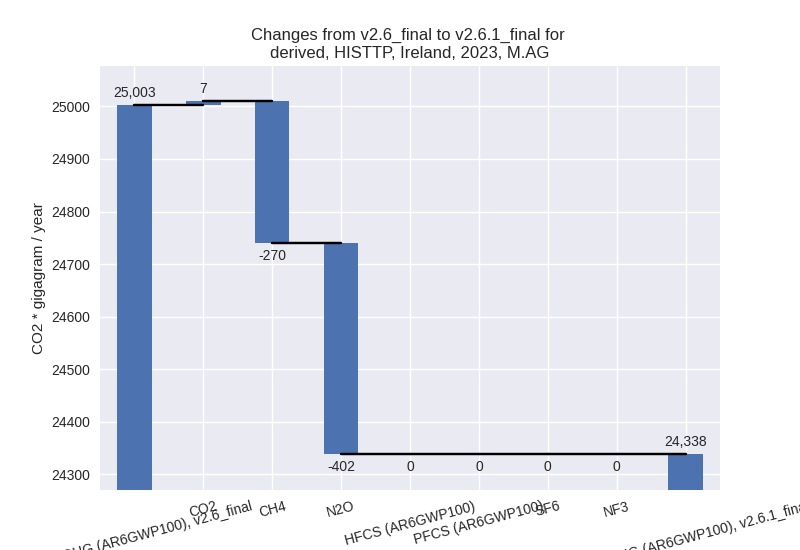
For each scenario and time frame the changes are displayed for all individual sectors and all individual gases. In the sector plot we use aggregate Kyoto GHGs in AR6GWP100. In the gas plot we usenational total emissions without LULUCF.
country reported scenario
2023
1990-2023
third party scenario
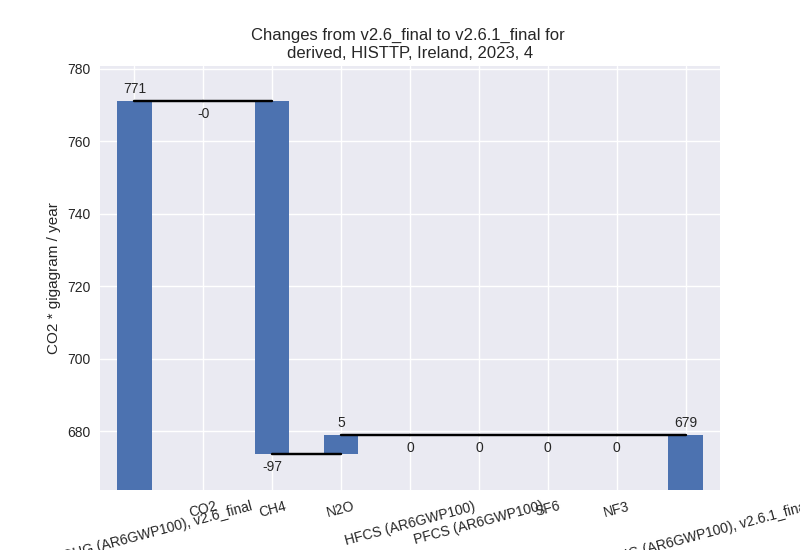
2023
1990-2023
Detailed changes for the scenarios:
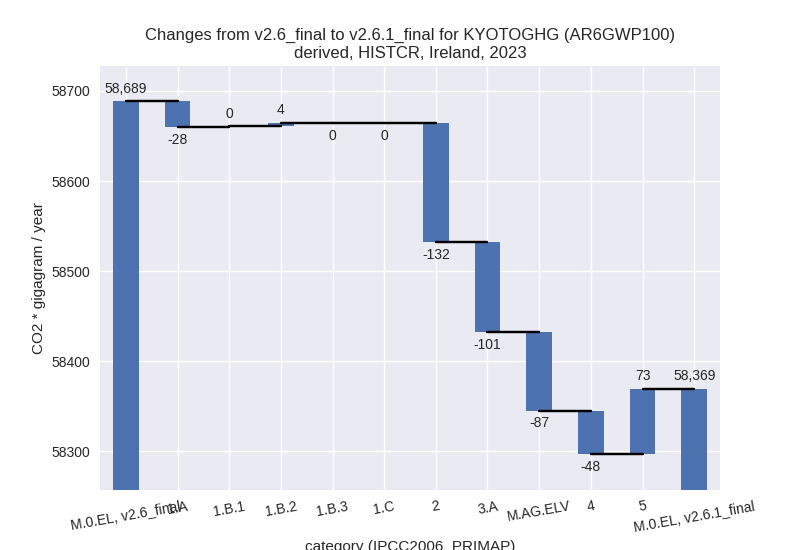
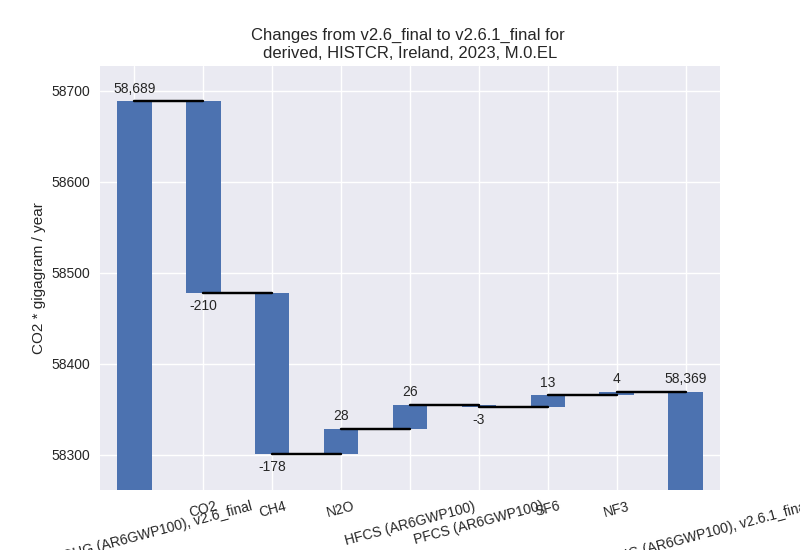
country reported scenario (HISTCR):
Most important changes per time frame
For 2023 the following sector-gas combinations have the highest absolute impact on national total KyotoGHG (AR6GWP100) emissions in 2023 (top 5):
- 1: 2, CO2 with -172.66 Gg CO2 / year (-7.5%)
- 2: 3.A, CH4 with -108.51 Gg CO2 / year (-0.7%)
- 3: 5, N2O with 72.62 Gg CO2 / year (inf%)
- 4: M.AG.ELV, N2O with -55.42 Gg CO2 / year (-1.1%)
- 5: 4, CH4 with -44.08 Gg CO2 / year (-6.6%)
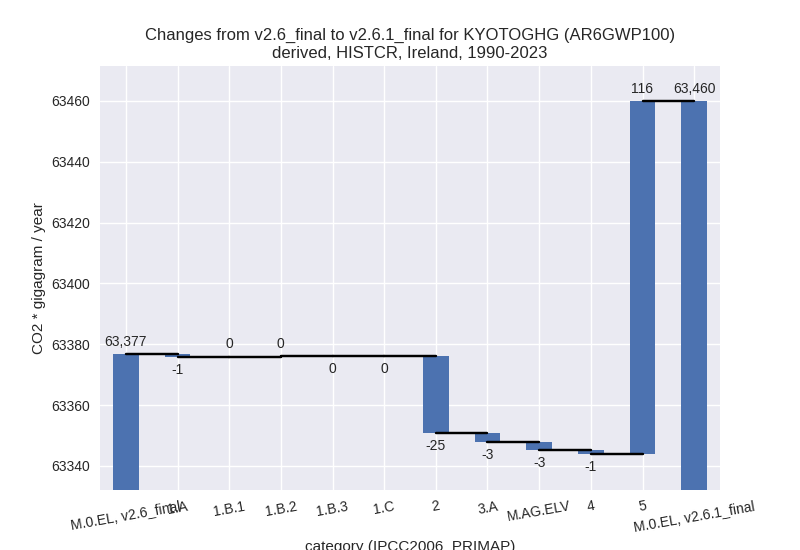
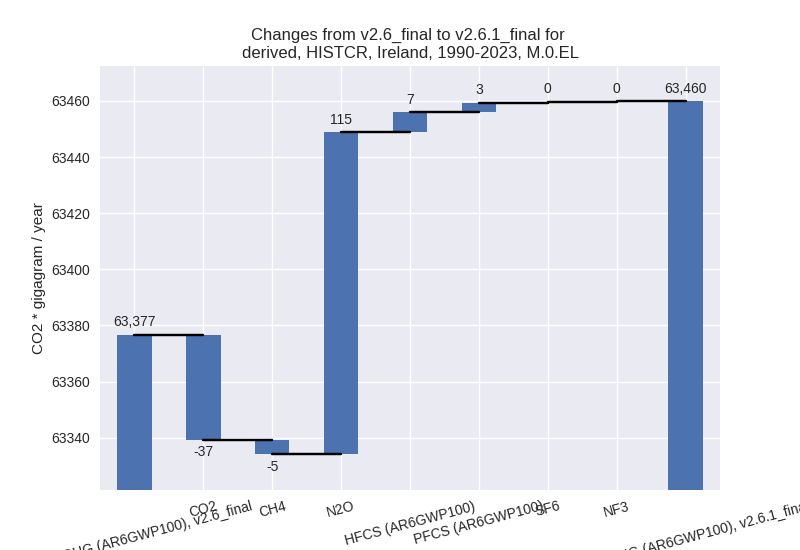
For 1990-2023 the following sector-gas combinations have the highest absolute impact on national total KyotoGHG (AR6GWP100) emissions in 1990-2023 (top 5):
- 1: 5, N2O with 116.04 Gg CO2 / year (inf%)
- 2: 2, CO2 with -36.26 Gg CO2 / year (-1.6%)
- 3: 2, HFCS (AR6GWP100) with 7.10 Gg CO2 / year (1.0%)
- 4: 2, PFCS (AR6GWP100) with 3.43 Gg CO2 / year (3.2%)
- 5: 3.A, CH4 with -3.19 Gg CO2 / year (-0.0%)
Changes in the main sectors for aggregate KyotoGHG (AR6GWP100) are
- 1: Total sectoral emissions in 2022 are 34269.98 Gg CO2 / year which is 56.3% of M.0.EL emissions. 2023 Emissions have changed by -0.1% (-24.04 Gg CO2 / year). 1990-2023 Emissions have changed by -0.0% (-0.71 Gg CO2 / year).
- 2: Total sectoral emissions in 2022 are 3154.12 Gg
CO2 / year which is 5.2% of M.0.EL emissions. 2023 Emissions have
changed by -4.3% (-132.04 Gg CO2 /
year). 1990-2023 Emissions have changed by -0.7% (-25.23 Gg CO2 / year). For 2023 the
changes per gas
are:
- M.AG: Total sectoral emissions in 2022 are 22528.48 Gg CO2 / year which is 37.0% of M.0.EL emissions. 2023 Emissions have changed by -0.8% (-187.32 Gg CO2 / year). 1990-2023 Emissions have changed by -0.0% (-5.51 Gg CO2 / year).
- 4: Total sectoral emissions in 2022 are 878.73 Gg
CO2 / year which is 1.4% of M.0.EL emissions. 2023 Emissions have
changed by -5.9% (-48.47 Gg CO2 /
year). 1990-2023 Emissions have changed by -0.1% (-1.43 Gg CO2 / year). For 2023 the
changes per gas
are:
- 5: Total sectoral emissions in 2022 are 78.20 Gg
CO2 / year which is 0.1% of M.0.EL emissions. 2023 Emissions have
changed by inf% (72.62 Gg CO2 /
year). 1990-2023 Emissions have changed by inf% (116.04 Gg CO2 / year). For 2023 the
changes per gas
are:
For 1990-2023 the changes per gas are: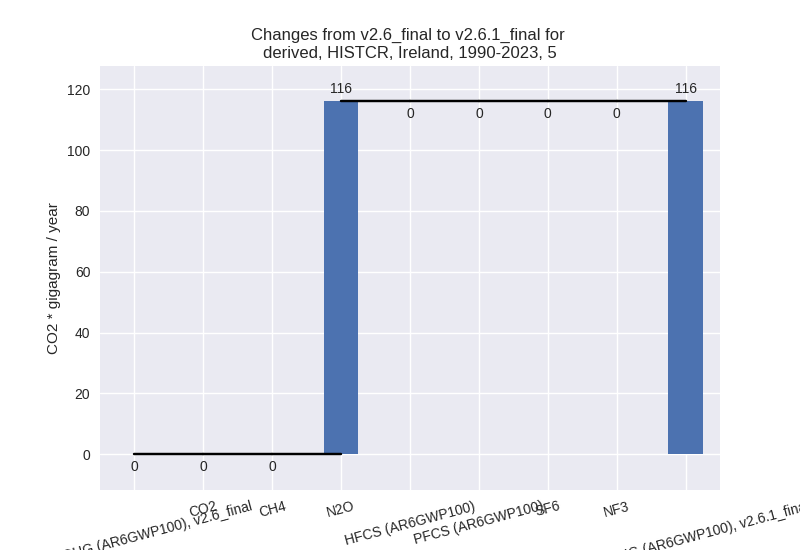
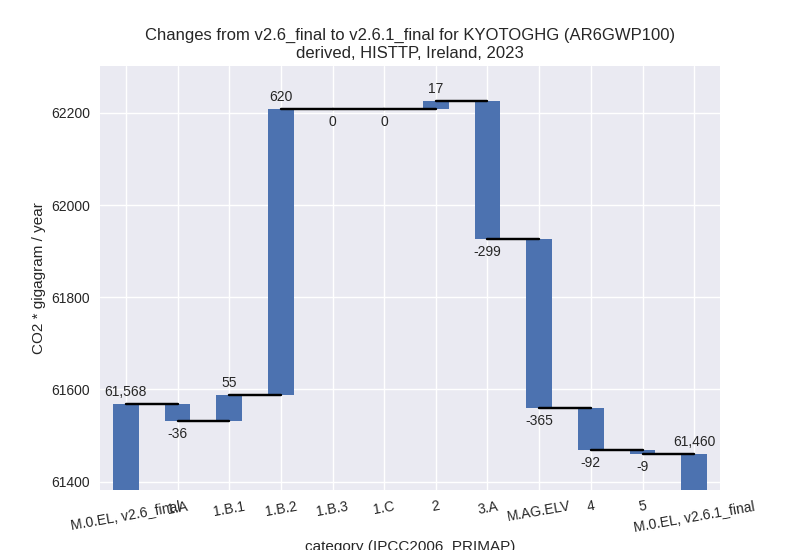
third party scenario (HISTTP):
Most important changes per time frame
For 2023 the following sector-gas combinations have the highest absolute impact on national total KyotoGHG (AR6GWP100) emissions in 2023 (top 5):
- 1: 1.B.2, CH4 with 491.36 Gg CO2 / year (81.3%)
- 2: M.AG.ELV, N2O with -372.76 Gg CO2 / year (-5.0%)
- 3: 3.A, CH4 with -269.75 Gg CO2 / year (-1.7%)
- 4: 2, HFCS (AR6GWP100) with 162.74 Gg CO2 / year (30.8%)
- 5: 2, CO2 with -134.27 Gg CO2 / year (-6.3%)
For 1990-2023 the following sector-gas combinations have the highest absolute impact on national total KyotoGHG (AR6GWP100) emissions in 1990-2023 (top 5):
- 1: 1.B.2, CH4 with 200.28 Gg CO2 / year (29.1%)
- 2: 1.A, N2O with 194.48 Gg CO2 / year (74.9%)
- 3: 1.B.2, CO2 with 134.20 Gg CO2 / year (5143765.9%)
- 4: 1.B.1, CH4 with 56.23 Gg CO2 / year (10910.0%)
- 5: 4, CH4 with -50.47 Gg CO2 / year (-2.6%)
Changes in the main sectors for aggregate KyotoGHG (AR6GWP100) are
- 1: Total sectoral emissions in 2022 are 35725.88 Gg CO2 / year which is 55.8% of M.0.EL emissions. 2023 Emissions have changed by 1.9% (639.80 Gg CO2 / year). 1990-2023 Emissions have changed by 1.5% (569.81 Gg CO2 / year).
- 2: Total sectoral emissions in 2022 are 3028.23 Gg CO2 / year which is 4.7% of M.0.EL emissions. 2023 Emissions have changed by 0.6% (17.20 Gg CO2 / year). 1990-2023 Emissions have changed by 0.3% (9.83 Gg CO2 / year).
- M.AG: Total sectoral emissions in 2022 are 24419.88
Gg CO2 / year which is 38.1% of M.0.EL emissions. 2023 Emissions have
changed by -2.7% (-664.39 Gg CO2 /
year). 1990-2023 Emissions have changed by -0.1% (-36.97 Gg CO2 / year). For 2023 the
changes per gas
are:
The changes come from the following subsectors:- 3.A: Total sectoral emissions in 2022 are 17071.72 Gg CO2 / year which is 69.9% of category M.AG emissions. 2023 Emissions have changed by -1.7% (-299.04 Gg CO2 / year). 1990-2023 Emissions have changed by -0.1% (-12.67 Gg CO2 / year).
- M.AG.ELV: Total sectoral emissions in 2022 are
7348.17 Gg CO2 / year which is 30.1% of category M.AG emissions. 2023
Emissions have changed by -4.8%
(-365.35 Gg CO2 / year). 1990-2023 Emissions have changed by -0.3% (-24.29 Gg CO2 / year). For 2023 the
changes per gas
are:

There is no subsector information available in PRIMAP-hist.
- 4: Total sectoral emissions in 2022 are 763.92 Gg
CO2 / year which is 1.2% of M.0.EL emissions. 2023 Emissions have
changed by -12.0% (-92.19 Gg CO2 /
year). 1990-2023 Emissions have changed by -2.4% (-49.18 Gg CO2 / year). For 2023 the
changes per gas
are:
For 1990-2023 the changes per gas are: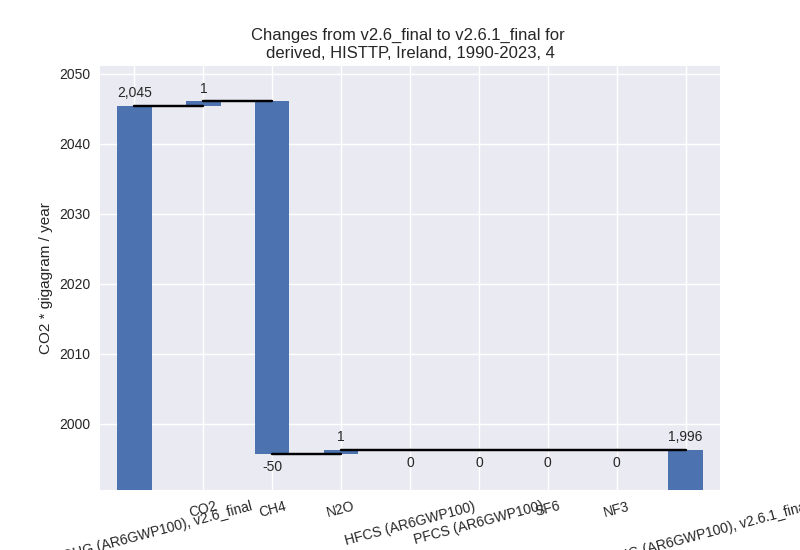
- 5: Total sectoral emissions in 2022 are 78.20 Gg
CO2 / year which is 0.1% of M.0.EL emissions. 2023 Emissions have
changed by -11.0% (-8.96 Gg CO2 /
year). 1990-2023 Emissions have changed by -6.2% (-7.71 Gg CO2 / year). For 2023 the
changes per gas
are:

For 1990-2023 the changes per gas are: