Changes in PRIMAP-hist v2.6.1_final compared to v2.6_final for Iran, Islamic Republic of
2025-03-19
Johannes Gütschow
Change analysis for Iran, Islamic Republic of for PRIMAP-hist v2.6.1_final compared to v2.6_final
Overview over emissions by sector and gas
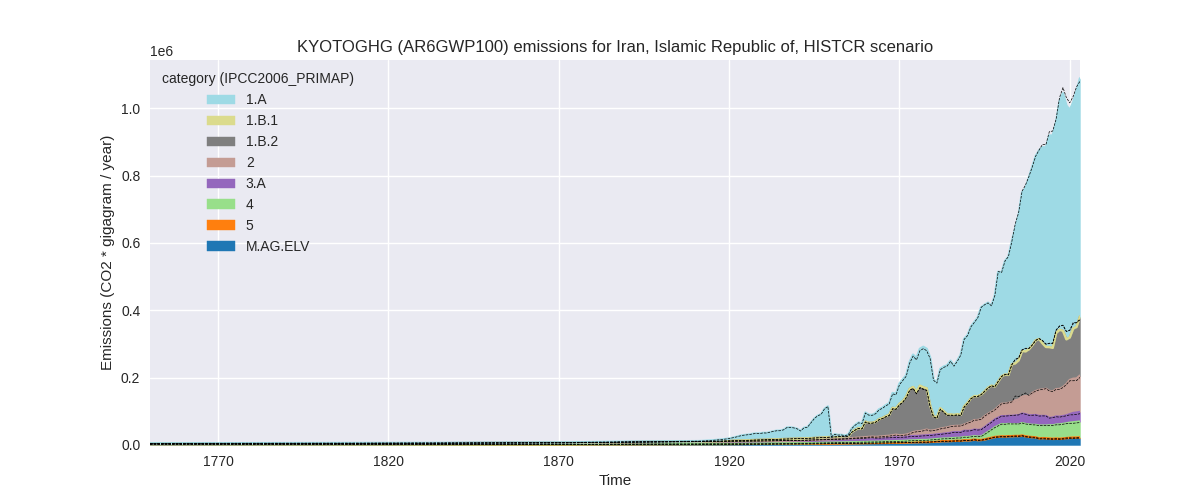
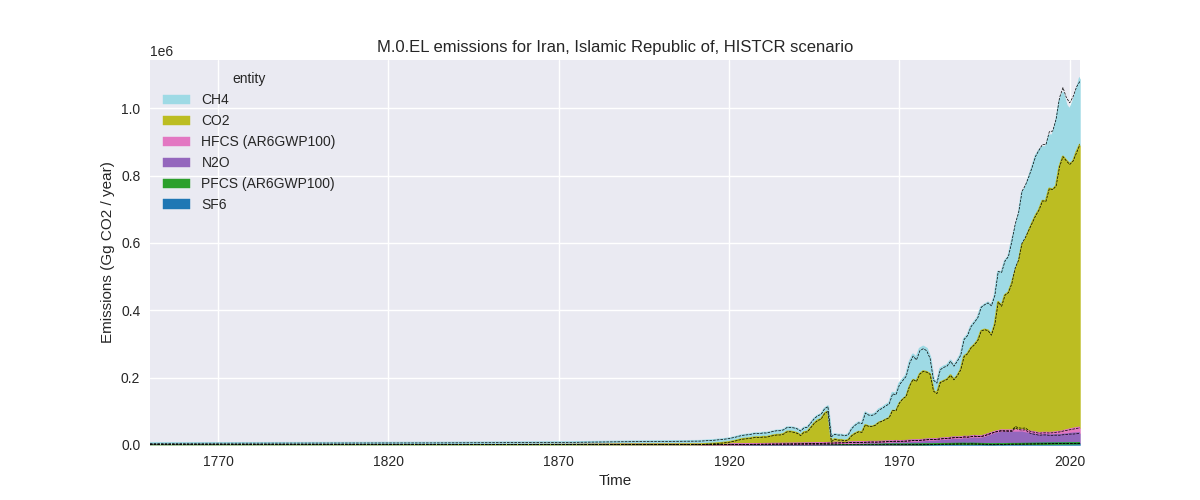
The following figures show the aggregate national total emissions excluding LULUCF AR6GWP100 for the country reported priority scenario. The dotted linesshow the v2.6_final data.
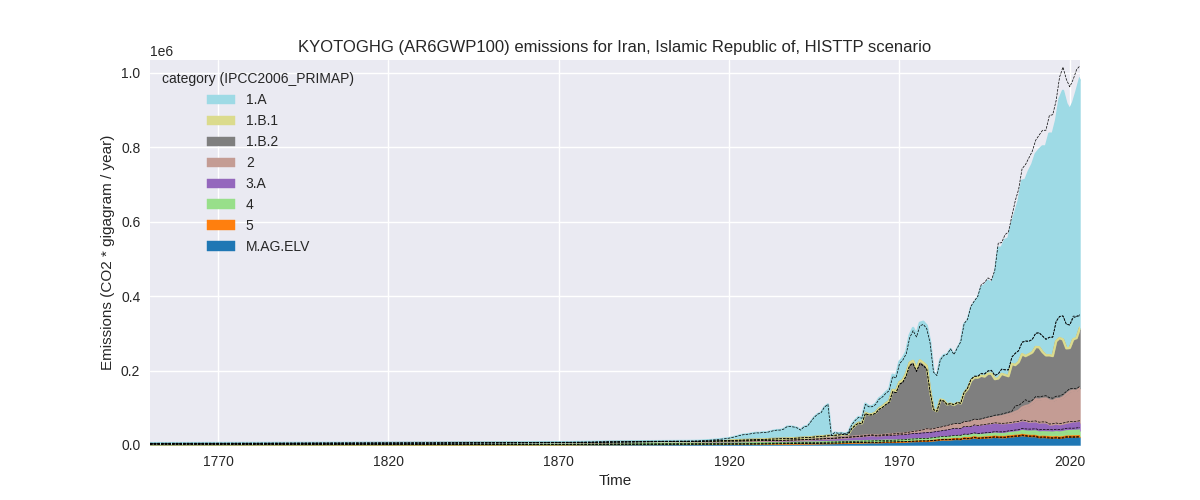
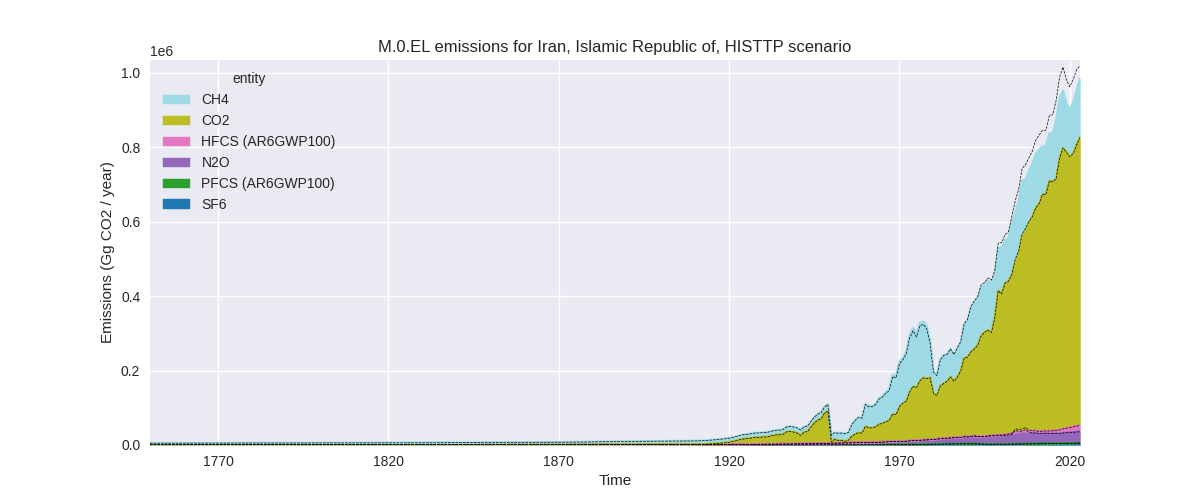
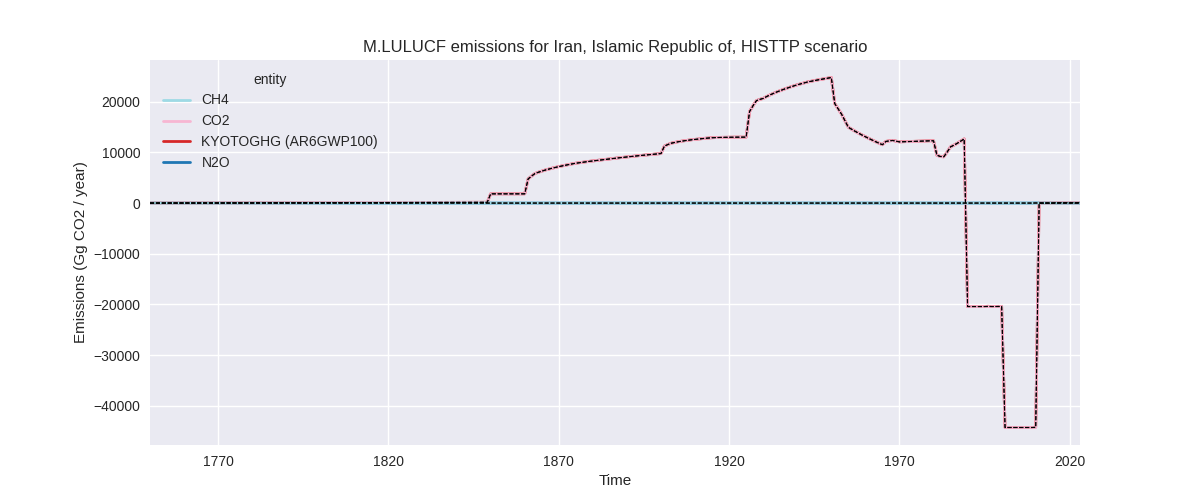
The following figures show the aggregate national total emissions excluding LULUCF AR6GWP100 for the third party priority scenario. The dotted linesshow the v2.6_final data.
Overview over changes
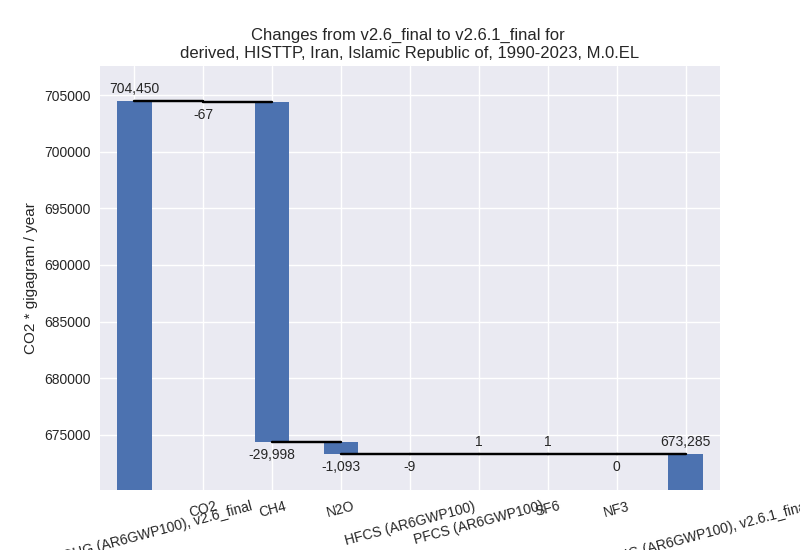
In the country reported priority scenario we have the following changes for aggregate Kyoto GHG and national total emissions excluding LULUCF (M.0.EL):
- Emissions in 2023 have changed by 0.8%% (8476.00 Gg CO2 / year)
- Emissions in 1990-2023 have changed by -0.7%% (-5339.92 Gg CO2 / year)
In the third party priority scenario we have the following changes for aggregate Kyoto GHG and national total emissions excluding LULUCF (M.0.EL):
- Emissions in 2023 have changed by -3.3%% (-33875.72 Gg CO2 / year)
- Emissions in 1990-2023 have changed by -4.4%% (-31164.87 Gg CO2 / year)
Most important changes per scenario and time frame
In the country reported priority scenario the following sector-gas combinations have the highest absolute impact on national total KyotoGHG (AR6GWP100) emissions in 2023 (top 5):
- 1: 1.B.2, CH4 with 4016.19 Gg CO2 / year (3.4%)
- 2: 4, CH4 with 3031.11 Gg CO2 / year (7.0%)
- 3: 3.A, CH4 with 2157.42 Gg CO2 / year (9.7%)
- 4: 1.B.1, CO2 with -1301.35 Gg CO2 / year (-72.3%)
- 5: 1.A, CH4 with 337.67 Gg CO2 / year (13.7%)
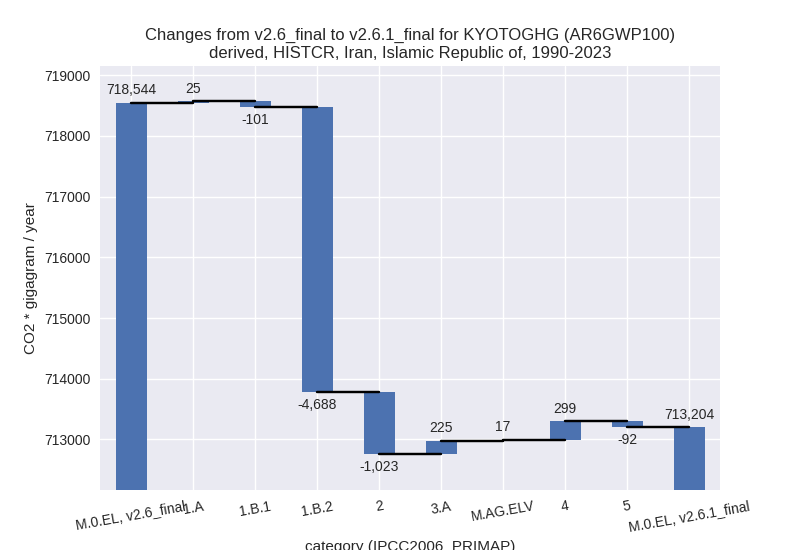
In the country reported priority scenario the following sector-gas combinations have the highest absolute impact on national total KyotoGHG (AR6GWP100) emissions in 1990-2023 (top 5):
- 1: 1.B.2, CH4 with -4696.18 Gg CO2 / year (-5.7%)
- 2: 2, N2O with -1067.29 Gg CO2 / year (-23.4%)
- 3: 4, CH4 with 299.19 Gg CO2 / year (1.0%)
- 4: 3.A, CH4 with 209.63 Gg CO2 / year (1.0%)
- 5: 1.B.1, CO2 with -96.48 Gg CO2 / year (-17.6%)
In the third party priority scenario the following sector-gas combinations have the highest absolute impact on national total KyotoGHG (AR6GWP100) emissions in 2023 (top 5):
- 1: 1.B.2, CH4 with -28069.83 Gg CO2 / year (-19.2%)
- 2: 4, CH4 with -7835.53 Gg CO2 / year (-35.8%)
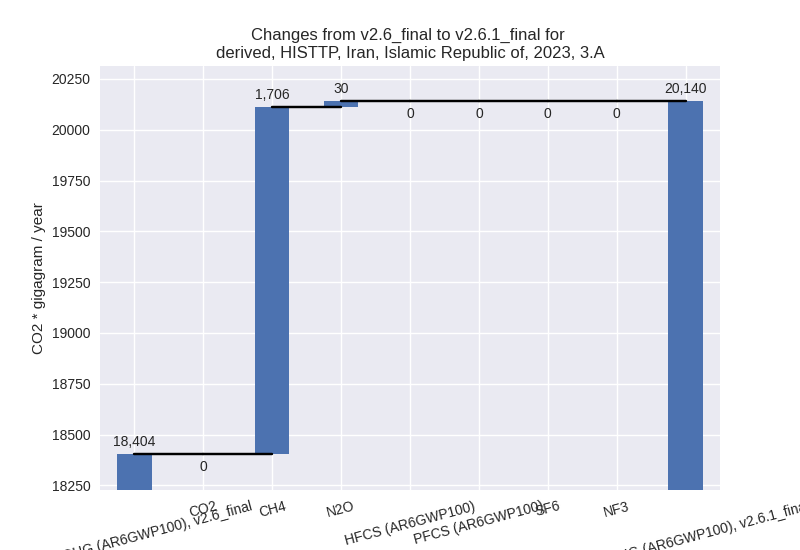
- 3: 3.A, CH4 with 1706.32 Gg CO2 / year (9.7%)
- 4: 1.B.1, CO2 with -1301.35 Gg CO2 / year (-72.3%)
- 5: 2, CO2 with 797.58 Gg CO2 / year (1.2%)
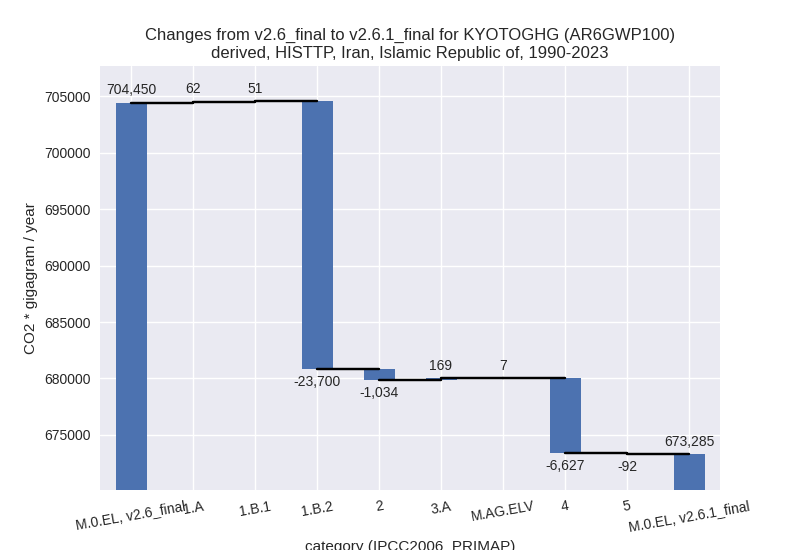
In the third party priority scenario the following sector-gas combinations have the highest absolute impact on national total KyotoGHG (AR6GWP100) emissions in 1990-2023 (top 5):
- 1: 1.B.2, CH4 with -23707.44 Gg CO2 / year (-19.6%)
- 2: 4, CH4 with -6625.33 Gg CO2 / year (-40.8%)
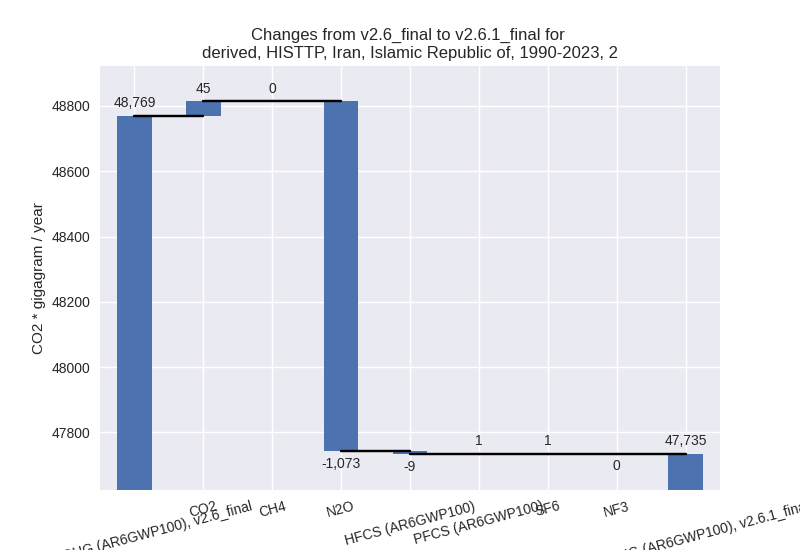
- 3: 2, N2O with -1072.56 Gg CO2 / year (-23.3%)
- 4: 3.A, CH4 with 165.80 Gg CO2 / year (0.8%)
- 5: 1.B.1, CH4 with 147.45 Gg CO2 / year (23.3%)
Notes on data changes
Here we list notes explaining important emissions changes for the country.
- No new country reported data has been included. Changes in the CR time-series come from updated third party data and affect more than the last years as country reported data only covers a few years.
- N2O emissions in 2.B had a peak between 2003 and 2009 which has been removed in the new EDGAR data (CR, TP)
- Changes in the TP time-series are higher because CH in sectors 4 and 1.B.2 is not anchored by country reported emissions and the full changes in EDGAR make it to the PRIMAP-hist time-series.
Changes by sector and gas
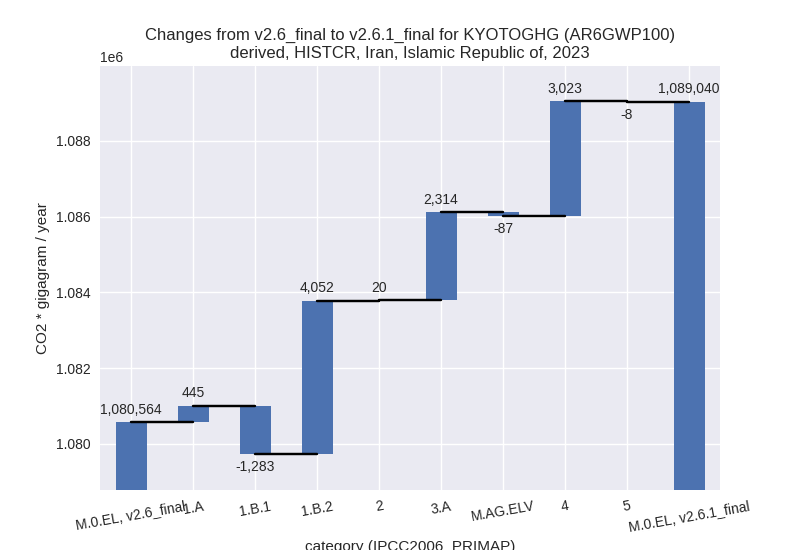
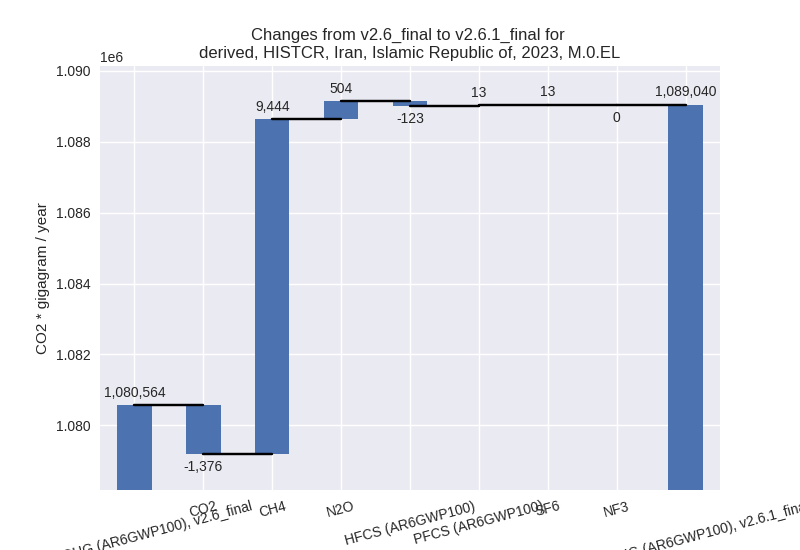
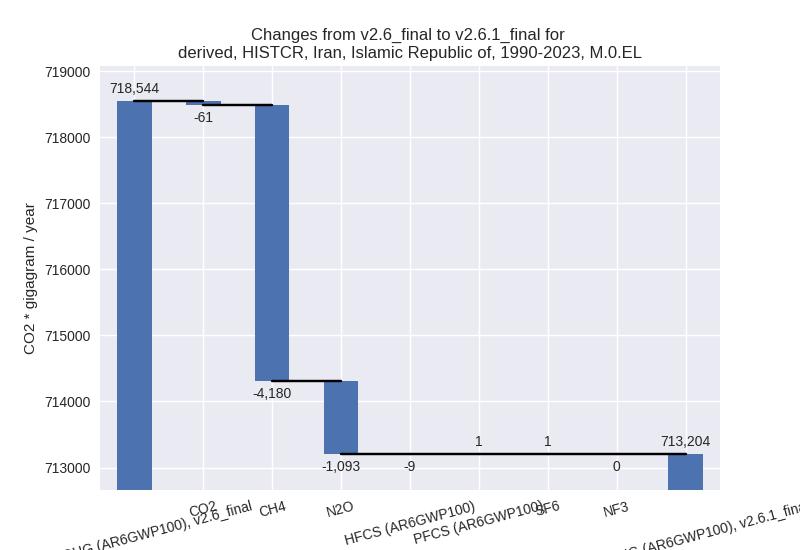
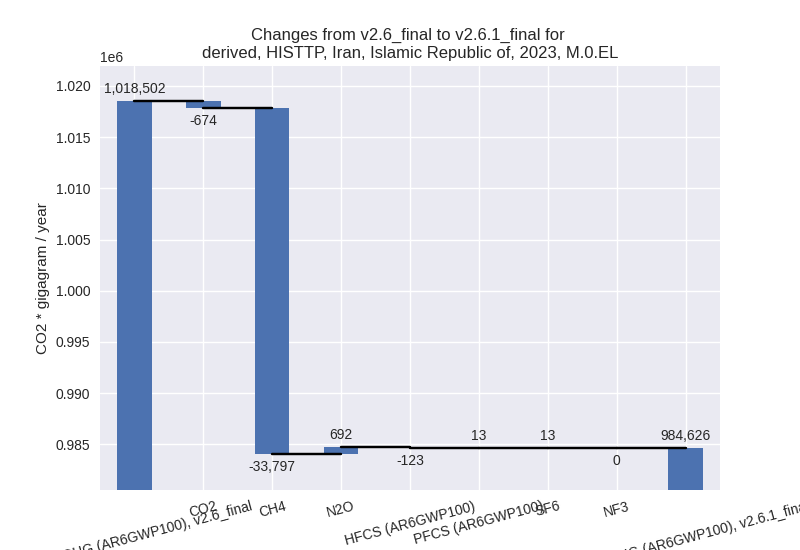
For each scenario and time frame the changes are displayed for all individual sectors and all individual gases. In the sector plot we use aggregate Kyoto GHGs in AR6GWP100. In the gas plot we usenational total emissions without LULUCF.
country reported scenario
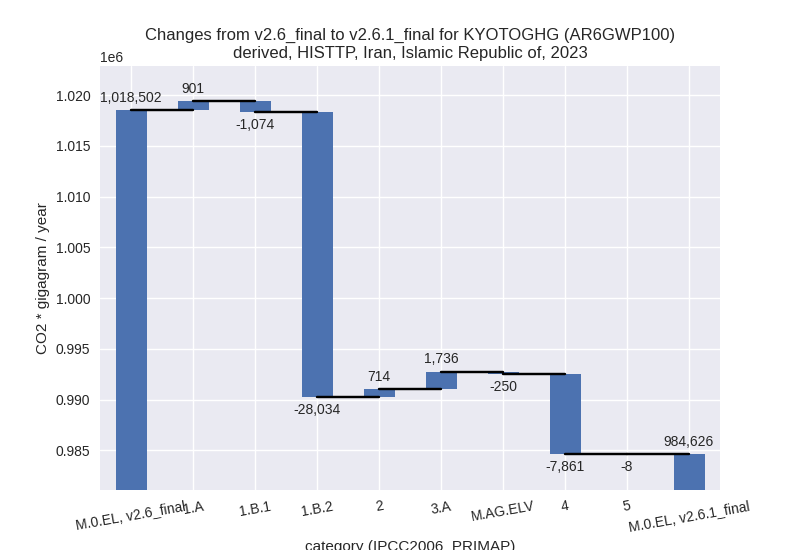
2023
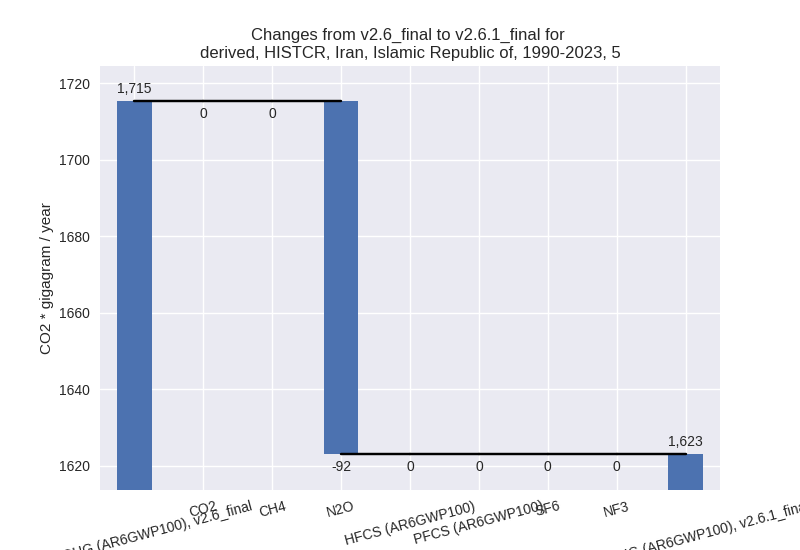
1990-2023
third party scenario
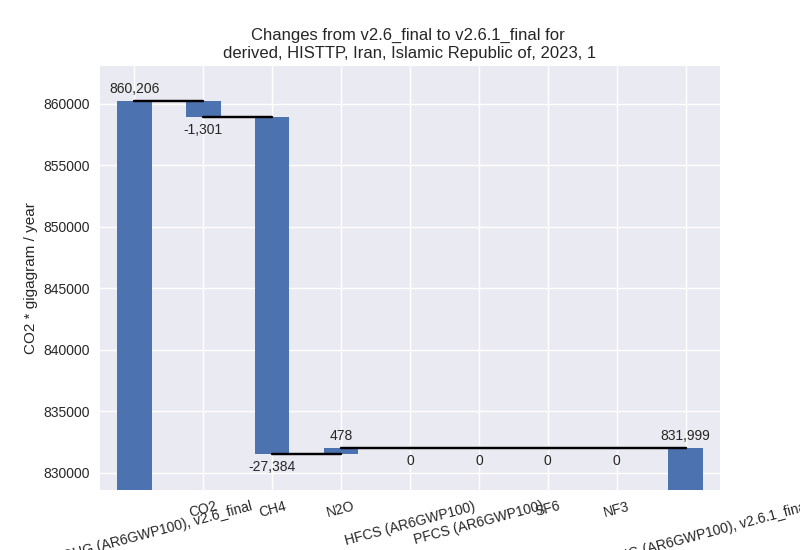
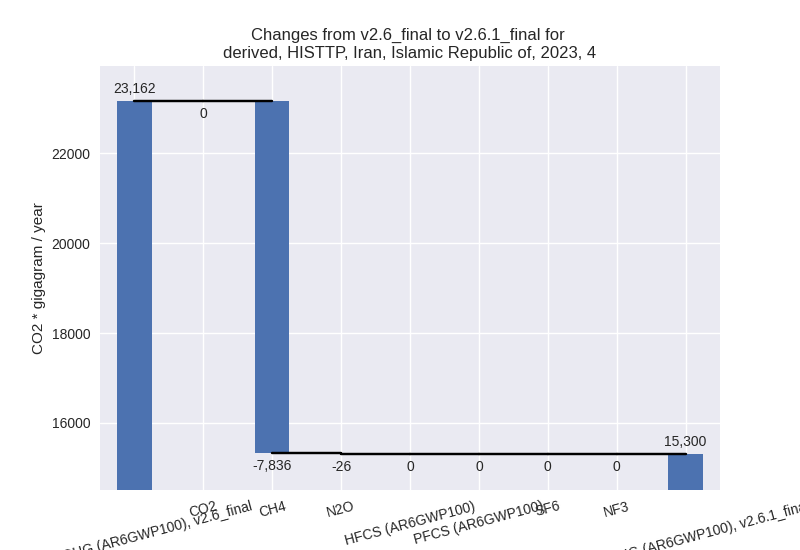
2023
1990-2023
Detailed changes for the scenarios:
country reported scenario (HISTCR):
Most important changes per time frame
For 2023 the following sector-gas combinations have the highest absolute impact on national total KyotoGHG (AR6GWP100) emissions in 2023 (top 5):
- 1: 1.B.2, CH4 with 4016.19 Gg CO2 / year (3.4%)
- 2: 4, CH4 with 3031.11 Gg CO2 / year (7.0%)
- 3: 3.A, CH4 with 2157.42 Gg CO2 / year (9.7%)
- 4: 1.B.1, CO2 with -1301.35 Gg CO2 / year (-72.3%)
- 5: 1.A, CH4 with 337.67 Gg CO2 / year (13.7%)
For 1990-2023 the following sector-gas combinations have the highest absolute impact on national total KyotoGHG (AR6GWP100) emissions in 1990-2023 (top 5):
- 1: 1.B.2, CH4 with -4696.18 Gg CO2 / year (-5.7%)
- 2: 2, N2O with -1067.29 Gg CO2 / year (-23.4%)
- 3: 4, CH4 with 299.19 Gg CO2 / year (1.0%)
- 4: 3.A, CH4 with 209.63 Gg CO2 / year (1.0%)
- 5: 1.B.1, CO2 with -96.48 Gg CO2 / year (-17.6%)
Changes in the main sectors for aggregate KyotoGHG (AR6GWP100) are
- 1: Total sectoral emissions in 2022 are 853785.36 Gg CO2 / year which is 81.2% of M.0.EL emissions. 2023 Emissions have changed by 0.4% (3214.20 Gg CO2 / year). 1990-2023 Emissions have changed by -0.8% (-4764.56 Gg CO2 / year).
- 2: Total sectoral emissions in 2022 are 101128.18 Gg CO2 / year which is 9.6% of M.0.EL emissions. 2023 Emissions have changed by 0.0% (19.84 Gg CO2 / year). 1990-2023 Emissions have changed by -1.7% (-1022.74 Gg CO2 / year).
- M.AG: Total sectoral emissions in 2022 are 47813.05
Gg CO2 / year which is 4.5% of M.0.EL emissions. 2023 Emissions have
changed by 4.8% (2227.13 Gg CO2 /
year). 1990-2023 Emissions have changed by 0.5% (241.16 Gg CO2 / year). For 2023 the
changes per gas
are:
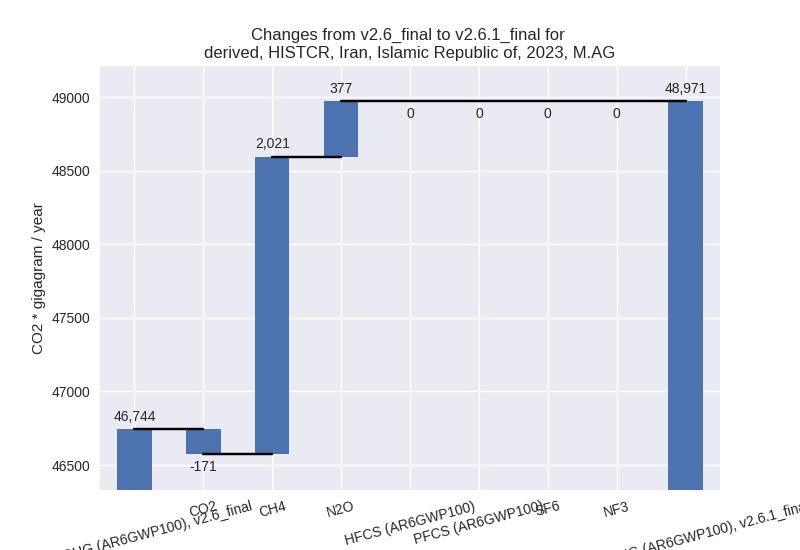
The changes come from the following subsectors:- 3.A: Total sectoral emissions in 2022 are 27905.73
Gg CO2 / year which is 58.4% of category M.AG emissions. 2023 Emissions
have changed by 8.8% (2314.08 Gg CO2
/ year). 1990-2023 Emissions have changed by 0.9% (224.50 Gg CO2 / year). For 2023 the
changes per gas
are:

There is no subsector information available in PRIMAP-hist. - M.AG.ELV: Total sectoral emissions in 2022 are 19907.32 Gg CO2 / year which is 41.6% of category M.AG emissions. 2023 Emissions have changed by -0.4% (-86.96 Gg CO2 / year). 1990-2023 Emissions have changed by 0.1% (16.65 Gg CO2 / year).
- 3.A: Total sectoral emissions in 2022 are 27905.73
Gg CO2 / year which is 58.4% of category M.AG emissions. 2023 Emissions
have changed by 8.8% (2314.08 Gg CO2
/ year). 1990-2023 Emissions have changed by 0.9% (224.50 Gg CO2 / year). For 2023 the
changes per gas
are:
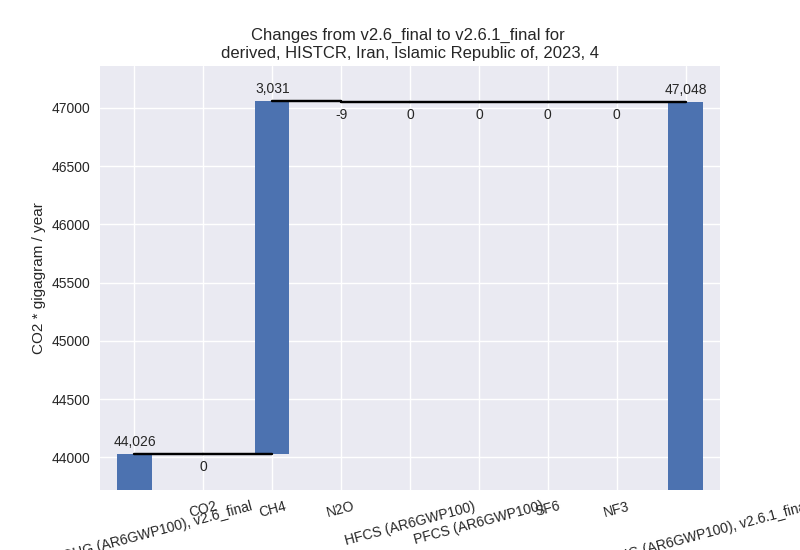
- 4: Total sectoral emissions in 2022 are 46376.76 Gg
CO2 / year which is 4.4% of M.0.EL emissions. 2023 Emissions have
changed by 6.9% (3022.56 Gg CO2 /
year). 1990-2023 Emissions have changed by 0.9% (298.61 Gg CO2 / year). For 2023 the
changes per gas
are:
- 5: Total sectoral emissions in 2022 are 2108.90 Gg
CO2 / year which is 0.2% of M.0.EL emissions. 2023 Emissions have
changed by -0.4% (-7.63 Gg CO2 /
year). 1990-2023 Emissions have changed by -5.4% (-92.38 Gg CO2 / year). For
1990-2023 the changes per gas
are:
third party scenario (HISTTP):
Most important changes per time frame
For 2023 the following sector-gas combinations have the highest absolute impact on national total KyotoGHG (AR6GWP100) emissions in 2023 (top 5):
- 1: 1.B.2, CH4 with -28069.83 Gg CO2 / year (-19.2%)
- 2: 4, CH4 with -7835.53 Gg CO2 / year (-35.8%)
- 3: 3.A, CH4 with 1706.32 Gg CO2 / year (9.7%)
- 4: 1.B.1, CO2 with -1301.35 Gg CO2 / year (-72.3%)
- 5: 2, CO2 with 797.58 Gg CO2 / year (1.2%)
For 1990-2023 the following sector-gas combinations have the highest absolute impact on national total KyotoGHG (AR6GWP100) emissions in 1990-2023 (top 5):
- 1: 1.B.2, CH4 with -23707.44 Gg CO2 / year (-19.6%)
- 2: 4, CH4 with -6625.33 Gg CO2 / year (-40.8%)
- 3: 2, N2O with -1072.56 Gg CO2 / year (-23.3%)
- 4: 3.A, CH4 with 165.80 Gg CO2 / year (0.8%)
- 5: 1.B.1, CH4 with 147.45 Gg CO2 / year (23.3%)
Changes in the main sectors for aggregate KyotoGHG (AR6GWP100) are
- 1: Total sectoral emissions in 2022 are 805096.84
Gg CO2 / year which is 84.7% of M.0.EL emissions. 2023 Emissions have
changed by -3.3% (-28207.25 Gg CO2 /
year). 1990-2023 Emissions have changed by -4.0% (-23586.48 Gg CO2 / year). For 2023
the changes per gas
are:
For 1990-2023 the changes per gas are:
The changes come from the following subsectors:- 1.A: Total sectoral emissions in 2022 are 663102.08 Gg CO2 / year which is 82.4% of category 1 emissions. 2023 Emissions have changed by 0.1% (901.28 Gg CO2 / year). 1990-2023 Emissions have changed by 0.0% (62.18 Gg CO2 / year).
- 1.B.1: Total sectoral emissions in 2022 are 1435.82
Gg CO2 / year which is 0.2% of category 1 emissions. 2023 Emissions have
changed by -42.4% (-1074.36 Gg CO2 /
year). 1990-2023 Emissions have changed by 4.3% (50.98 Gg CO2 / year). For 2023 the
changes per gas
are:
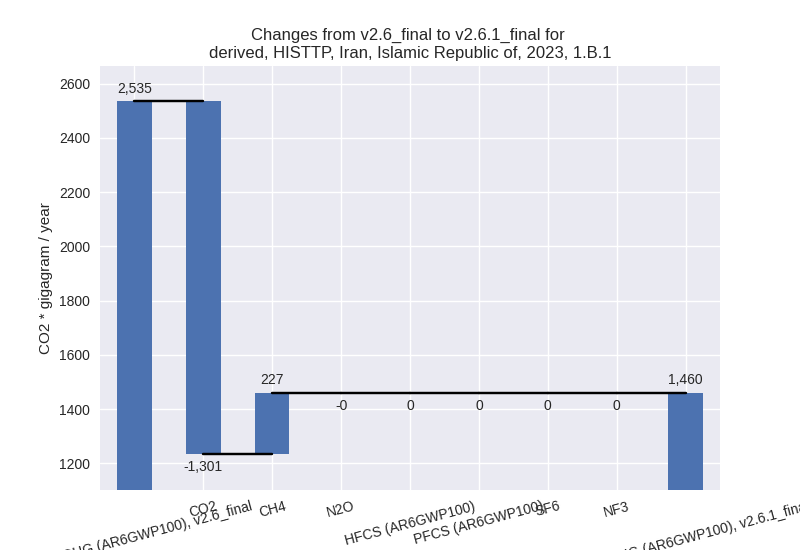
For 1990-2023 the changes per gas are: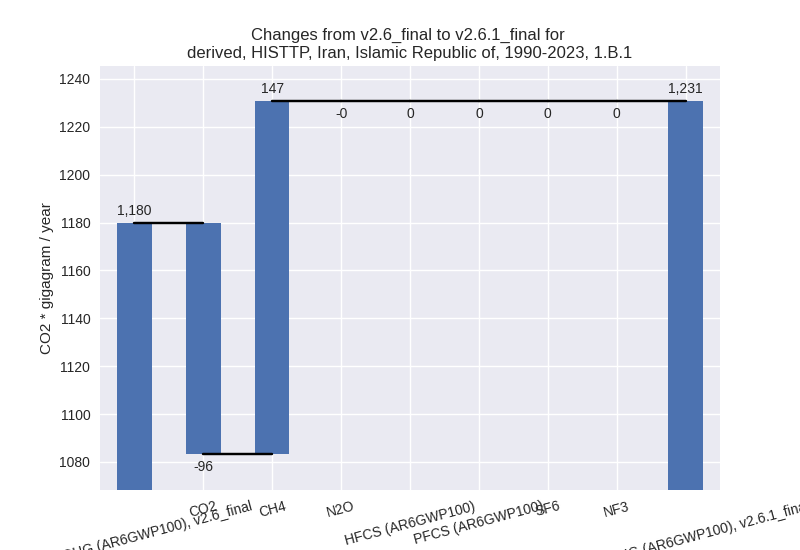
There is no subsector information available in PRIMAP-hist. - 1.B.2: Total sectoral emissions in 2022 are
140558.94 Gg CO2 / year which is 17.5% of category 1 emissions. 2023
Emissions have changed by -14.8%
(-28034.18 Gg CO2 / year). 1990-2023 Emissions have changed by -15.9% (-23699.64 Gg CO2 / year). For 2023
the changes per gas
are:

For 1990-2023 the changes per gas are: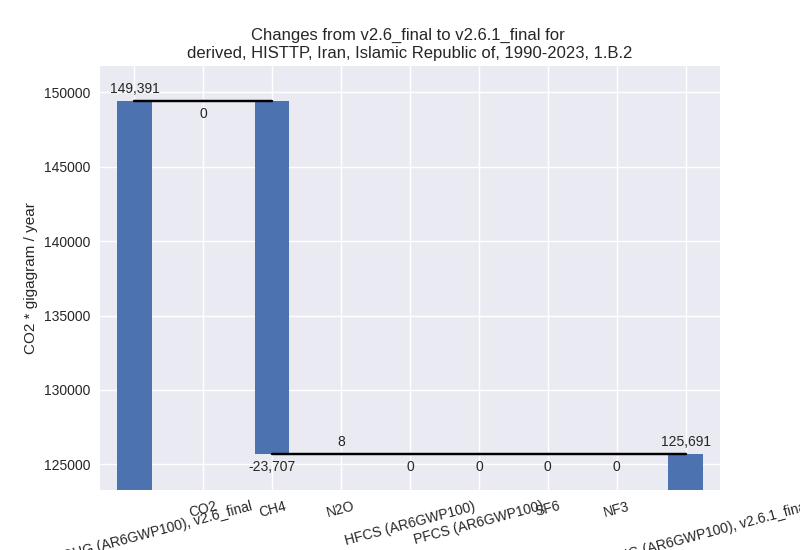
There is no subsector information available in PRIMAP-hist.
- 2: Total sectoral emissions in 2022 are 87730.73 Gg
CO2 / year which is 9.2% of M.0.EL emissions. 2023 Emissions have
changed by 0.8% (714.40 Gg CO2 /
year). 1990-2023 Emissions have changed by -2.1% (-1034.42 Gg CO2 / year). For
1990-2023 the changes per gas
are:
- M.AG: Total sectoral emissions in 2022 are 40398.45
Gg CO2 / year which is 4.3% of M.0.EL emissions. 2023 Emissions have
changed by 3.7% (1486.12 Gg CO2 /
year). 1990-2023 Emissions have changed by 0.4% (175.48 Gg CO2 / year). For 2023 the
changes per gas
are:
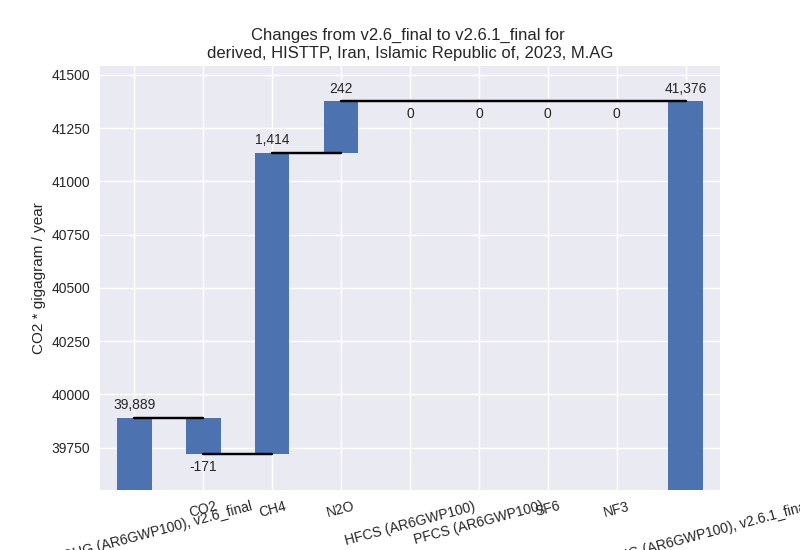
The changes come from the following subsectors:- 3.A: Total sectoral emissions in 2022 are 19639.22
Gg CO2 / year which is 48.6% of category M.AG emissions. 2023 Emissions
have changed by 9.4% (1735.99 Gg CO2
/ year). 1990-2023 Emissions have changed by 0.8% (168.62 Gg CO2 / year). For 2023 the
changes per gas
are:
There is no subsector information available in PRIMAP-hist. - M.AG.ELV: Total sectoral emissions in 2022 are 20759.22 Gg CO2 / year which is 51.4% of category M.AG emissions. 2023 Emissions have changed by -1.2% (-249.86 Gg CO2 / year). 1990-2023 Emissions have changed by 0.0% (6.87 Gg CO2 / year).
- 3.A: Total sectoral emissions in 2022 are 19639.22
Gg CO2 / year which is 48.6% of category M.AG emissions. 2023 Emissions
have changed by 9.4% (1735.99 Gg CO2
/ year). 1990-2023 Emissions have changed by 0.8% (168.62 Gg CO2 / year). For 2023 the
changes per gas
are:
- 4: Total sectoral emissions in 2022 are 15092.24 Gg
CO2 / year which is 1.6% of M.0.EL emissions. 2023 Emissions have
changed by -33.9% (-7861.39 Gg CO2 /
year). 1990-2023 Emissions have changed by -38.4% (-6627.08 Gg CO2 / year). For 2023
the changes per gas
are:
For 1990-2023 the changes per gas are:
- 5: Total sectoral emissions in 2022 are 2108.90 Gg
CO2 / year which is 0.2% of M.0.EL emissions. 2023 Emissions have
changed by -0.4% (-7.63 Gg CO2 /
year). 1990-2023 Emissions have changed by -5.4% (-92.38 Gg CO2 / year). For
1990-2023 the changes per gas
are:
