Changes in PRIMAP-hist v2.6.1_final compared to v2.6_final for Iraq
2025-03-19
Johannes Gütschow
Change analysis for Iraq for PRIMAP-hist v2.6.1_final compared to v2.6_final
Overview over emissions by sector and gas
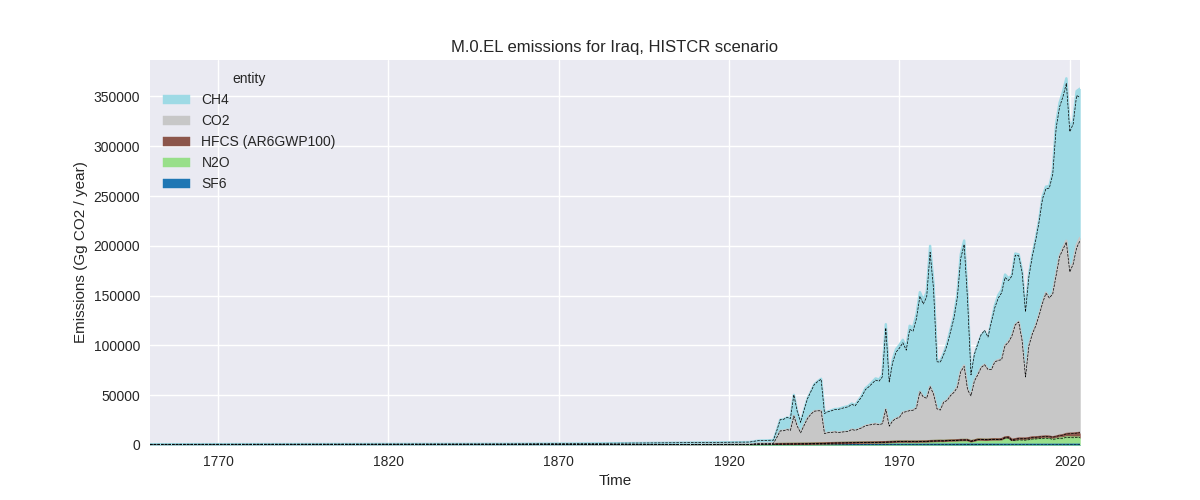
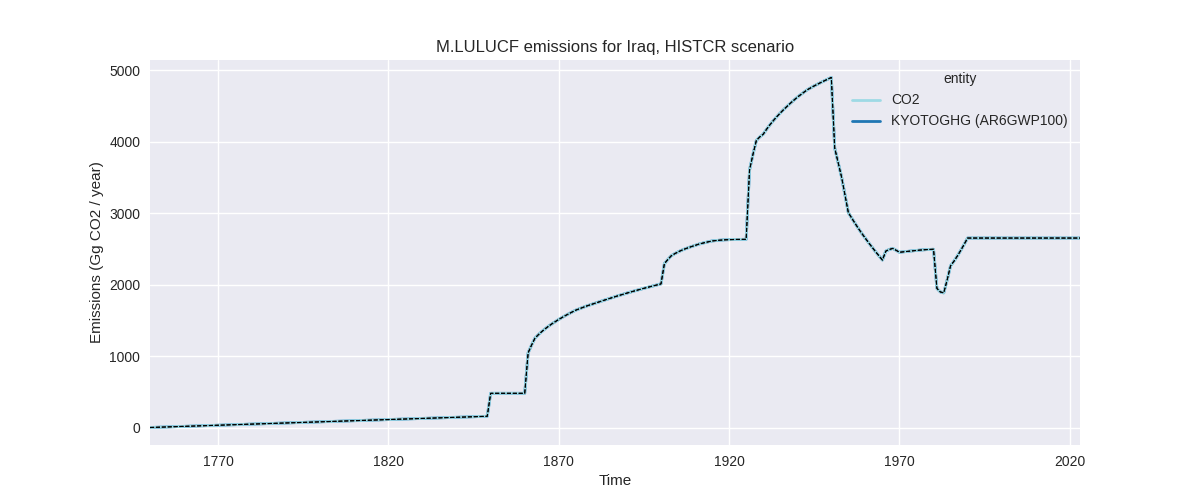
The following figures show the aggregate national total emissions excluding LULUCF AR6GWP100 for the country reported priority scenario. The dotted linesshow the v2.6_final data.

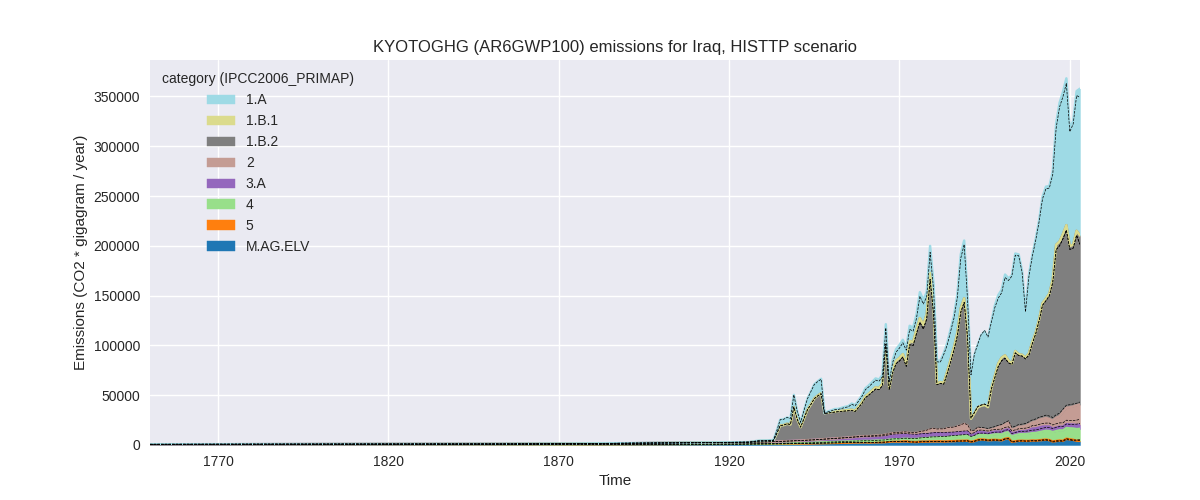
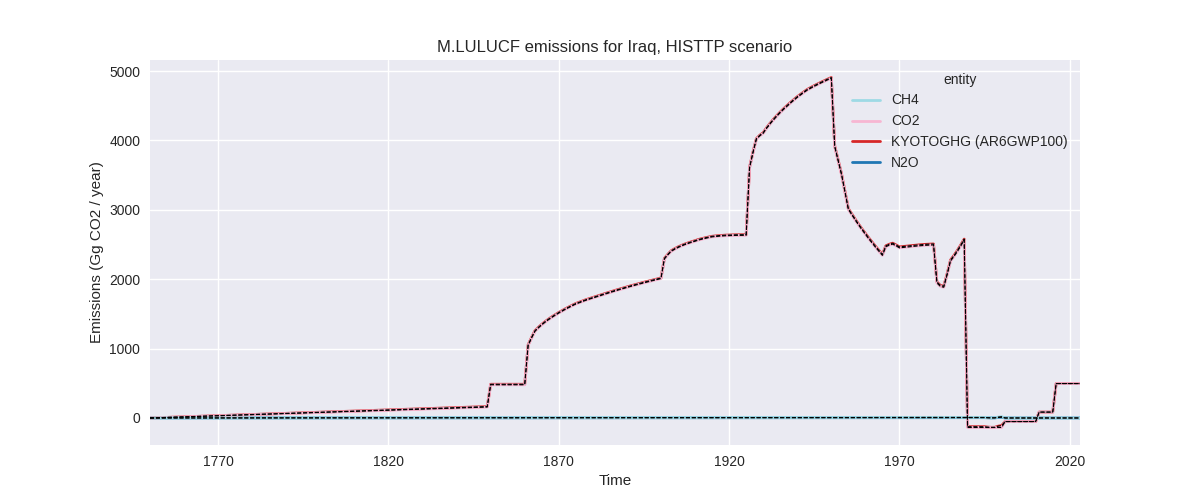
The following figures show the aggregate national total emissions excluding LULUCF AR6GWP100 for the third party priority scenario. The dotted linesshow the v2.6_final data.

Overview over changes
In the country reported priority scenario we have the following changes for aggregate Kyoto GHG and national total emissions excluding LULUCF (M.0.EL):
- Emissions in 2023 have changed by 2.5%% (8862.34 Gg CO2 / year)
- Emissions in 1990-2023 have changed by 1.0%% (2106.57 Gg CO2 / year)
In the third party priority scenario we have the following changes for aggregate Kyoto GHG and national total emissions excluding LULUCF (M.0.EL):
- Emissions in 2023 have changed by 2.5%% (8862.34 Gg CO2 / year)
- Emissions in 1990-2023 have changed by 1.0%% (2106.57 Gg CO2 / year)
Most important changes per scenario and time frame
In the country reported priority scenario the following sector-gas combinations have the highest absolute impact on national total KyotoGHG (AR6GWP100) emissions in 2023 (top 5):
- 1: 1.B.2, CH4 with 11322.27 Gg CO2 / year (9.2%)
- 2: 4, CH4 with -4324.77 Gg CO2 / year (-27.4%)
- 3: 2, CO2 with 2905.51 Gg CO2 / year (27.7%)
- 4: M.AG.ELV, CH4 with -944.64 Gg CO2 / year (-88.5%)
- 5: 5, N2O with -155.63 Gg CO2 / year (-19.4%)
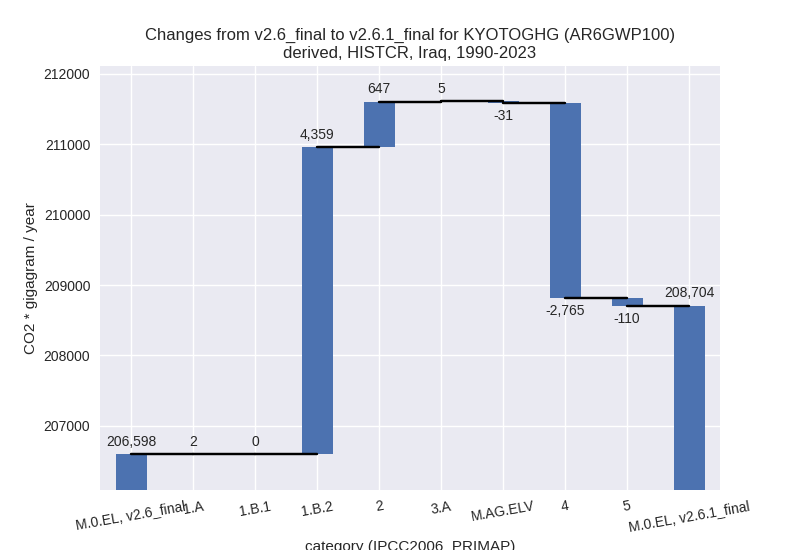
In the country reported priority scenario the following sector-gas combinations have the highest absolute impact on national total KyotoGHG (AR6GWP100) emissions in 1990-2023 (top 5):
- 1: 1.B.2, CH4 with 4354.69 Gg CO2 / year (6.1%)
- 2: 4, CH4 with -2763.45 Gg CO2 / year (-28.0%)
- 3: 2, CO2 with 648.95 Gg CO2 / year (16.0%)
- 4: 5, N2O with -110.15 Gg CO2 / year (-18.6%)
- 5: M.AG.ELV, CH4 with -48.17 Gg CO2 / year (-5.9%)
In the third party priority scenario the following sector-gas combinations have the highest absolute impact on national total KyotoGHG (AR6GWP100) emissions in 2023 (top 5):
- 1: 1.B.2, CH4 with 11322.27 Gg CO2 / year (9.2%)
- 2: 4, CH4 with -4324.77 Gg CO2 / year (-27.4%)
- 3: 2, CO2 with 2905.51 Gg CO2 / year (27.7%)
- 4: M.AG.ELV, CH4 with -944.64 Gg CO2 / year (-88.5%)
- 5: 5, N2O with -155.63 Gg CO2 / year (-19.4%)
In the third party priority scenario the following sector-gas combinations have the highest absolute impact on national total KyotoGHG (AR6GWP100) emissions in 1990-2023 (top 5):
- 1: 1.B.2, CH4 with 4354.69 Gg CO2 / year (6.1%)
- 2: 4, CH4 with -2763.45 Gg CO2 / year (-28.0%)
- 3: 2, CO2 with 648.95 Gg CO2 / year (16.0%)
- 4: 5, N2O with -110.15 Gg CO2 / year (-18.6%)
- 5: M.AG.ELV, CH4 with -48.17 Gg CO2 / year (-5.9%)
Notes on data changes
Here we list notes explaining important emissions changes for the country.
- There is no usable country reported data for Cameroon, thus the CR and TP time-series are identical.
- Changes in the TP time-series come from updated EDGAR and FAO data. FAO has adjusted data for the latest years and replaces extrapolated which has a high influence for sectors with high fluctuation like CH4 in M.AG.ELV. EDGAR has updated full time-series with the main change coming from the waste sector and CH4 from oil and gas (1.B.2).
Changes by sector and gas
For each scenario and time frame the changes are displayed for all individual sectors and all individual gases. In the sector plot we use aggregate Kyoto GHGs in AR6GWP100. In the gas plot we usenational total emissions without LULUCF.
country reported scenario
2023


1990-2023

third party scenario
2023
1990-2023

Detailed changes for the scenarios:
country reported scenario (HISTCR):
Most important changes per time frame
For 2023 the following sector-gas combinations have the highest absolute impact on national total KyotoGHG (AR6GWP100) emissions in 2023 (top 5):
- 1: 1.B.2, CH4 with 11322.27 Gg CO2 / year (9.2%)
- 2: 4, CH4 with -4324.77 Gg CO2 / year (-27.4%)
- 3: 2, CO2 with 2905.51 Gg CO2 / year (27.7%)
- 4: M.AG.ELV, CH4 with -944.64 Gg CO2 / year (-88.5%)
- 5: 5, N2O with -155.63 Gg CO2 / year (-19.4%)
For 1990-2023 the following sector-gas combinations have the highest absolute impact on national total KyotoGHG (AR6GWP100) emissions in 1990-2023 (top 5):
- 1: 1.B.2, CH4 with 4354.69 Gg CO2 / year (6.1%)
- 2: 4, CH4 with -2763.45 Gg CO2 / year (-28.0%)
- 3: 2, CO2 with 648.95 Gg CO2 / year (16.0%)
- 4: 5, N2O with -110.15 Gg CO2 / year (-18.6%)
- 5: M.AG.ELV, CH4 with -48.17 Gg CO2 / year (-5.9%)
Changes in the main sectors for aggregate KyotoGHG (AR6GWP100) are
- 1: Total sectoral emissions in 2022 are 315506.60
Gg CO2 / year which is 88.8% of M.0.EL emissions. 2023 Emissions have
changed by 3.7% (11365.67 Gg CO2 /
year). 1990-2023 Emissions have changed by 2.4% (4361.52 Gg CO2 / year). For 2023 the
changes per gas
are:

For 1990-2023 the changes per gas are:
The changes come from the following subsectors:- 1.A: Total sectoral emissions in 2022 are 140266.03 Gg CO2 / year which is 44.5% of category 1 emissions. 2023 Emissions have changed by 0.0% (33.74 Gg CO2 / year). 1990-2023 Emissions have changed by 0.0% (2.06 Gg CO2 / year).
- 1.B.1: Total sectoral emissions in 2022 are 57.28
Gg CO2 / year which is 0.0% of category 1 emissions. 2023 Emissions have
changed by 5.9% (3.21 Gg CO2 /
year). 1990-2023 Emissions have changed by 1.0% (0.41 Gg CO2 / year). For 2023 the
changes per gas
are:

There is no subsector information available in PRIMAP-hist. - 1.B.2: Total sectoral emissions in 2022 are
175183.29 Gg CO2 / year which is 55.5% of category 1 emissions. 2023
Emissions have changed by 7.2%
(11328.73 Gg CO2 / year). 1990-2023 Emissions have changed by 4.9% (4359.05 Gg CO2 / year). For 2023 the
changes per gas
are:

For 1990-2023 the changes per gas are:
There is no subsector information available in PRIMAP-hist.
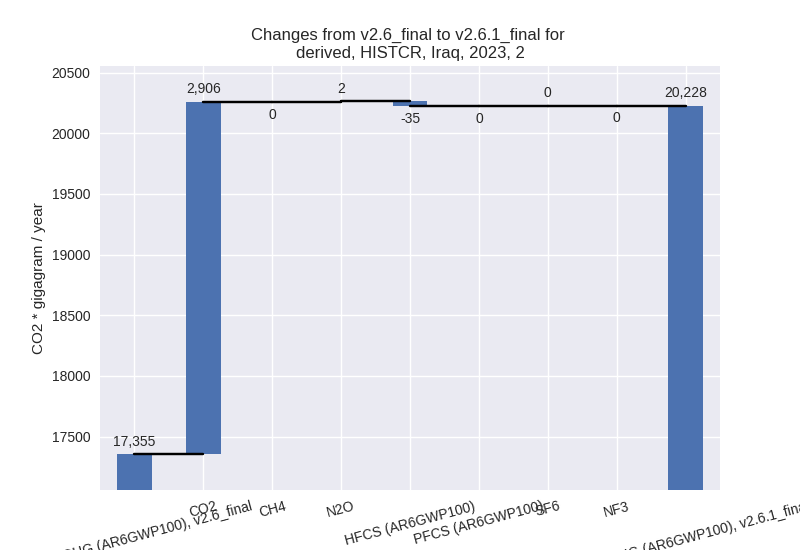
- 2: Total sectoral emissions in 2022 are 19832.46 Gg
CO2 / year which is 5.6% of M.0.EL emissions. 2023 Emissions have
changed by 16.6% (2872.91 Gg CO2 /
year). 1990-2023 Emissions have changed by 9.3% (646.51 Gg CO2 / year). For 2023 the
changes per gas
are:
For 1990-2023 the changes per gas are: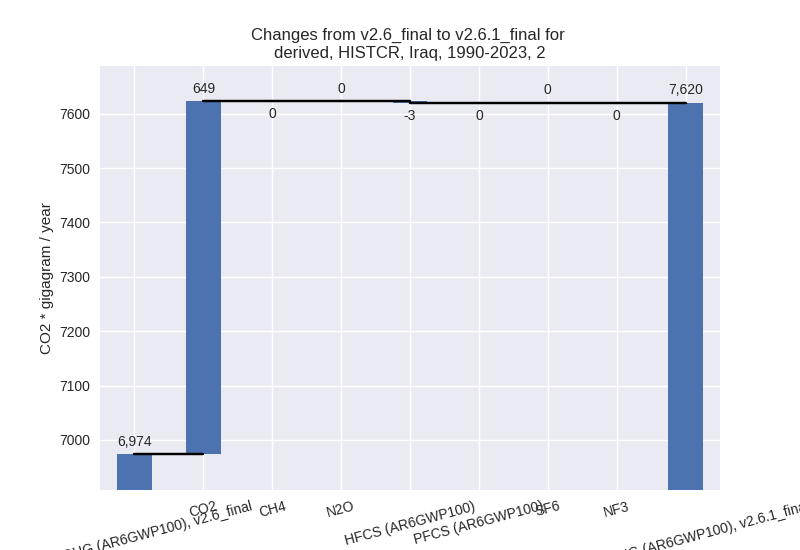
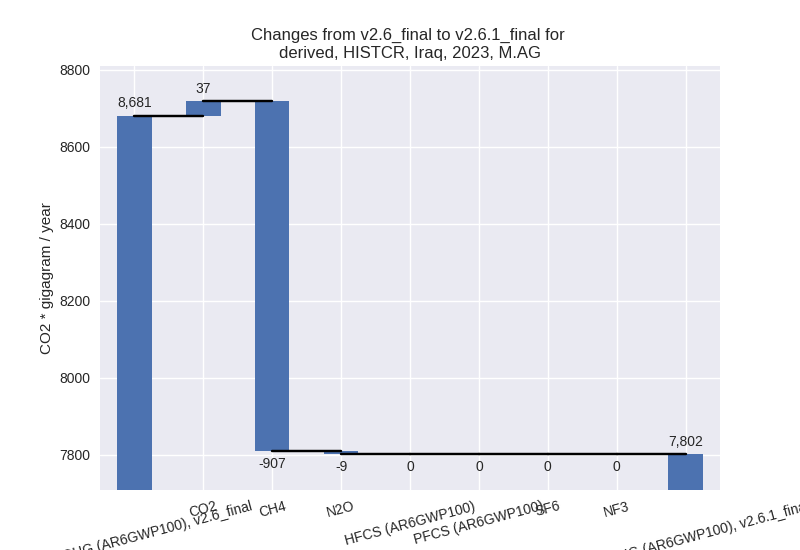
- M.AG: Total sectoral emissions in 2022 are 7687.57
Gg CO2 / year which is 2.2% of M.0.EL emissions. 2023 Emissions have
changed by -10.1% (-879.13 Gg CO2 /
year). 1990-2023 Emissions have changed by -0.3% (-26.19 Gg CO2 / year). For 2023 the
changes per gas
are:
The changes come from the following subsectors:- 3.A: Total sectoral emissions in 2022 are 4078.39 Gg CO2 / year which is 53.1% of category M.AG emissions. 2023 Emissions have changed by 1.2% (49.87 Gg CO2 / year). 1990-2023 Emissions have changed by 0.1% (4.61 Gg CO2 / year).
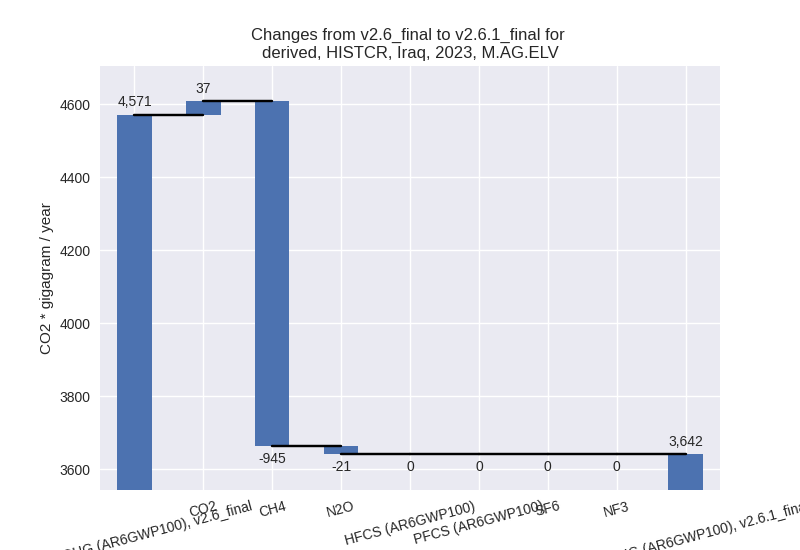
- M.AG.ELV: Total sectoral emissions in 2022 are
3609.18 Gg CO2 / year which is 46.9% of category M.AG emissions. 2023
Emissions have changed by -20.3%
(-929.00 Gg CO2 / year). 1990-2023 Emissions have changed by -0.7% (-30.81 Gg CO2 / year). For 2023 the
changes per gas
are:
There is no subsector information available in PRIMAP-hist.
- 4: Total sectoral emissions in 2022 are 11681.88 Gg
CO2 / year which is 3.3% of M.0.EL emissions. 2023 Emissions have
changed by -26.6% (-4341.49 Gg CO2 /
year). 1990-2023 Emissions have changed by -27.2% (-2765.12 Gg CO2 / year). For 2023
the changes per gas
are:

For 1990-2023 the changes per gas are:
- 5: Total sectoral emissions in 2022 are 636.96 Gg
CO2 / year which is 0.2% of M.0.EL emissions. 2023 Emissions have
changed by -19.4% (-155.63 Gg CO2 /
year). 1990-2023 Emissions have changed by -18.6% (-110.15 Gg CO2 / year). For 2023
the changes per gas
are:
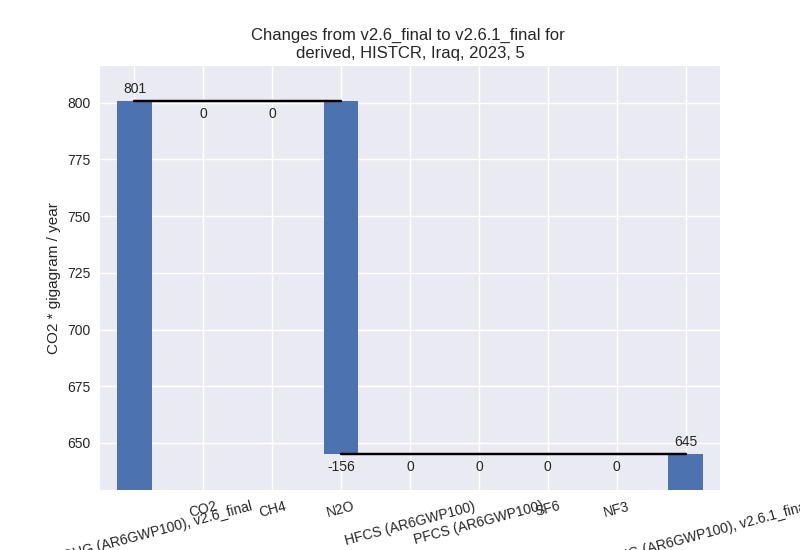
For 1990-2023 the changes per gas are:
third party scenario (HISTTP):
Most important changes per time frame
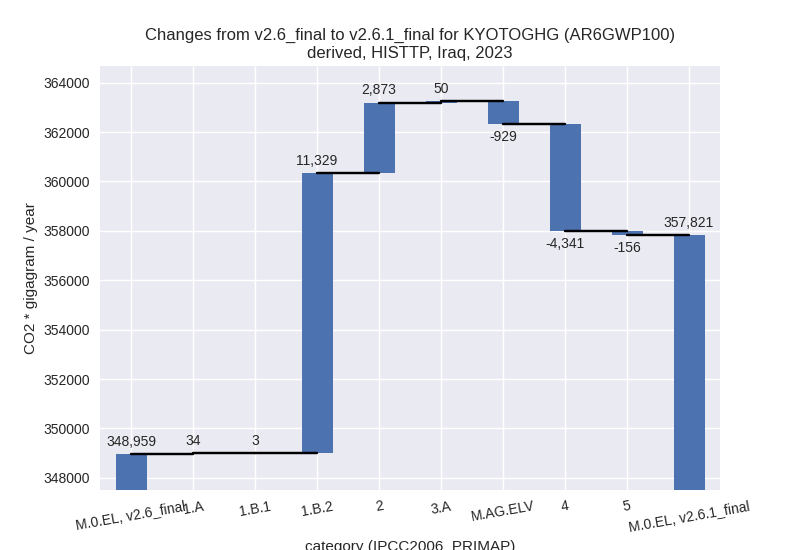
For 2023 the following sector-gas combinations have the highest absolute impact on national total KyotoGHG (AR6GWP100) emissions in 2023 (top 5):
- 1: 1.B.2, CH4 with 11322.27 Gg CO2 / year (9.2%)
- 2: 4, CH4 with -4324.77 Gg CO2 / year (-27.4%)
- 3: 2, CO2 with 2905.51 Gg CO2 / year (27.7%)
- 4: M.AG.ELV, CH4 with -944.64 Gg CO2 / year (-88.5%)
- 5: 5, N2O with -155.63 Gg CO2 / year (-19.4%)
For 1990-2023 the following sector-gas combinations have the highest absolute impact on national total KyotoGHG (AR6GWP100) emissions in 1990-2023 (top 5):
- 1: 1.B.2, CH4 with 4354.69 Gg CO2 / year (6.1%)
- 2: 4, CH4 with -2763.45 Gg CO2 / year (-28.0%)
- 3: 2, CO2 with 648.95 Gg CO2 / year (16.0%)
- 4: 5, N2O with -110.15 Gg CO2 / year (-18.6%)
- 5: M.AG.ELV, CH4 with -48.17 Gg CO2 / year (-5.9%)
Changes in the main sectors for aggregate KyotoGHG (AR6GWP100) are
- 1: Total sectoral emissions in 2022 are 315506.60
Gg CO2 / year which is 88.8% of M.0.EL emissions. 2023 Emissions have
changed by 3.7% (11365.67 Gg CO2 /
year). 1990-2023 Emissions have changed by 2.4% (4361.52 Gg CO2 / year). For 2023 the
changes per gas
are:
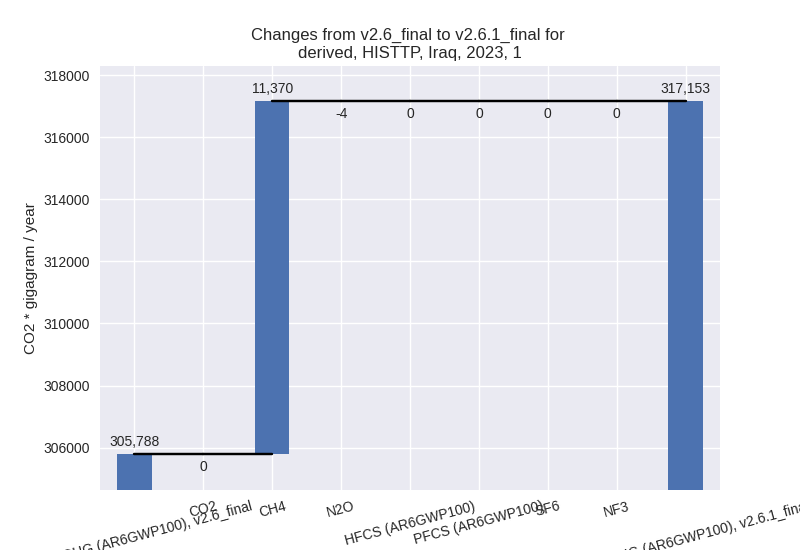
For 1990-2023 the changes per gas are:
The changes come from the following subsectors:- 1.A: Total sectoral emissions in 2022 are 140266.03 Gg CO2 / year which is 44.5% of category 1 emissions. 2023 Emissions have changed by 0.0% (33.74 Gg CO2 / year). 1990-2023 Emissions have changed by 0.0% (2.06 Gg CO2 / year).
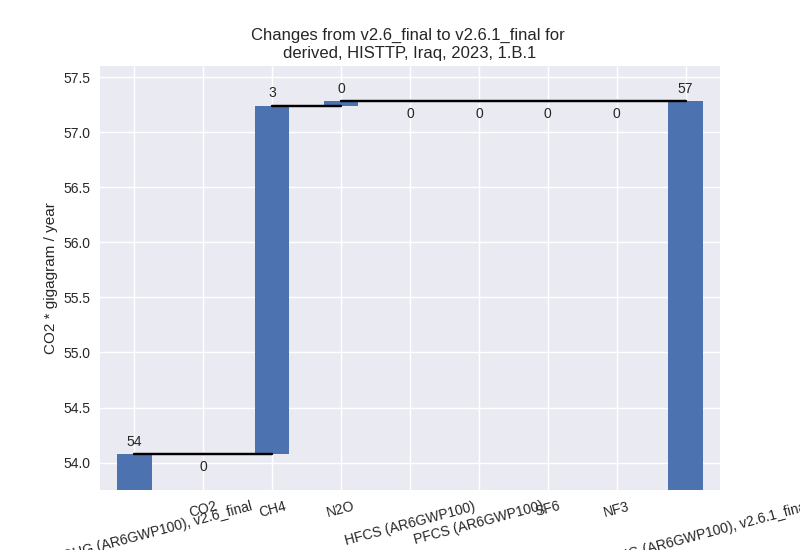
- 1.B.1: Total sectoral emissions in 2022 are 57.28
Gg CO2 / year which is 0.0% of category 1 emissions. 2023 Emissions have
changed by 5.9% (3.21 Gg CO2 /
year). 1990-2023 Emissions have changed by 1.0% (0.41 Gg CO2 / year). For 2023 the
changes per gas
are:
There is no subsector information available in PRIMAP-hist. - 1.B.2: Total sectoral emissions in 2022 are
175183.29 Gg CO2 / year which is 55.5% of category 1 emissions. 2023
Emissions have changed by 7.2%
(11328.73 Gg CO2 / year). 1990-2023 Emissions have changed by 4.9% (4359.05 Gg CO2 / year). For 2023 the
changes per gas
are:

For 1990-2023 the changes per gas are:
There is no subsector information available in PRIMAP-hist.
- 2: Total sectoral emissions in 2022 are 19832.46 Gg
CO2 / year which is 5.6% of M.0.EL emissions. 2023 Emissions have
changed by 16.6% (2872.91 Gg CO2 /
year). 1990-2023 Emissions have changed by 9.3% (646.51 Gg CO2 / year). For 2023 the
changes per gas
are:

For 1990-2023 the changes per gas are:
- M.AG: Total sectoral emissions in 2022 are 7687.57
Gg CO2 / year which is 2.2% of M.0.EL emissions. 2023 Emissions have
changed by -10.1% (-879.13 Gg CO2 /
year). 1990-2023 Emissions have changed by -0.3% (-26.19 Gg CO2 / year). For 2023 the
changes per gas
are:

The changes come from the following subsectors:- 3.A: Total sectoral emissions in 2022 are 4078.39 Gg CO2 / year which is 53.1% of category M.AG emissions. 2023 Emissions have changed by 1.2% (49.87 Gg CO2 / year). 1990-2023 Emissions have changed by 0.1% (4.61 Gg CO2 / year).
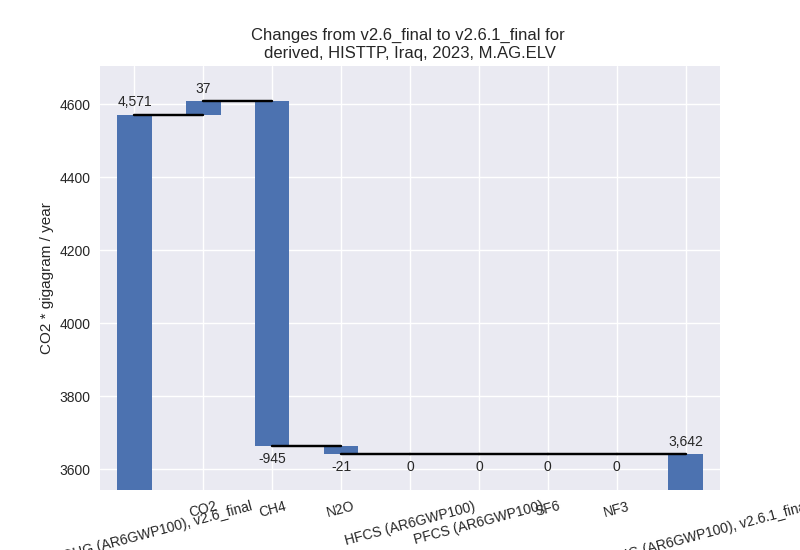
- M.AG.ELV: Total sectoral emissions in 2022 are
3609.18 Gg CO2 / year which is 46.9% of category M.AG emissions. 2023
Emissions have changed by -20.3%
(-929.00 Gg CO2 / year). 1990-2023 Emissions have changed by -0.7% (-30.81 Gg CO2 / year). For 2023 the
changes per gas
are:
There is no subsector information available in PRIMAP-hist.
- 4: Total sectoral emissions in 2022 are 11681.88 Gg
CO2 / year which is 3.3% of M.0.EL emissions. 2023 Emissions have
changed by -26.6% (-4341.49 Gg CO2 /
year). 1990-2023 Emissions have changed by -27.2% (-2765.12 Gg CO2 / year). For 2023
the changes per gas
are:

For 1990-2023 the changes per gas are: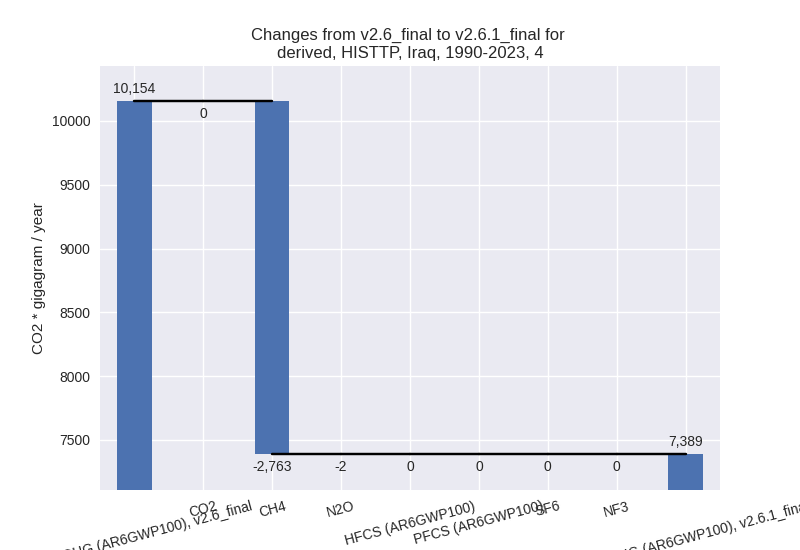
- 5: Total sectoral emissions in 2022 are 636.96 Gg
CO2 / year which is 0.2% of M.0.EL emissions. 2023 Emissions have
changed by -19.4% (-155.63 Gg CO2 /
year). 1990-2023 Emissions have changed by -18.6% (-110.15 Gg CO2 / year). For 2023
the changes per gas
are:

For 1990-2023 the changes per gas are: