Changes in PRIMAP-hist v2.6.1_final compared to v2.6_final for Iceland
2025-03-19
Johannes Gütschow
Change analysis for Iceland for PRIMAP-hist v2.6.1_final compared to v2.6_final
Overview over emissions by sector and gas
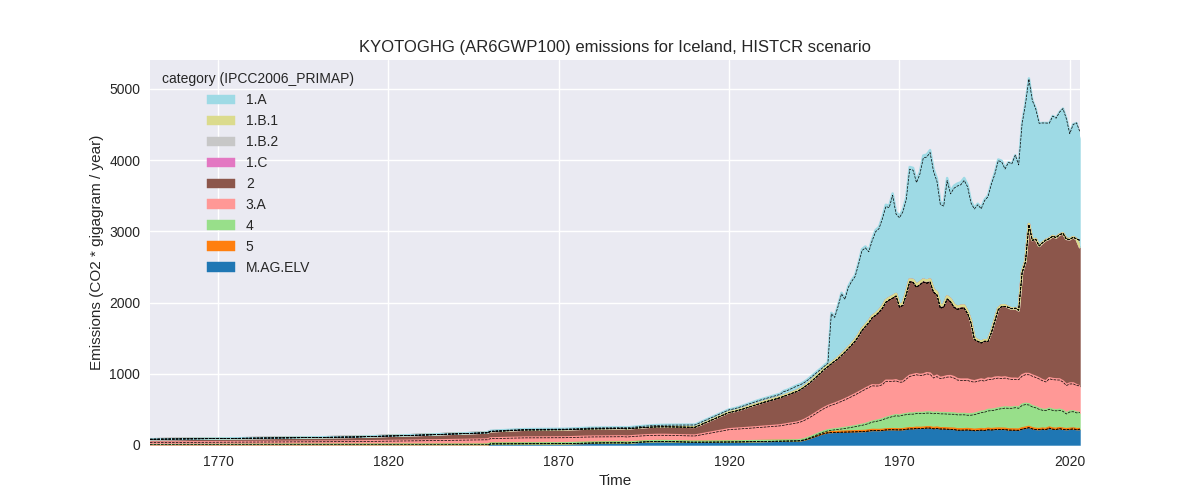
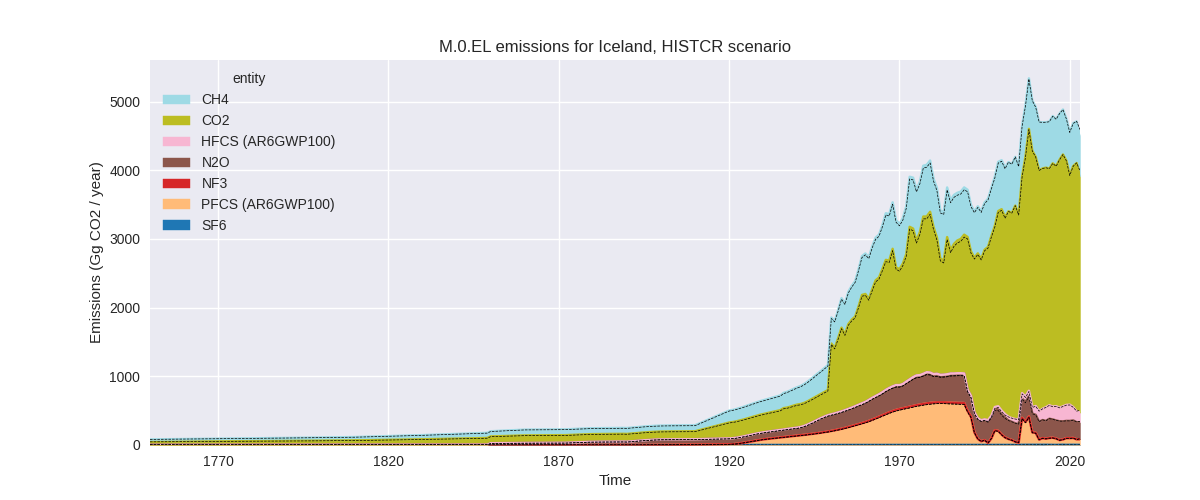
The following figures show the aggregate national total emissions excluding LULUCF AR6GWP100 for the country reported priority scenario. The dotted linesshow the v2.6_final data.
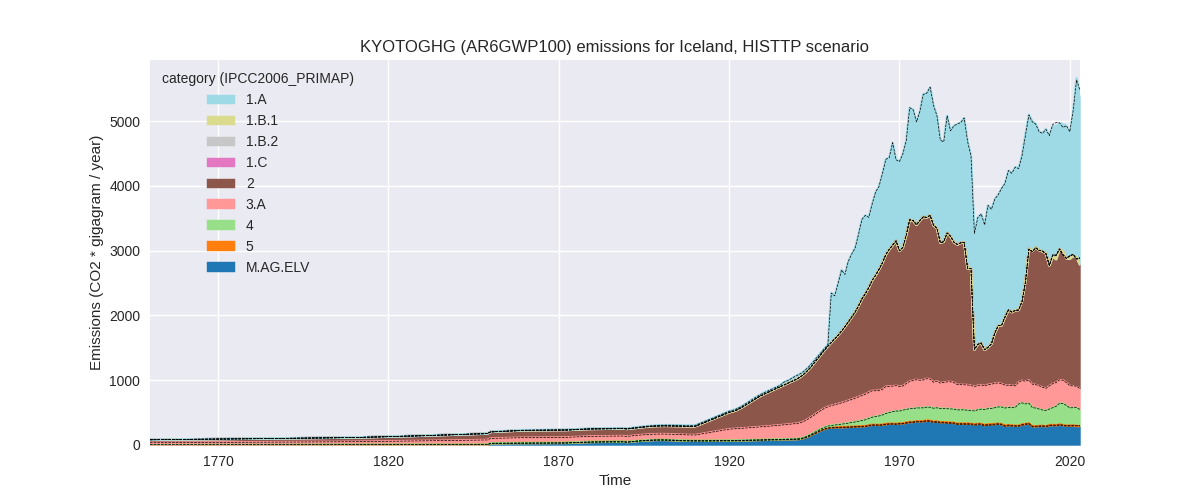
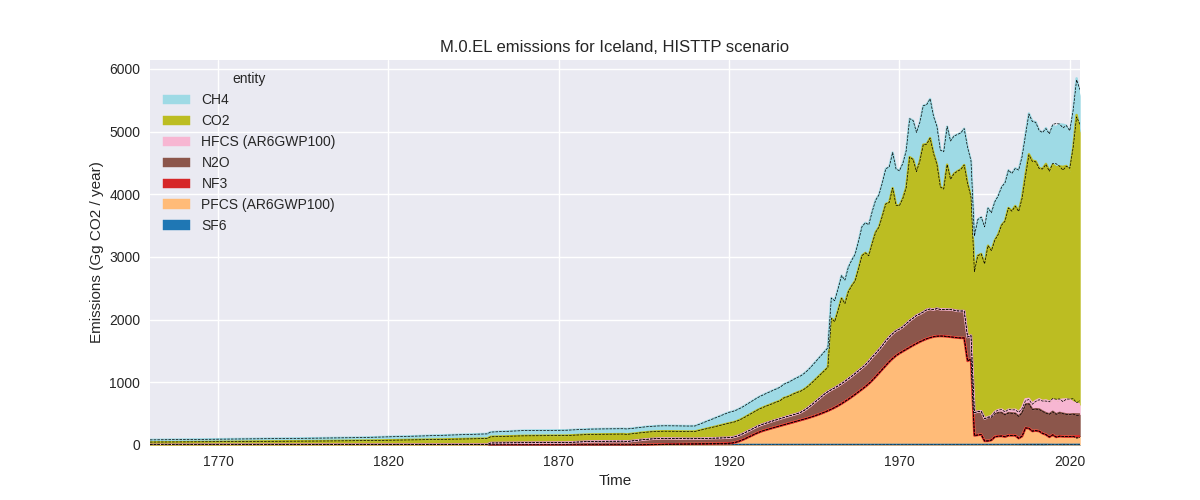
The following figures show the aggregate national total emissions excluding LULUCF AR6GWP100 for the third party priority scenario. The dotted linesshow the v2.6_final data.
Overview over changes
In the country reported priority scenario we have the following changes for aggregate Kyoto GHG and national total emissions excluding LULUCF (M.0.EL):
- Emissions in 2023 have changed by -2.1%% (-94.54 Gg CO2 / year)
- Emissions in 1990-2023 have changed by 0.1%% (5.16 Gg CO2 / year)
In the third party priority scenario we have the following changes for aggregate Kyoto GHG and national total emissions excluding LULUCF (M.0.EL):
- Emissions in 2023 have changed by -1.8%% (-104.49 Gg CO2 / year)
- Emissions in 1990-2023 have changed by -0.1%% (-5.16 Gg CO2 / year)
Most important changes per scenario and time frame
In the country reported priority scenario the following sector-gas combinations have the highest absolute impact on national total KyotoGHG (AR6GWP100) emissions in 2023 (top 5):
- 1: 2, CO2 with -50.08 Gg CO2 / year (-2.8%)
- 2: 2, HFCS (AR6GWP100) with -18.24 Gg CO2 / year (-11.5%)
- 3: 2, N2O with -10.70 Gg CO2 / year (-83.6%)
- 4: 2, PFCS (AR6GWP100) with -8.77 Gg CO2 / year (-9.8%)
- 5: 4, CH4 with -8.39 Gg CO2 / year (-3.9%)
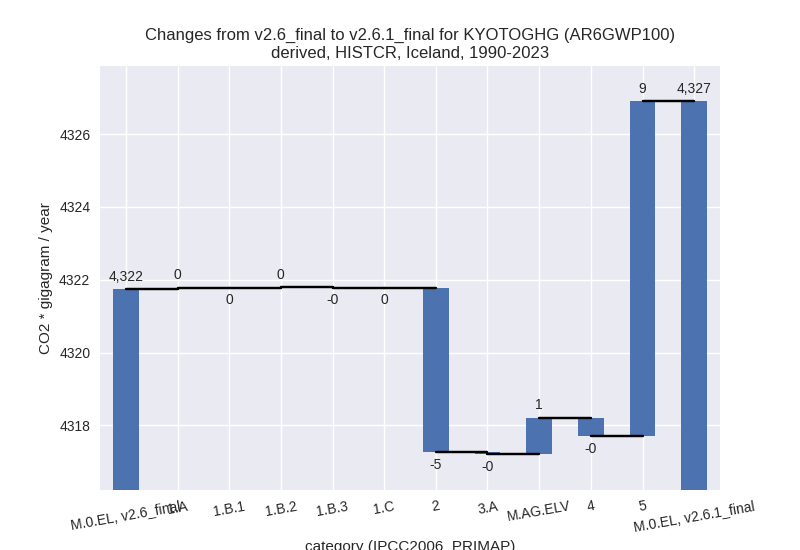
In the country reported priority scenario the following sector-gas combinations have the highest absolute impact on national total KyotoGHG (AR6GWP100) emissions in 1990-2023 (top 5):
- 1: 5, N2O with 9.18 Gg CO2 / year (inf%)
- 2: 2, N2O with -8.23 Gg CO2 / year (-34.4%)
- 3: 2, PFCS (AR6GWP100) with 4.11 Gg CO2 / year (2.9%)
- 4: 2, CO2 with -1.68 Gg CO2 / year (-0.1%)
- 5: 2, HFCS (AR6GWP100) with 1.28 Gg CO2 / year (1.3%)
In the third party priority scenario the following sector-gas combinations have the highest absolute impact on national total KyotoGHG (AR6GWP100) emissions in 2023 (top 5):
- 1: 2, HFCS (AR6GWP100) with -77.70 Gg CO2 / year (-33.4%)
- 2: 2, CO2 with -52.75 Gg CO2 / year (-3.2%)
- 3: 2, PFCS (AR6GWP100) with 20.68 Gg CO2 / year (17.7%)
- 4: 4, CH4 with 14.19 Gg CO2 / year (6.0%)
- 5: M.AG.ELV, N2O with -6.00 Gg CO2 / year (-2.1%)
In the third party priority scenario the following sector-gas combinations have the highest absolute impact on national total KyotoGHG (AR6GWP100) emissions in 1990-2023 (top 5):
- 1: 2, HFCS (AR6GWP100) with -3.70 Gg CO2 / year (-3.5%)
- 2: 4, CH4 with -2.13 Gg CO2 / year (-0.8%)
- 3: 2, PFCS (AR6GWP100) with 1.26 Gg CO2 / year (0.6%)
- 4: 2, CO2 with 0.62 Gg CO2 / year (0.1%)
- 5: M.AG.ELV, N2O with -0.40 Gg CO2 / year (-0.1%)
Notes on data changes
Here we list notes explaining important emissions changes for the country.
- CRT data has been included but replaces official data reported to the EU which does not show noteworthy differences. The main changes in 2023 are due to EDGAR growth rates replacing numerical trend calculations.
- Changes in the TP time-series have the same origin.
Changes by sector and gas
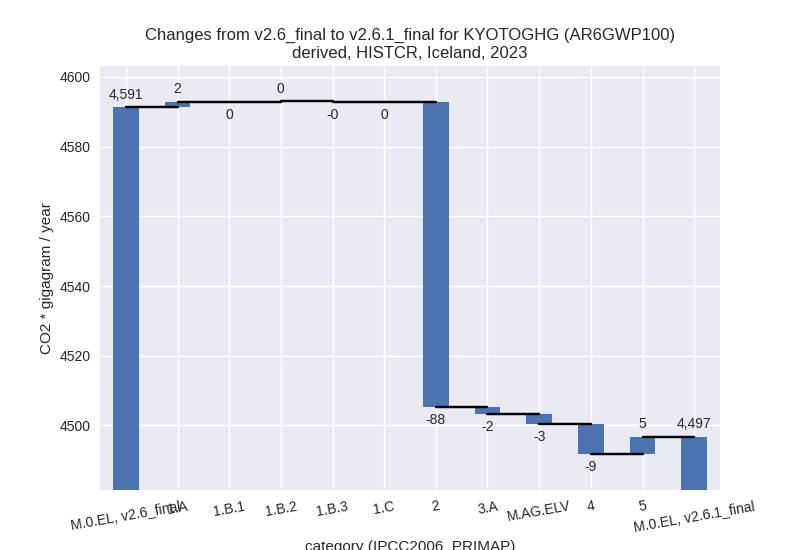
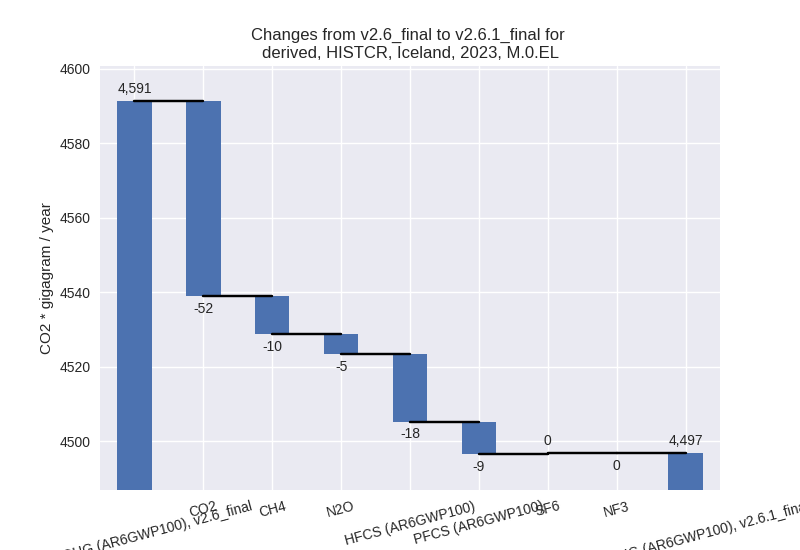
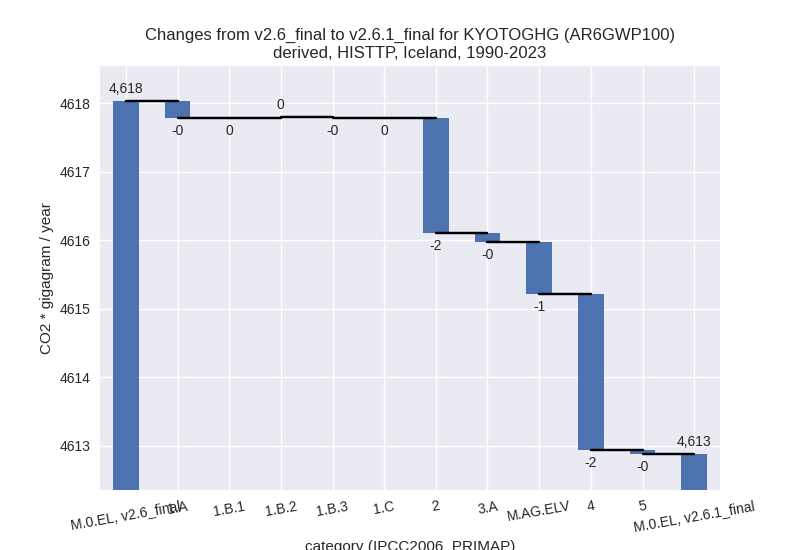
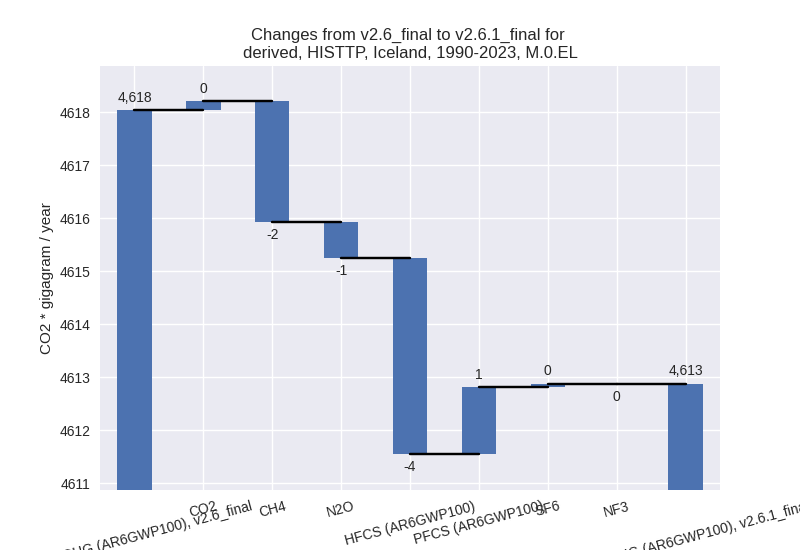
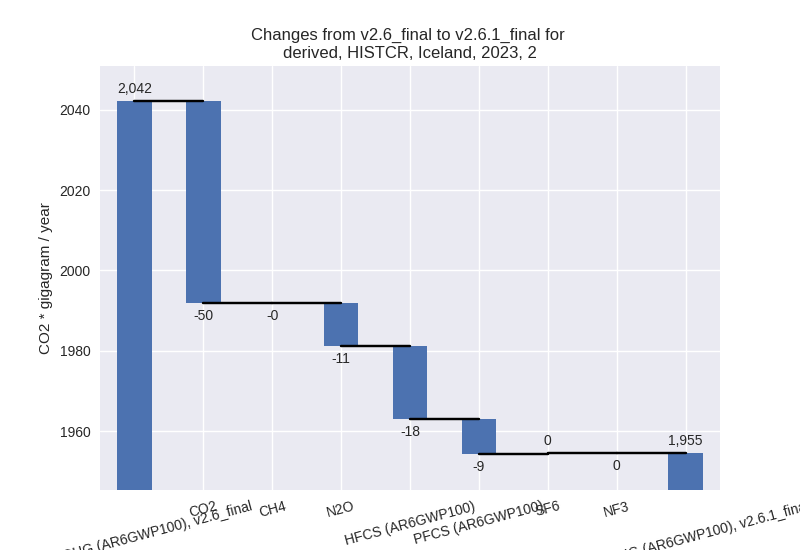
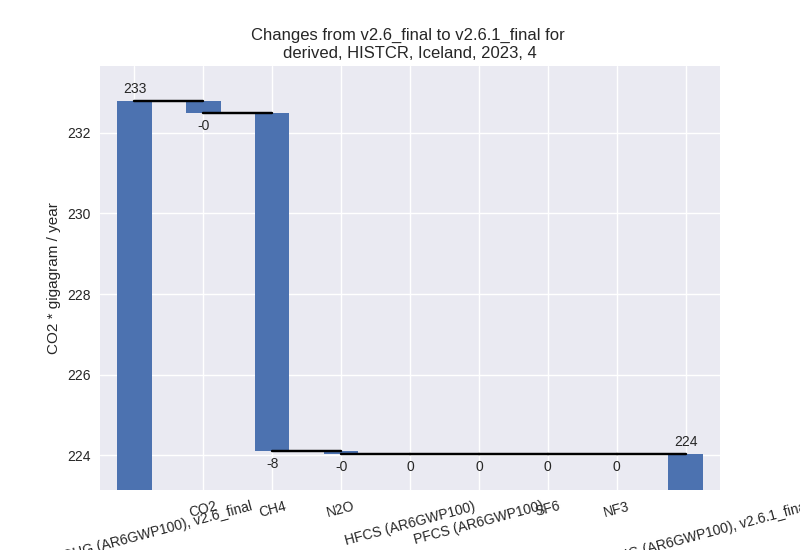
For each scenario and time frame the changes are displayed for all individual sectors and all individual gases. In the sector plot we use aggregate Kyoto GHGs in AR6GWP100. In the gas plot we usenational total emissions without LULUCF.
country reported scenario
2023
1990-2023
third party scenario
2023
1990-2023
Detailed changes for the scenarios:
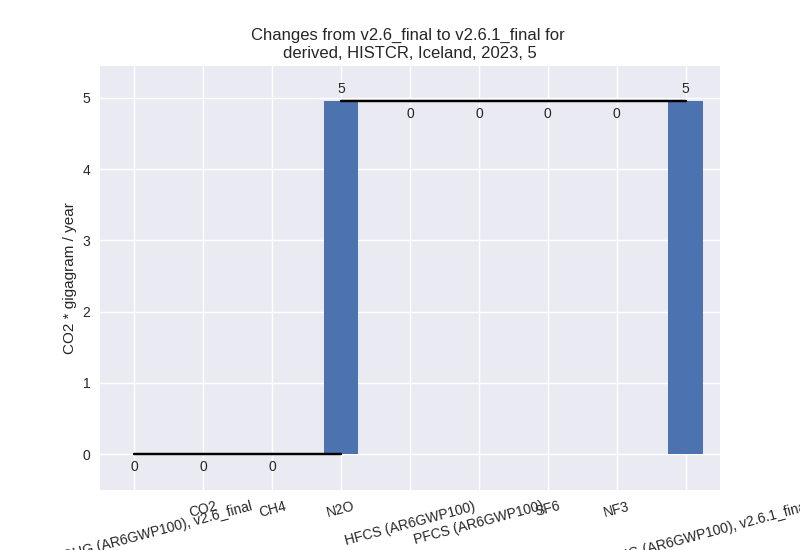
country reported scenario (HISTCR):
Most important changes per time frame
For 2023 the following sector-gas combinations have the highest absolute impact on national total KyotoGHG (AR6GWP100) emissions in 2023 (top 5):
- 1: 2, CO2 with -50.08 Gg CO2 / year (-2.8%)
- 2: 2, HFCS (AR6GWP100) with -18.24 Gg CO2 / year (-11.5%)
- 3: 2, N2O with -10.70 Gg CO2 / year (-83.6%)
- 4: 2, PFCS (AR6GWP100) with -8.77 Gg CO2 / year (-9.8%)
- 5: 4, CH4 with -8.39 Gg CO2 / year (-3.9%)
For 1990-2023 the following sector-gas combinations have the highest absolute impact on national total KyotoGHG (AR6GWP100) emissions in 1990-2023 (top 5):
- 1: 5, N2O with 9.18 Gg CO2 / year (inf%)
- 2: 2, N2O with -8.23 Gg CO2 / year (-34.4%)
- 3: 2, PFCS (AR6GWP100) with 4.11 Gg CO2 / year (2.9%)
- 4: 2, CO2 with -1.68 Gg CO2 / year (-0.1%)
- 5: 2, HFCS (AR6GWP100) with 1.28 Gg CO2 / year (1.3%)
Changes in the main sectors for aggregate KyotoGHG (AR6GWP100) are
- 1: Total sectoral emissions in 2022 are 1819.82 Gg CO2 / year which is 38.6% of M.0.EL emissions. 2023 Emissions have changed by 0.1% (1.56 Gg CO2 / year). 1990-2023 Emissions have changed by 0.0% (0.04 Gg CO2 / year).
- 2: Total sectoral emissions in 2022 are 2051.05 Gg
CO2 / year which is 43.5% of M.0.EL emissions. 2023 Emissions have
changed by -4.3% (-87.53 Gg CO2 /
year). 1990-2023 Emissions have changed by -0.3% (-4.52 Gg CO2 / year). For 2023 the
changes per gas
are:
- M.AG: Total sectoral emissions in 2022 are 601.28 Gg CO2 / year which is 12.8% of M.0.EL emissions. 2023 Emissions have changed by -0.8% (-4.78 Gg CO2 / year). 1990-2023 Emissions have changed by 0.1% (0.94 Gg CO2 / year).
- 4: Total sectoral emissions in 2022 are 233.05 Gg
CO2 / year which is 4.9% of M.0.EL emissions. 2023 Emissions have
changed by -3.8% (-8.75 Gg CO2 /
year). 1990-2023 Emissions have changed by -0.2% (-0.49 Gg CO2 / year). For 2023 the
changes per gas
are:
- 5: Total sectoral emissions in 2022 are 5.41 Gg CO2
/ year which is 0.1% of M.0.EL emissions. 2023 Emissions have changed by
inf% (4.95 Gg CO2 / year). 1990-2023
Emissions have changed by inf% (9.18
Gg CO2 / year). For 2023 the changes per gas
are:
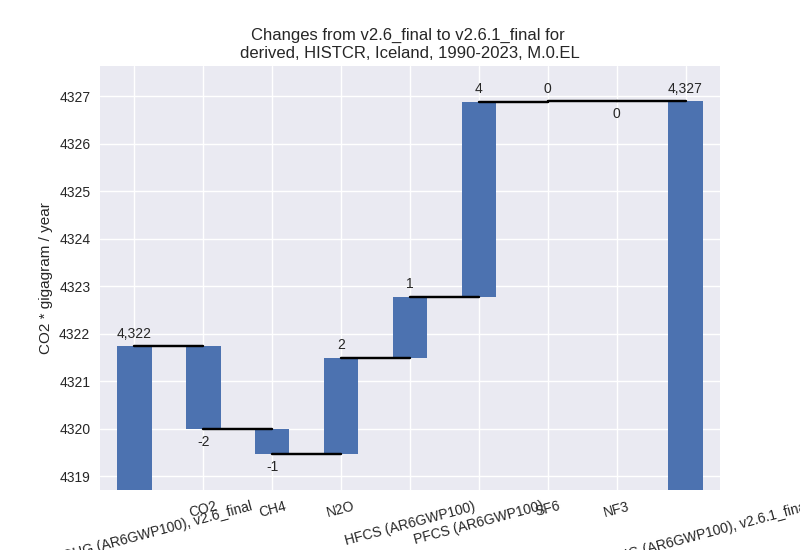
For 1990-2023 the changes per gas are: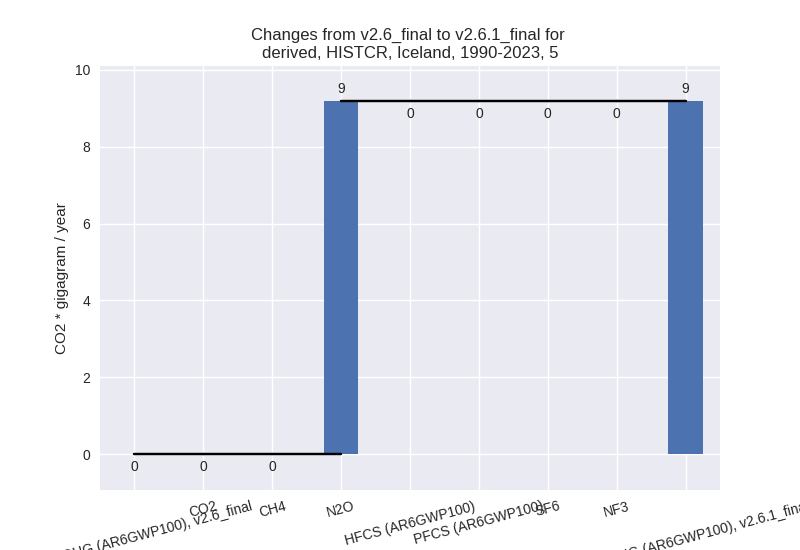
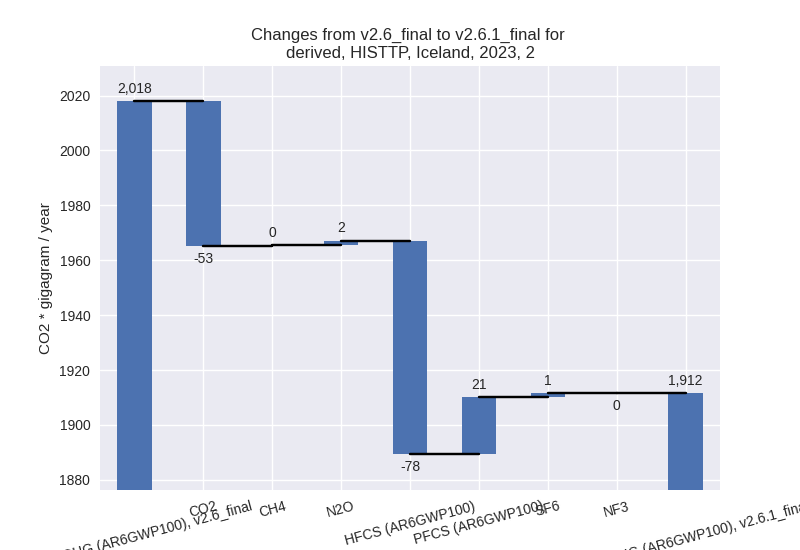
third party scenario (HISTTP):
Most important changes per time frame
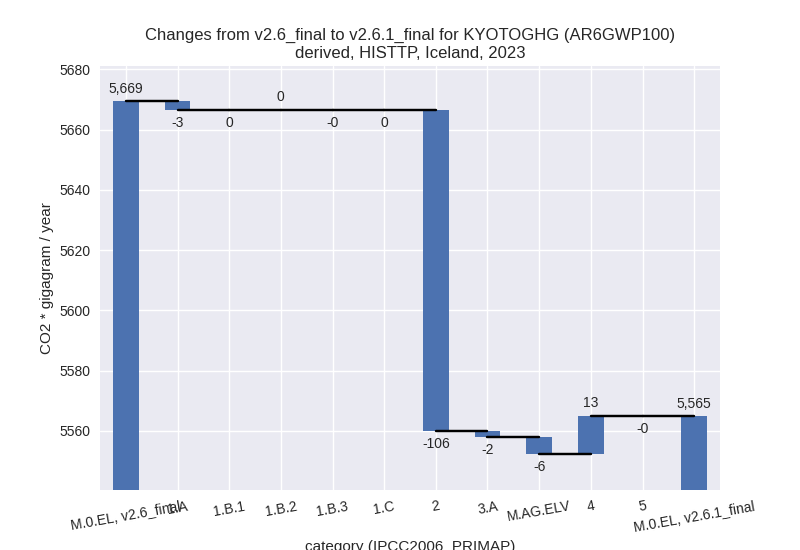
For 2023 the following sector-gas combinations have the highest absolute impact on national total KyotoGHG (AR6GWP100) emissions in 2023 (top 5):
- 1: 2, HFCS (AR6GWP100) with -77.70 Gg CO2 / year (-33.4%)
- 2: 2, CO2 with -52.75 Gg CO2 / year (-3.2%)
- 3: 2, PFCS (AR6GWP100) with 20.68 Gg CO2 / year (17.7%)
- 4: 4, CH4 with 14.19 Gg CO2 / year (6.0%)
- 5: M.AG.ELV, N2O with -6.00 Gg CO2 / year (-2.1%)
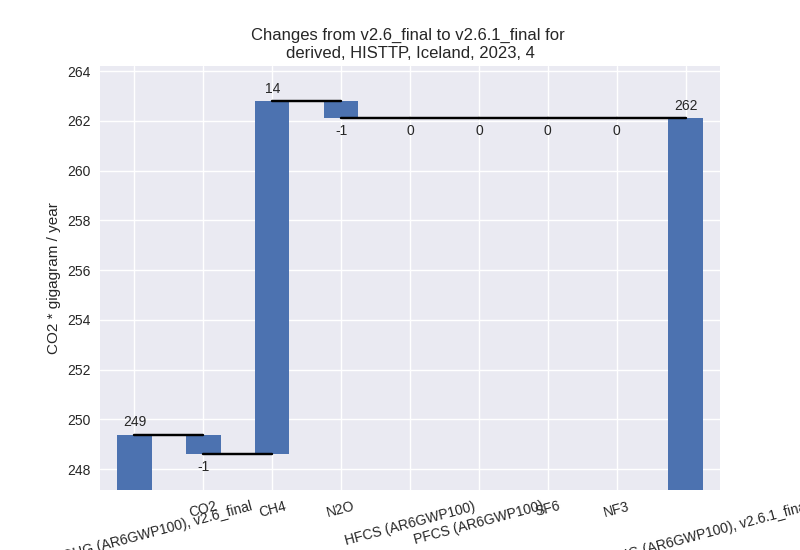
For 1990-2023 the following sector-gas combinations have the highest absolute impact on national total KyotoGHG (AR6GWP100) emissions in 1990-2023 (top 5):
- 1: 2, HFCS (AR6GWP100) with -3.70 Gg CO2 / year (-3.5%)
- 2: 4, CH4 with -2.13 Gg CO2 / year (-0.8%)
- 3: 2, PFCS (AR6GWP100) with 1.26 Gg CO2 / year (0.6%)
- 4: 2, CO2 with 0.62 Gg CO2 / year (0.1%)
- 5: M.AG.ELV, N2O with -0.40 Gg CO2 / year (-0.1%)
Changes in the main sectors for aggregate KyotoGHG (AR6GWP100) are
- 1: Total sectoral emissions in 2022 are 2953.06 Gg CO2 / year which is 50.5% of M.0.EL emissions. 2023 Emissions have changed by -0.1% (-2.90 Gg CO2 / year). 1990-2023 Emissions have changed by -0.0% (-0.24 Gg CO2 / year).
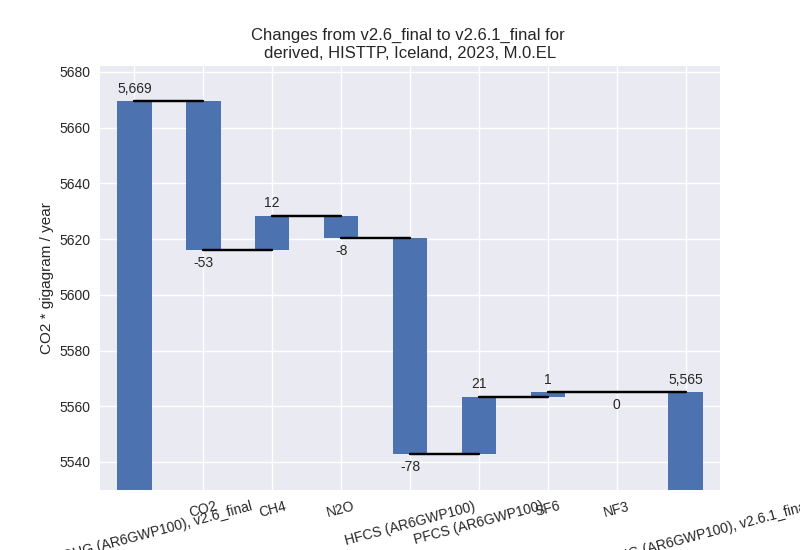
- 2: Total sectoral emissions in 2022 are 2004.44 Gg
CO2 / year which is 34.3% of M.0.EL emissions. 2023 Emissions have
changed by -5.3% (-106.40 Gg CO2 /
year). 1990-2023 Emissions have changed by -0.1% (-1.68 Gg CO2 / year). For 2023 the
changes per gas
are:
- M.AG: Total sectoral emissions in 2022 are 615.30 Gg CO2 / year which is 10.5% of M.0.EL emissions. 2023 Emissions have changed by -1.3% (-7.84 Gg CO2 / year). 1990-2023 Emissions have changed by -0.1% (-0.89 Gg CO2 / year).
- 4: Total sectoral emissions in 2022 are 272.32 Gg
CO2 / year which is 4.7% of M.0.EL emissions. 2023 Emissions have
changed by 5.1% (12.73 Gg CO2 /
year). 1990-2023 Emissions have changed by -0.8% (-2.28 Gg CO2 / year). For 2023 the
changes per gas
are:
- 5: Total sectoral emissions in 2022 are 5.41 Gg CO2 / year which is 0.1% of M.0.EL emissions. 2023 Emissions have changed by -1.5% (-0.08 Gg CO2 / year). 1990-2023 Emissions have changed by -0.7% (-0.07 Gg CO2 / year).