Changes in PRIMAP-hist v2.6.1_final compared to v2.6_final for Jamaica
2025-03-19
Johannes Gütschow
Change analysis for Jamaica for PRIMAP-hist v2.6.1_final compared to v2.6_final
Overview over emissions by sector and gas
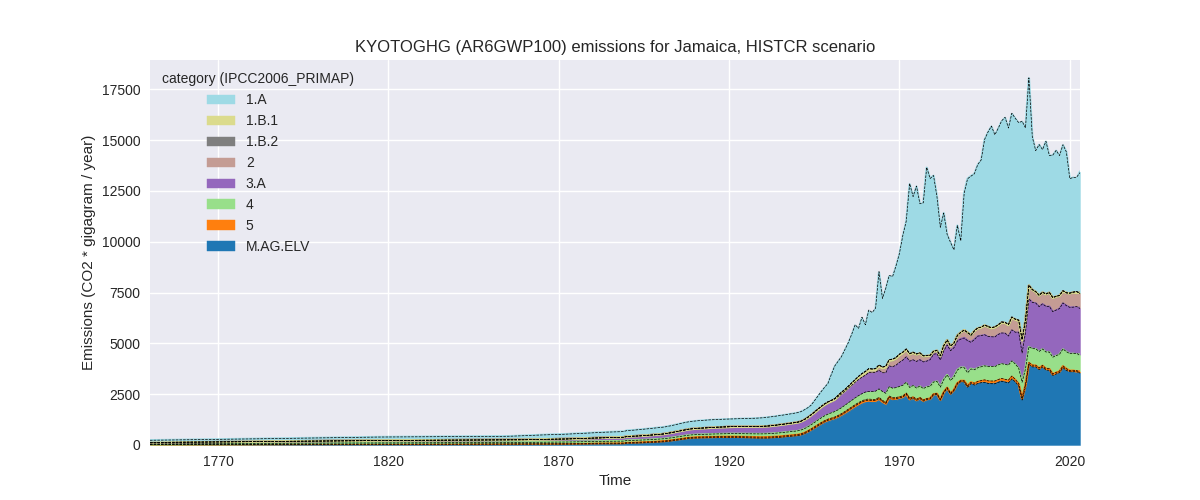
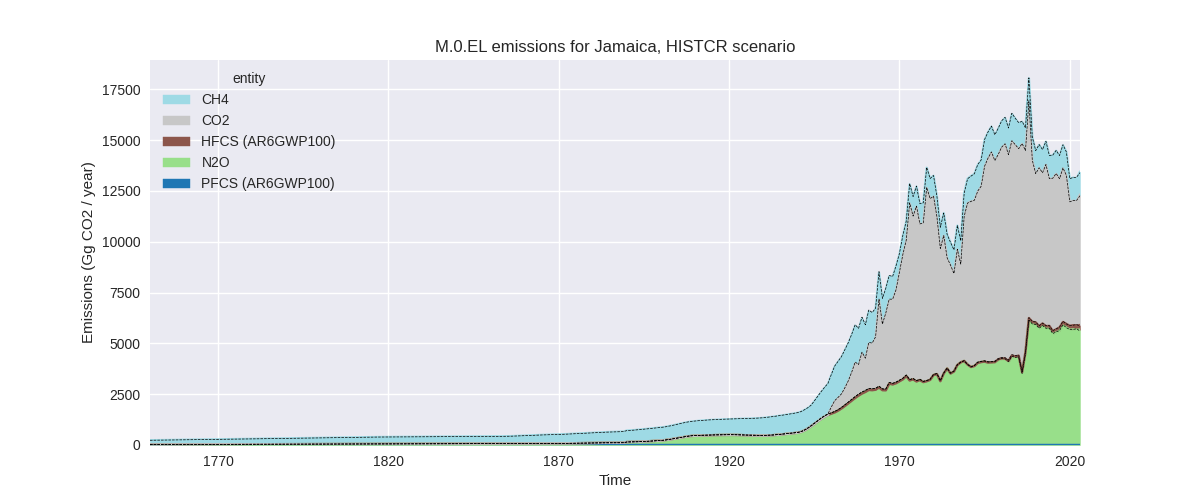
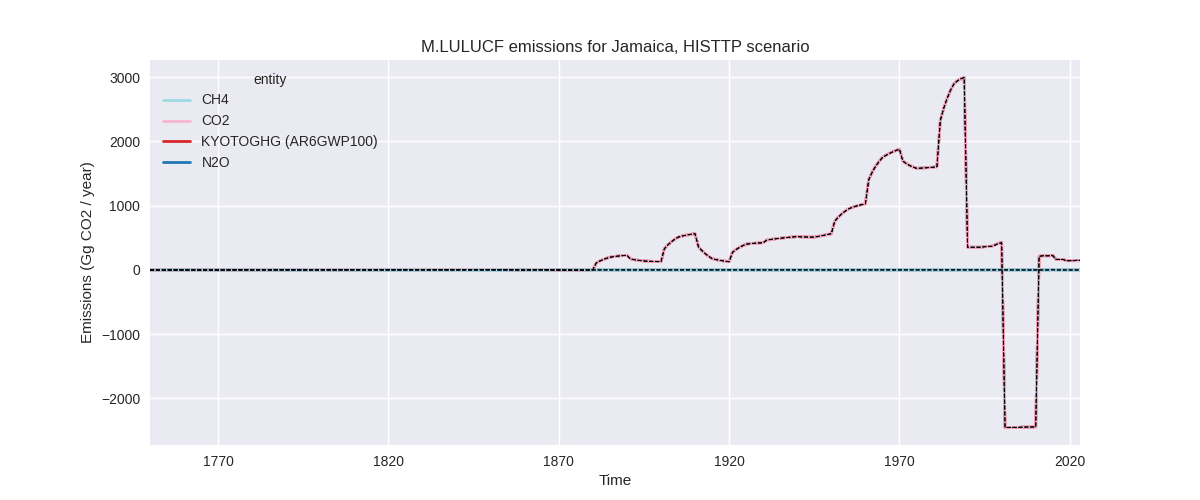
The following figures show the aggregate national total emissions excluding LULUCF AR6GWP100 for the country reported priority scenario. The dotted linesshow the v2.6_final data.
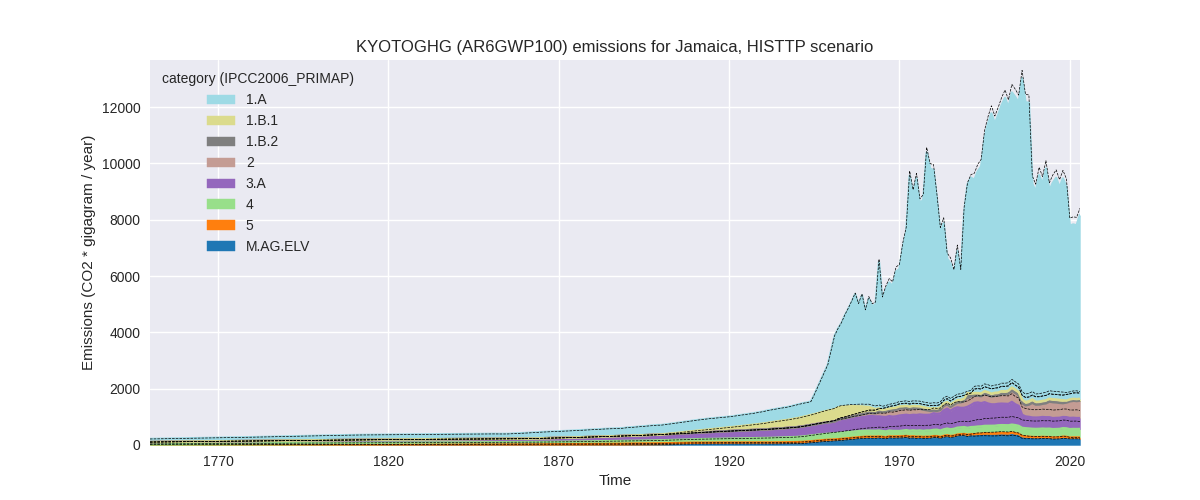
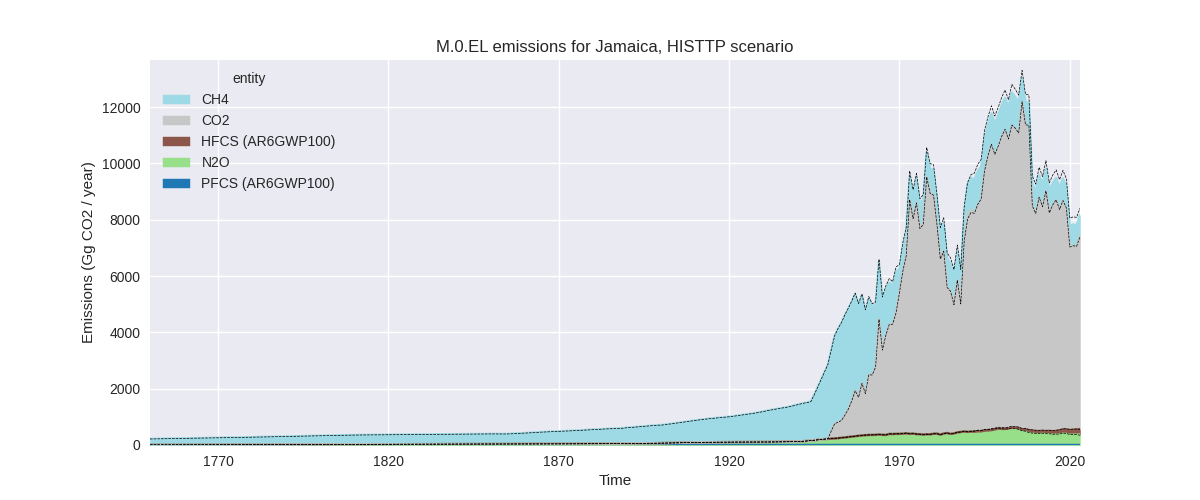
The following figures show the aggregate national total emissions excluding LULUCF AR6GWP100 for the third party priority scenario. The dotted linesshow the v2.6_final data.
Overview over changes
In the country reported priority scenario we have the following changes for aggregate Kyoto GHG and national total emissions excluding LULUCF (M.0.EL):
- Emissions in 2023 have changed by 0.4%% (47.21 Gg CO2 / year)
- Emissions in 1990-2023 have changed by -0.2%% (-22.78 Gg CO2 / year)
In the third party priority scenario we have the following changes for aggregate Kyoto GHG and national total emissions excluding LULUCF (M.0.EL):
- Emissions in 2023 have changed by -2.9%% (-239.65 Gg CO2 / year)
- Emissions in 1990-2023 have changed by -2.5%% (-265.92 Gg CO2 / year)
Most important changes per scenario and time frame
In the country reported priority scenario the following sector-gas combinations have the highest absolute impact on national total KyotoGHG (AR6GWP100) emissions in 2023 (top 5):
- 1: M.AG.ELV, N2O with 41.51 Gg CO2 / year (1.2%)
- 2: 1.A, N2O with 12.61 Gg CO2 / year (33.2%)
- 3: 5, N2O with 11.87 Gg CO2 / year (31.3%)
- 4: 3.A, CH4 with -10.83 Gg CO2 / year (-3.2%)
- 5: 4, CH4 with -7.97 Gg CO2 / year (-1.0%)
In the country reported priority scenario the following sector-gas combinations have the highest absolute impact on national total KyotoGHG (AR6GWP100) emissions in 1990-2023 (top 5):
- 1: 5, N2O with -25.49 Gg CO2 / year (-27.0%)
- 2: 4, CH4 with 3.59 Gg CO2 / year (0.5%)
- 3: 2, HFCS (AR6GWP100) with -1.08 Gg CO2 / year (-1.1%)
- 4: 2, CO2 with -0.69 Gg CO2 / year (-0.1%)
- 5: 1.A, N2O with 0.66 Gg CO2 / year (1.3%)
In the third party priority scenario the following sector-gas combinations have the highest absolute impact on national total KyotoGHG (AR6GWP100) emissions in 2023 (top 5):
- 1: 4, CH4 with -272.77 Gg CO2 / year (-50.8%)
- 2: 1.B.1, CH4 with 14.33 Gg CO2 / year (27.3%)
- 3: 3.A, CH4 with -11.94 Gg CO2 / year (-3.2%)
- 4: 5, N2O with 11.87 Gg CO2 / year (31.3%)
- 5: 1.A, N2O with 9.72 Gg CO2 / year (32.7%)
In the third party priority scenario the following sector-gas combinations have the highest absolute impact on national total KyotoGHG (AR6GWP100) emissions in 1990-2023 (top 5):
- 1: 4, CH4 with -247.47 Gg CO2 / year (-49.8%)
- 2: 5, N2O with -25.49 Gg CO2 / year (-27.0%)
- 3: 1.B.2, CO2 with 8.92 Gg CO2 / year (1166231.5%)
- 4: 2, HFCS (AR6GWP100) with -0.97 Gg CO2 / year (-1.1%)
- 5: 2, CO2 with -0.69 Gg CO2 / year (-0.2%)
Notes on data changes
Here we list notes explaining important emissions changes for the country.
- No new country reported data has been included. Changes in the CR time-series are small and come from updated third party data (EDGAR, FAO) which is used to extrapolate the country reported data.
- Changes in the TP time-series come from updated EDGAR and FAO data. FAO has adjusted data for the latest years while EDGAR has updated full time-series with the 90% of the total change coming from the waste sector.
Changes by sector and gas
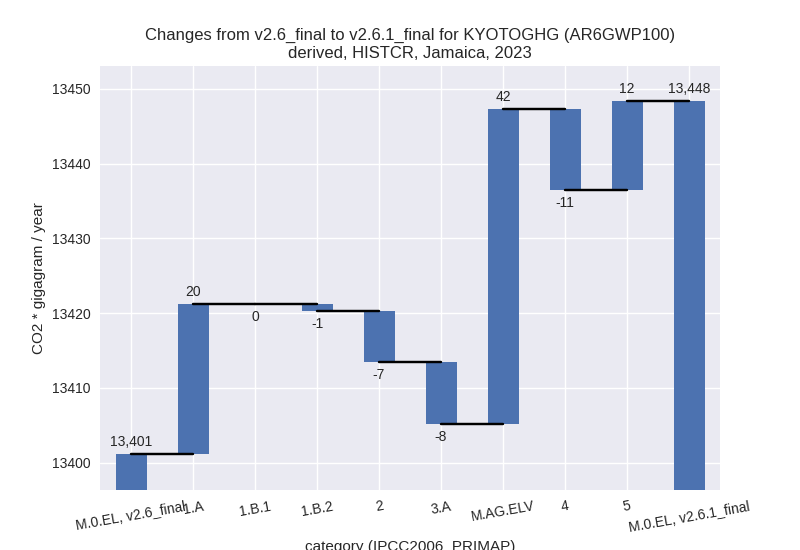
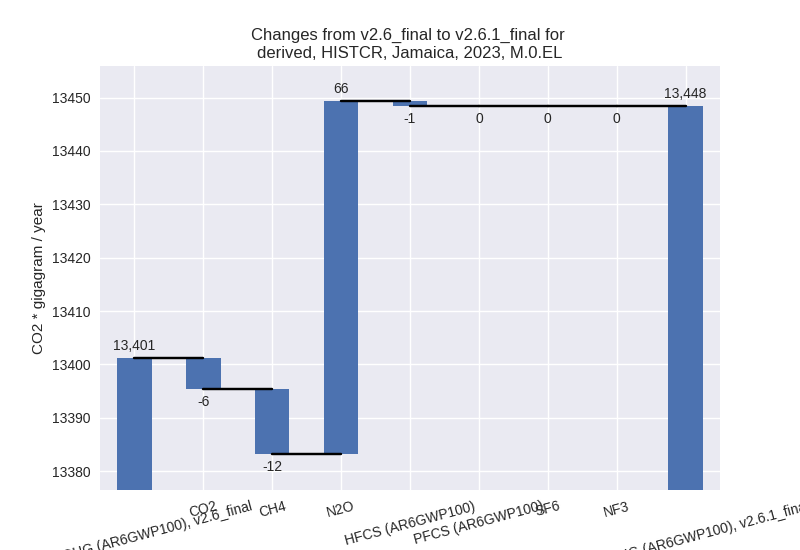
For each scenario and time frame the changes are displayed for all individual sectors and all individual gases. In the sector plot we use aggregate Kyoto GHGs in AR6GWP100. In the gas plot we usenational total emissions without LULUCF.
country reported scenario
2023
1990-2023
third party scenario
2023
1990-2023
Detailed changes for the scenarios:
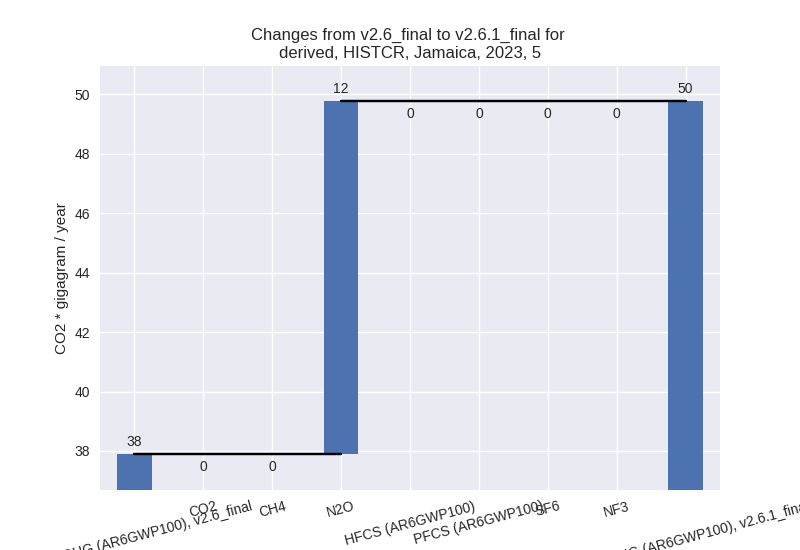
country reported scenario (HISTCR):
Most important changes per time frame
For 2023 the following sector-gas combinations have the highest absolute impact on national total KyotoGHG (AR6GWP100) emissions in 2023 (top 5):
- 1: M.AG.ELV, N2O with 41.51 Gg CO2 / year (1.2%)
- 2: 1.A, N2O with 12.61 Gg CO2 / year (33.2%)
- 3: 5, N2O with 11.87 Gg CO2 / year (31.3%)
- 4: 3.A, CH4 with -10.83 Gg CO2 / year (-3.2%)
- 5: 4, CH4 with -7.97 Gg CO2 / year (-1.0%)
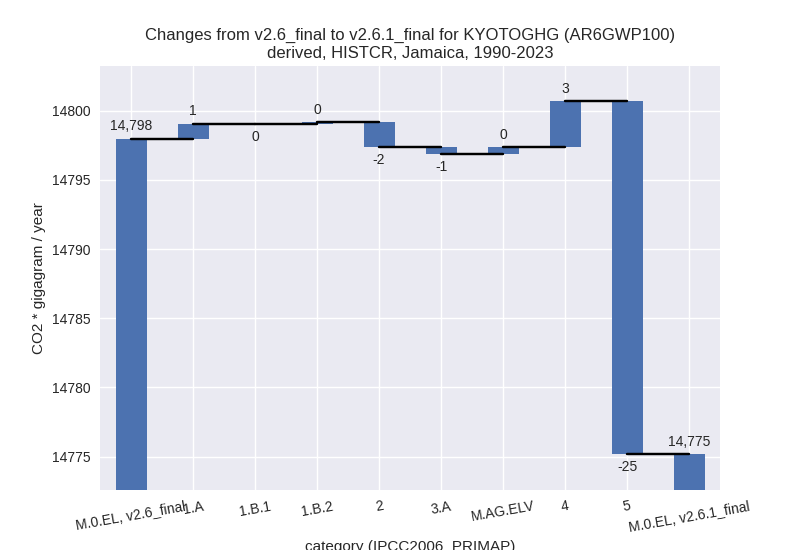
For 1990-2023 the following sector-gas combinations have the highest absolute impact on national total KyotoGHG (AR6GWP100) emissions in 1990-2023 (top 5):
- 1: 5, N2O with -25.49 Gg CO2 / year (-27.0%)
- 2: 4, CH4 with 3.59 Gg CO2 / year (0.5%)
- 3: 2, HFCS (AR6GWP100) with -1.08 Gg CO2 / year (-1.1%)
- 4: 2, CO2 with -0.69 Gg CO2 / year (-0.1%)
- 5: 1.A, N2O with 0.66 Gg CO2 / year (1.3%)
Changes in the main sectors for aggregate KyotoGHG (AR6GWP100) are
- 1: Total sectoral emissions in 2022 are 5633.43 Gg CO2 / year which is 43.0% of M.0.EL emissions. 2023 Emissions have changed by 0.3% (19.18 Gg CO2 / year). 1990-2023 Emissions have changed by 0.0% (1.20 Gg CO2 / year).
- 2: Total sectoral emissions in 2022 are 724.11 Gg CO2 / year which is 5.5% of M.0.EL emissions. 2023 Emissions have changed by -0.9% (-6.88 Gg CO2 / year). 1990-2023 Emissions have changed by -0.3% (-1.78 Gg CO2 / year).
- M.AG: Total sectoral emissions in 2022 are 5864.15 Gg CO2 / year which is 44.8% of M.0.EL emissions. 2023 Emissions have changed by 0.6% (33.86 Gg CO2 / year). 1990-2023 Emissions have changed by -0.0% (-0.04 Gg CO2 / year).
- 4: Total sectoral emissions in 2022 are 831.34 Gg CO2 / year which is 6.3% of M.0.EL emissions. 2023 Emissions have changed by -1.3% (-10.81 Gg CO2 / year). 1990-2023 Emissions have changed by 0.4% (3.33 Gg CO2 / year).
- 5: Total sectoral emissions in 2022 are 47.25 Gg
CO2 / year which is 0.4% of M.0.EL emissions. 2023 Emissions have
changed by 31.3% (11.87 Gg CO2 /
year). 1990-2023 Emissions have changed by -27.0% (-25.49 Gg CO2 / year). For 2023
the changes per gas
are:
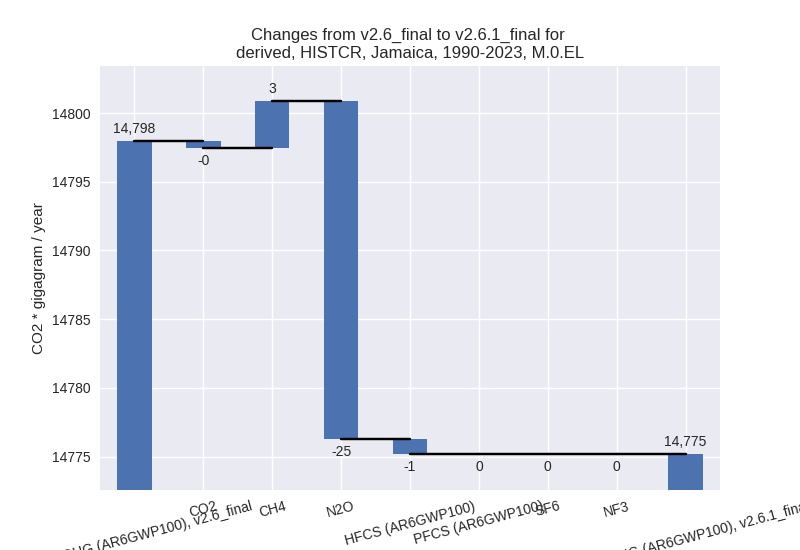
For 1990-2023 the changes per gas are: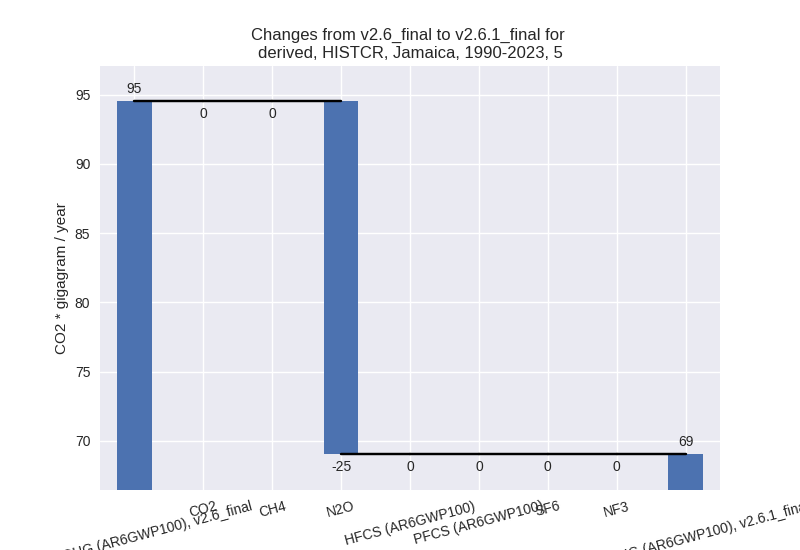
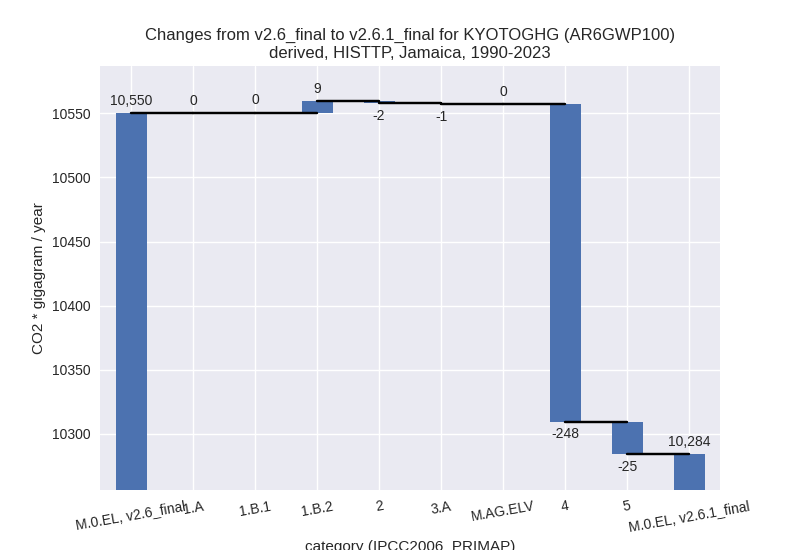
third party scenario (HISTTP):
Most important changes per time frame
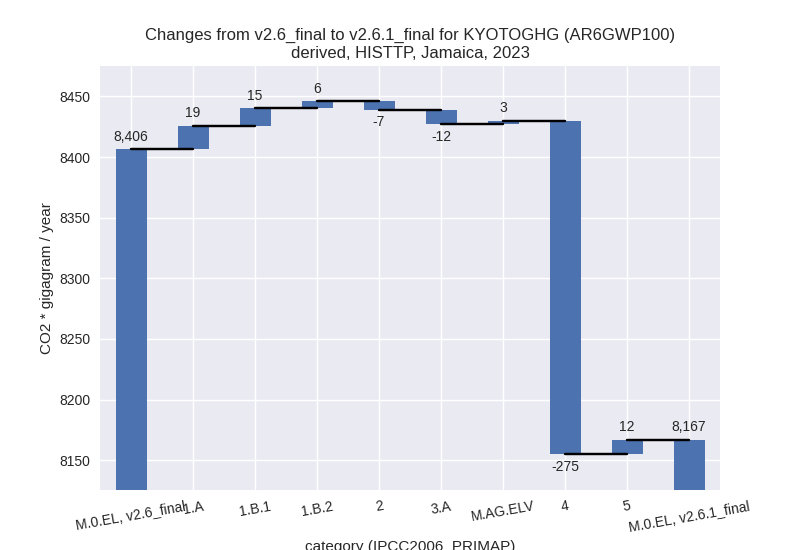
For 2023 the following sector-gas combinations have the highest absolute impact on national total KyotoGHG (AR6GWP100) emissions in 2023 (top 5):
- 1: 4, CH4 with -272.77 Gg CO2 / year (-50.8%)
- 2: 1.B.1, CH4 with 14.33 Gg CO2 / year (27.3%)
- 3: 3.A, CH4 with -11.94 Gg CO2 / year (-3.2%)
- 4: 5, N2O with 11.87 Gg CO2 / year (31.3%)
- 5: 1.A, N2O with 9.72 Gg CO2 / year (32.7%)
For 1990-2023 the following sector-gas combinations have the highest absolute impact on national total KyotoGHG (AR6GWP100) emissions in 1990-2023 (top 5):
- 1: 4, CH4 with -247.47 Gg CO2 / year (-49.8%)
- 2: 5, N2O with -25.49 Gg CO2 / year (-27.0%)
- 3: 1.B.2, CO2 with 8.92 Gg CO2 / year (1166231.5%)
- 4: 2, HFCS (AR6GWP100) with -0.97 Gg CO2 / year (-1.1%)
- 5: 2, CO2 with -0.69 Gg CO2 / year (-0.2%)
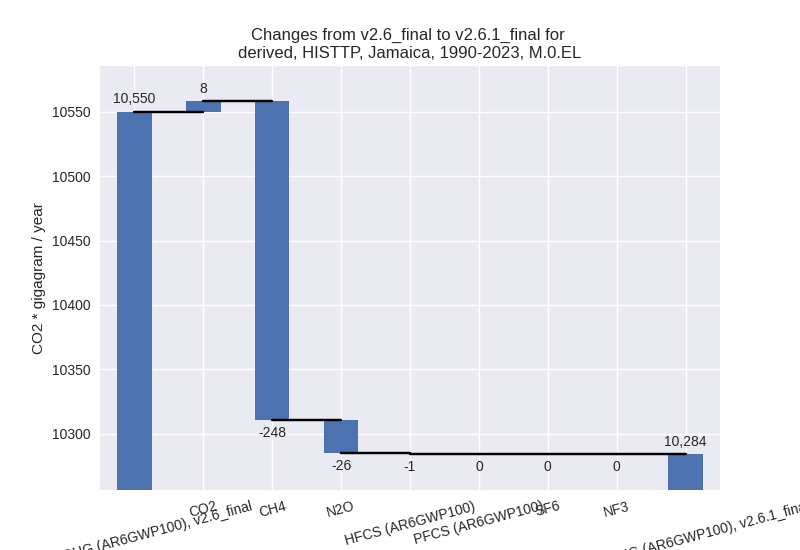
Changes in the main sectors for aggregate KyotoGHG (AR6GWP100) are
- 1: Total sectoral emissions in 2022 are 6245.35 Gg CO2 / year which is 80.1% of M.0.EL emissions. 2023 Emissions have changed by 0.6% (39.52 Gg CO2 / year). 1990-2023 Emissions have changed by 0.1% (9.52 Gg CO2 / year).
- 2: Total sectoral emissions in 2022 are 592.49 Gg CO2 / year which is 7.6% of M.0.EL emissions. 2023 Emissions have changed by -1.1% (-6.78 Gg CO2 / year). 1990-2023 Emissions have changed by -0.4% (-1.66 Gg CO2 / year).
- M.AG: Total sectoral emissions in 2022 are 606.02 Gg CO2 / year which is 7.8% of M.0.EL emissions. 2023 Emissions have changed by -1.5% (-9.21 Gg CO2 / year). 1990-2023 Emissions have changed by -0.1% (-0.59 Gg CO2 / year).
- 4: Total sectoral emissions in 2022 are 302.13 Gg
CO2 / year which is 3.9% of M.0.EL emissions. 2023 Emissions have
changed by -47.6% (-275.05 Gg CO2 /
year). 1990-2023 Emissions have changed by -46.5% (-247.70 Gg CO2 / year). For 2023
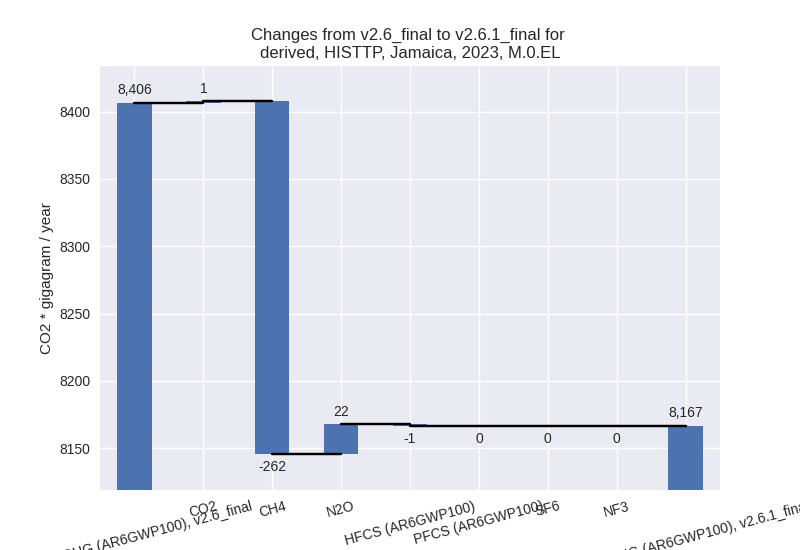
the changes per gas
are:

For 1990-2023 the changes per gas are: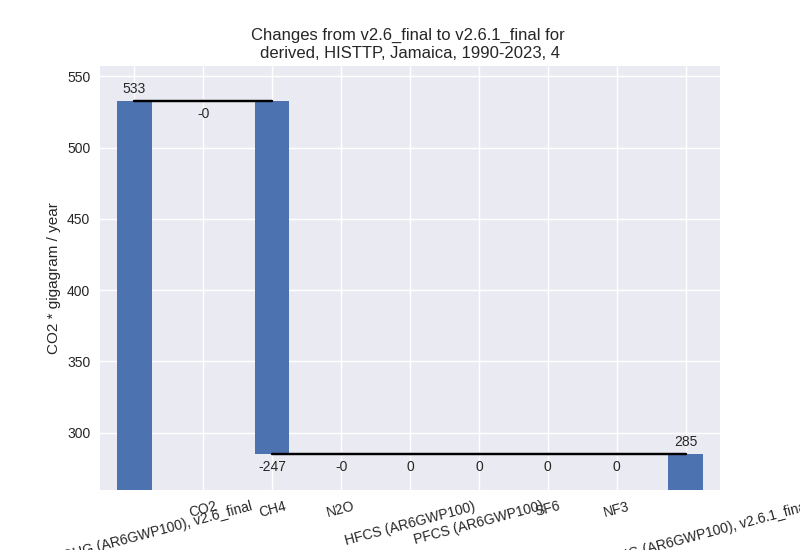
- 5: Total sectoral emissions in 2022 are 47.25 Gg
CO2 / year which is 0.6% of M.0.EL emissions. 2023 Emissions have
changed by 31.3% (11.87 Gg CO2 /
year). 1990-2023 Emissions have changed by -27.0% (-25.49 Gg CO2 / year). For 2023
the changes per gas
are:

For 1990-2023 the changes per gas are: