Changes in PRIMAP-hist v2.6.1_final compared to v2.6_final for Japan
2025-03-19
Johannes Gütschow
Change analysis for Japan for PRIMAP-hist v2.6.1_final compared to v2.6_final
Overview over emissions by sector and gas
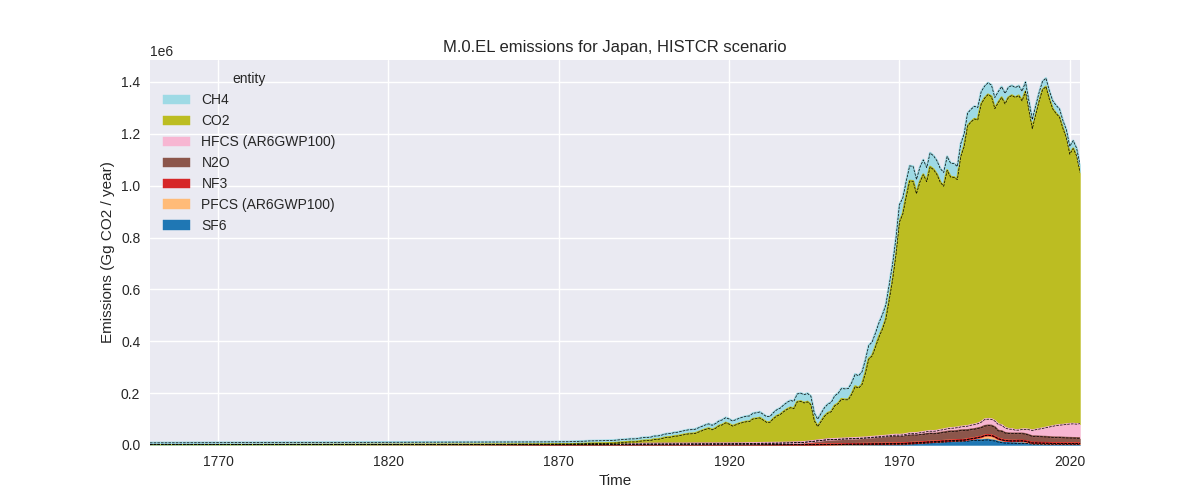
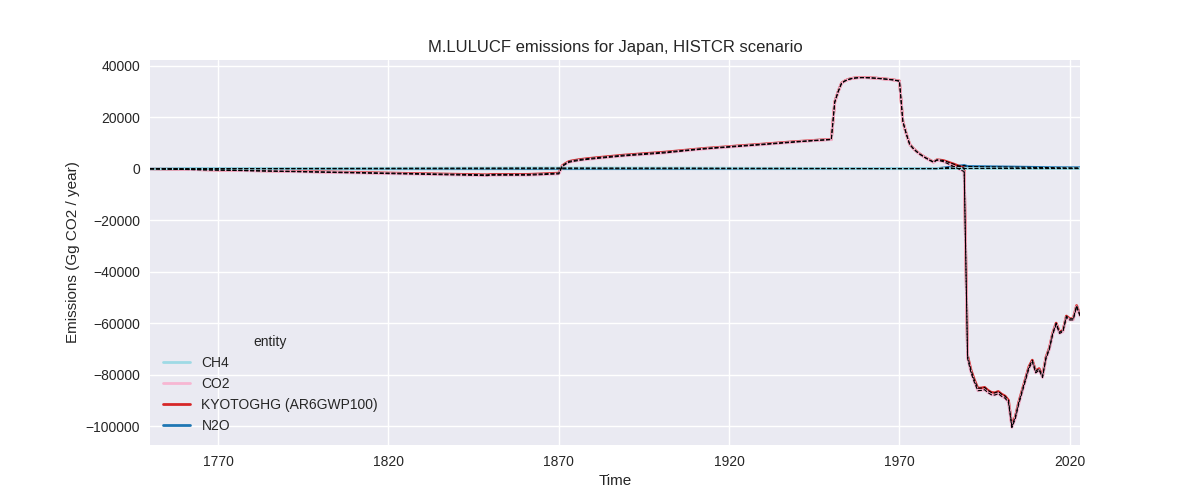
The following figures show the aggregate national total emissions excluding LULUCF AR6GWP100 for the country reported priority scenario. The dotted linesshow the v2.6_final data.

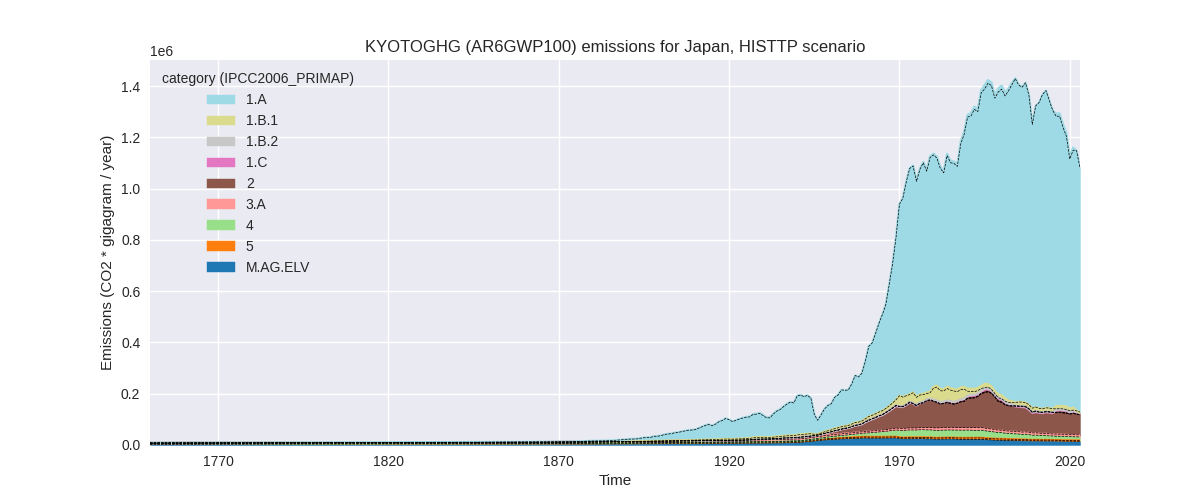
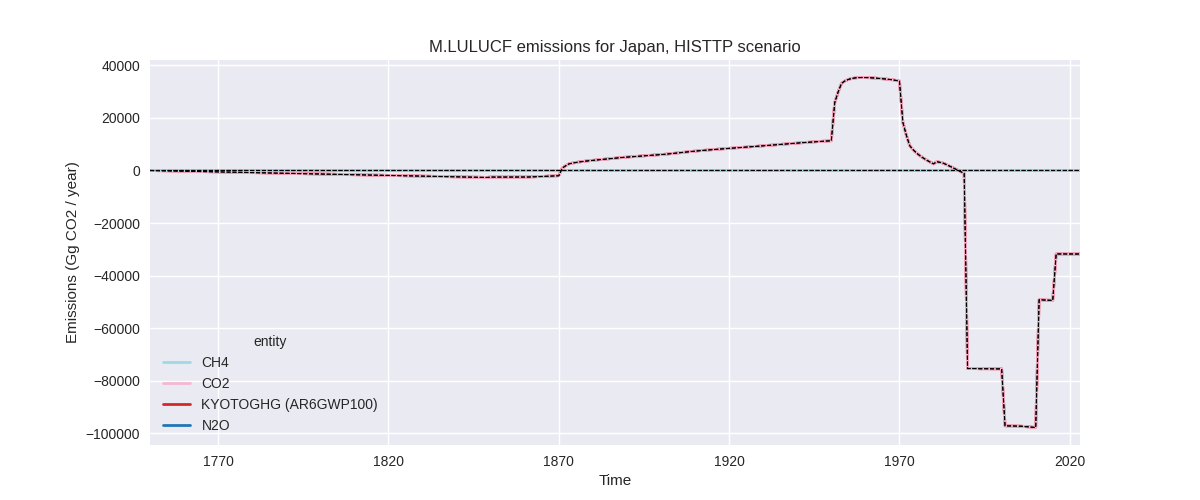
The following figures show the aggregate national total emissions excluding LULUCF AR6GWP100 for the third party priority scenario. The dotted linesshow the v2.6_final data.

Overview over changes
In the country reported priority scenario we have the following changes for aggregate Kyoto GHG and national total emissions excluding LULUCF (M.0.EL):
- Emissions in 2023 have changed by -0.1%% (-1513.60 Gg CO2 / year)
- Emissions in 1990-2023 have changed by -0.0%% (-328.54 Gg CO2 / year)
In the third party priority scenario we have the following changes for aggregate Kyoto GHG and national total emissions excluding LULUCF (M.0.EL):
- Emissions in 2023 have changed by -0.2%% (-2700.60 Gg CO2 / year)
- Emissions in 1990-2023 have changed by 0.4%% (5811.47 Gg CO2 / year)
Most important changes per scenario and time frame
In the country reported priority scenario the following sector-gas combinations have the highest absolute impact on national total KyotoGHG (AR6GWP100) emissions in 2023 (top 5):
- 1: 2, HFCS (AR6GWP100) with -1499.32 Gg CO2 / year (-2.7%)
- 2: 3.A, N2O with -1012.33 Gg CO2 / year (-28.6%)
- 3: M.AG.ELV, N2O with 964.39 Gg CO2 / year (18.1%)
- 4: 2, CO2 with 740.03 Gg CO2 / year (2.0%)
- 5: 5, N2O with -505.60 Gg CO2 / year (-19.8%)
In the country reported priority scenario the following sector-gas combinations have the highest absolute impact on national total KyotoGHG (AR6GWP100) emissions in 1990-2023 (top 5):
- 1: 3.A, N2O with -1139.78 Gg CO2 / year (-30.4%)
- 2: M.AG.ELV, N2O with 1138.37 Gg CO2 / year (19.6%)
- 3: 5, N2O with -326.24 Gg CO2 / year (-8.2%)
- 4: 2, CO2 with 21.77 Gg CO2 / year (0.0%)
- 5: 2, HFCS (AR6GWP100) with -19.57 Gg CO2 / year (-0.1%)
In the third party priority scenario the following sector-gas combinations have the highest absolute impact on national total KyotoGHG (AR6GWP100) emissions in 2023 (top 5):
- 1: 1.B.1, CO2 with -8975.92 Gg CO2 / year (-99.9%)
- 2: 2, CO2 with 7749.32 Gg CO2 / year (15.4%)
- 3: 4, CH4 with -1862.62 Gg CO2 / year (-22.4%)
- 4: 2, SF6 with 855.08 Gg CO2 / year (43.6%)
- 5: 4, CO2 with -669.93 Gg CO2 / year (-17.2%)
In the third party priority scenario the following sector-gas combinations have the highest absolute impact on national total KyotoGHG (AR6GWP100) emissions in 1990-2023 (top 5):
- 1: 2, HFCS (AR6GWP100) with 4268.92 Gg CO2 / year (36.0%)
- 2: 4, CH4 with -2390.26 Gg CO2 / year (-16.3%)
- 3: 2, CO2 with 2211.79 Gg CO2 / year (3.3%)
- 4: 1.B.2, CO2 with 1056.43 Gg CO2 / year (70943.5%)
- 5: 2, SF6 with 825.82 Gg CO2 / year (11.4%)
Notes on data changes
Here we list notes explaining important emissions changes for the country.
- CRT data has been included. It replaces the official inventory used
in v2.6.
- Changes in the CR time-series are small and come from updated third party data (EDGAR, FAO) which is used to extrapolate the country reported data.
- Changes in the TP time-series come from updated EDGAR data in
several sectors.
- NOTE: EDGAR HFC emissions are much lower than country reported emissions. They are however, perfectly in line with country reported HFC emissions excluding the “Unspecified mix of HFCs” reported in the CRT data. This means that EDGAR is likely ignoring the HFC gas mix which makes up up to 2/3 of Japan’s HFC emissions.
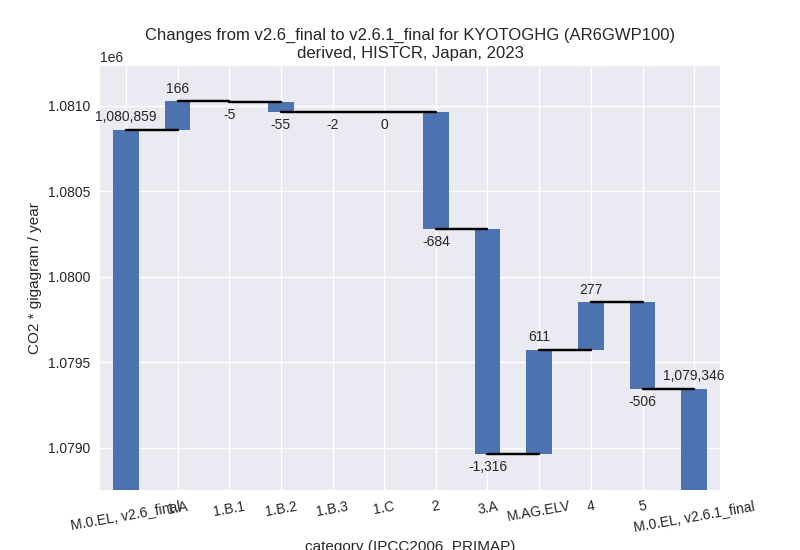
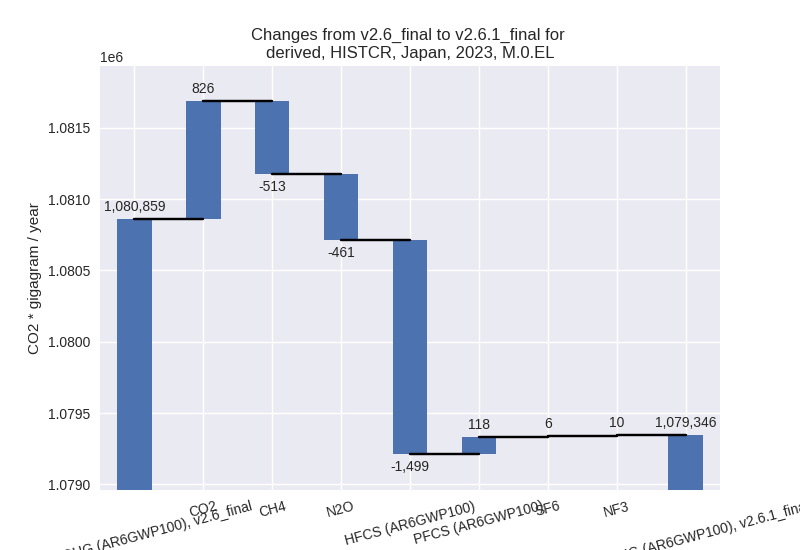
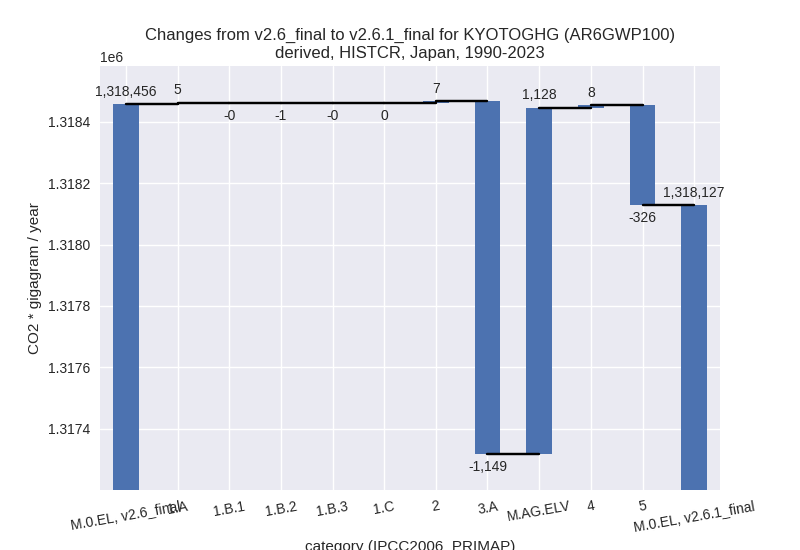
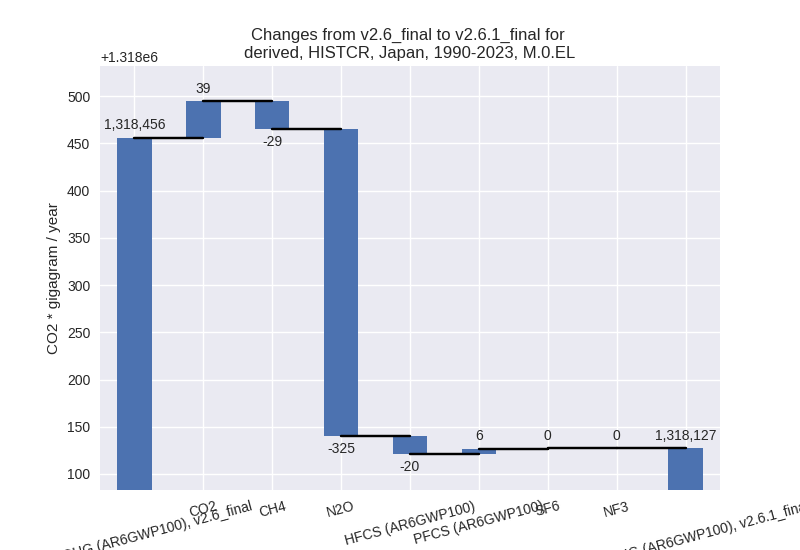
Changes by sector and gas
For each scenario and time frame the changes are displayed for all individual sectors and all individual gases. In the sector plot we use aggregate Kyoto GHGs in AR6GWP100. In the gas plot we usenational total emissions without LULUCF.
country reported scenario
2023
1990-2023
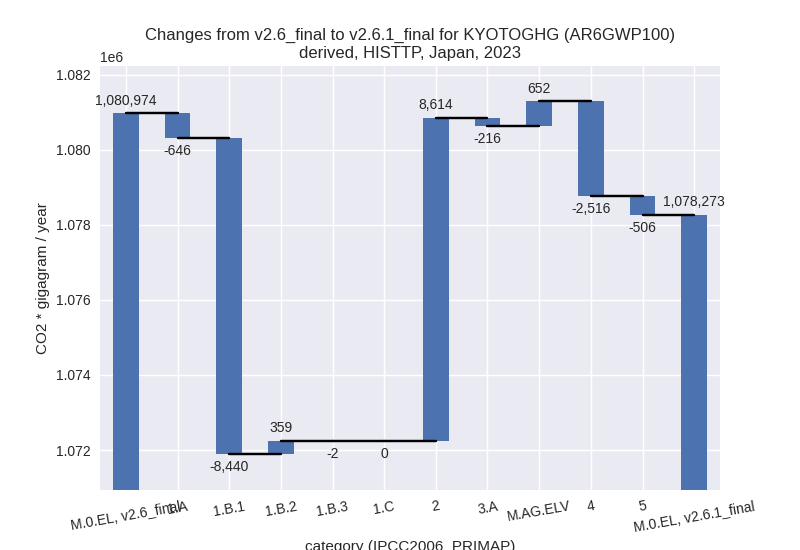
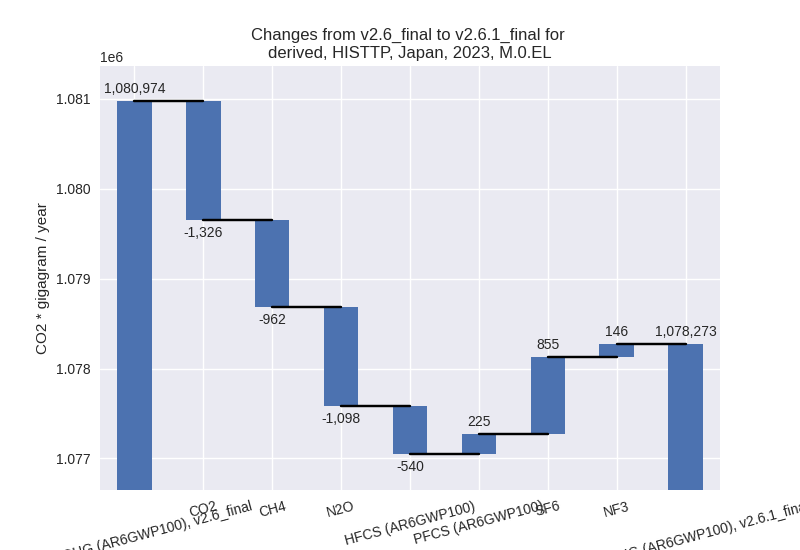
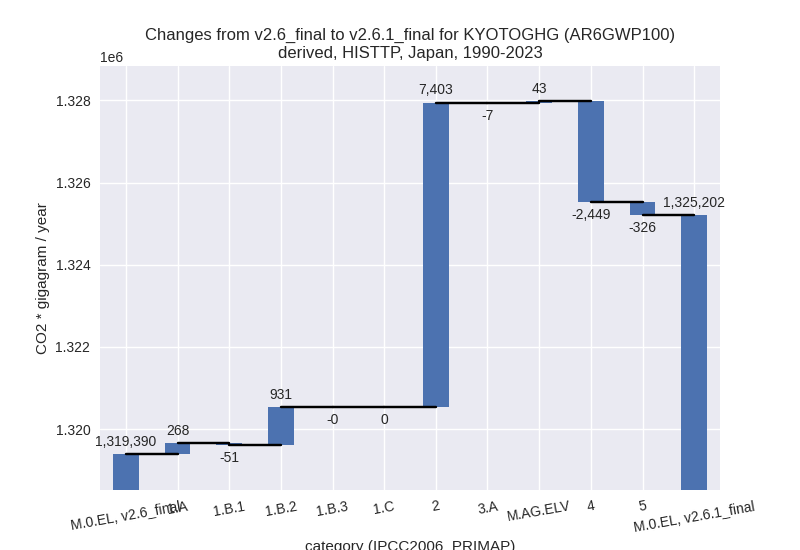
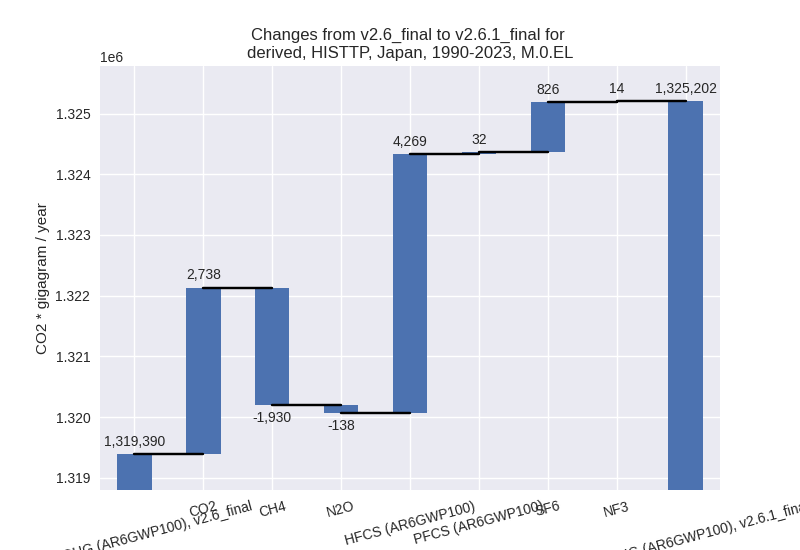
third party scenario
2023
1990-2023
Detailed changes for the scenarios:
country reported scenario (HISTCR):
Most important changes per time frame
For 2023 the following sector-gas combinations have the highest absolute impact on national total KyotoGHG (AR6GWP100) emissions in 2023 (top 5):
- 1: 2, HFCS (AR6GWP100) with -1499.32 Gg CO2 / year (-2.7%)
- 2: 3.A, N2O with -1012.33 Gg CO2 / year (-28.6%)
- 3: M.AG.ELV, N2O with 964.39 Gg CO2 / year (18.1%)
- 4: 2, CO2 with 740.03 Gg CO2 / year (2.0%)
- 5: 5, N2O with -505.60 Gg CO2 / year (-19.8%)
For 1990-2023 the following sector-gas combinations have the highest absolute impact on national total KyotoGHG (AR6GWP100) emissions in 1990-2023 (top 5):
- 1: 3.A, N2O with -1139.78 Gg CO2 / year (-30.4%)
- 2: M.AG.ELV, N2O with 1138.37 Gg CO2 / year (19.6%)
- 3: 5, N2O with -326.24 Gg CO2 / year (-8.2%)
- 4: 2, CO2 with 21.77 Gg CO2 / year (0.0%)
- 5: 2, HFCS (AR6GWP100) with -19.57 Gg CO2 / year (-0.1%)
Changes in the main sectors for aggregate KyotoGHG (AR6GWP100) are
- 1: Total sectoral emissions in 2022 are 989311.01 Gg CO2 / year which is 86.4% of M.0.EL emissions. 2023 Emissions have changed by 0.0% (103.65 Gg CO2 / year). 1990-2023 Emissions have changed by 0.0% (3.42 Gg CO2 / year).
- 2: Total sectoral emissions in 2022 are 101606.97 Gg CO2 / year which is 8.9% of M.0.EL emissions. 2023 Emissions have changed by -0.7% (-684.27 Gg CO2 / year). 1990-2023 Emissions have changed by 0.0% (6.86 Gg CO2 / year).
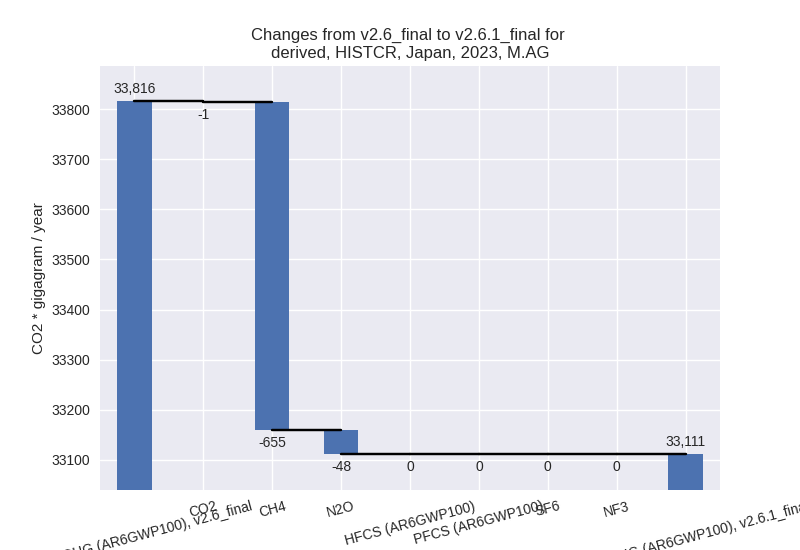
- M.AG: Total sectoral emissions in 2022 are 33682.69
Gg CO2 / year which is 2.9% of M.0.EL emissions. 2023 Emissions have
changed by -2.1% (-704.35 Gg CO2 /
year). 1990-2023 Emissions have changed by -0.1% (-20.72 Gg CO2 / year). For 2023 the
changes per gas
are:
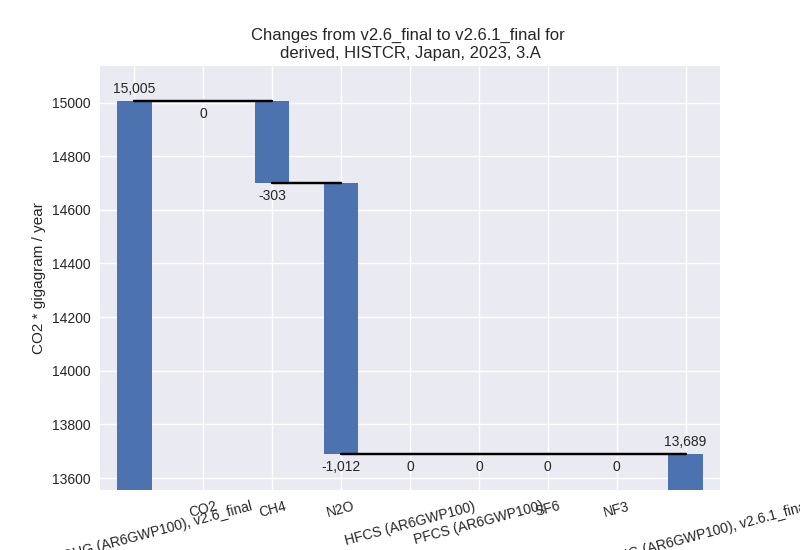
The changes come from the following subsectors:- 3.A: Total sectoral emissions in 2022 are 13882.83
Gg CO2 / year which is 41.2% of category M.AG emissions. 2023 Emissions
have changed by -8.8% (-1315.50 Gg
CO2 / year). 1990-2023 Emissions have changed by -7.0% (-1148.69 Gg CO2 / year). For 2023
the changes per gas
are:
For 1990-2023 the changes per gas are: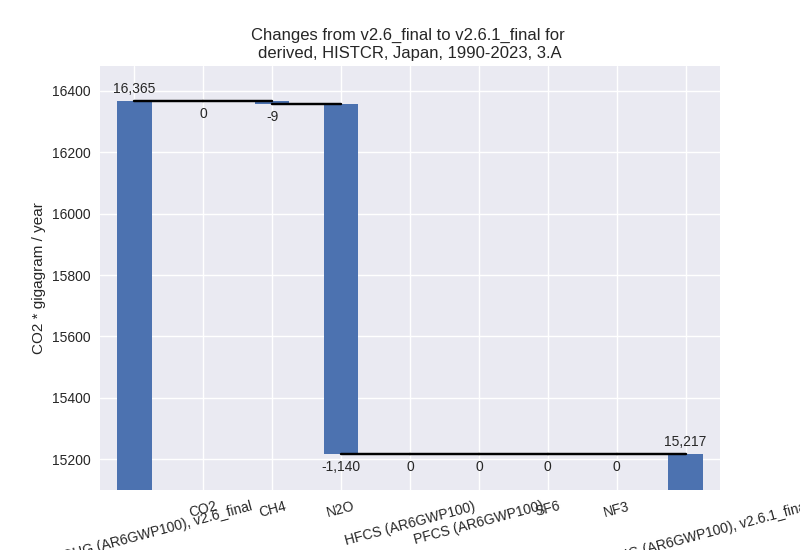
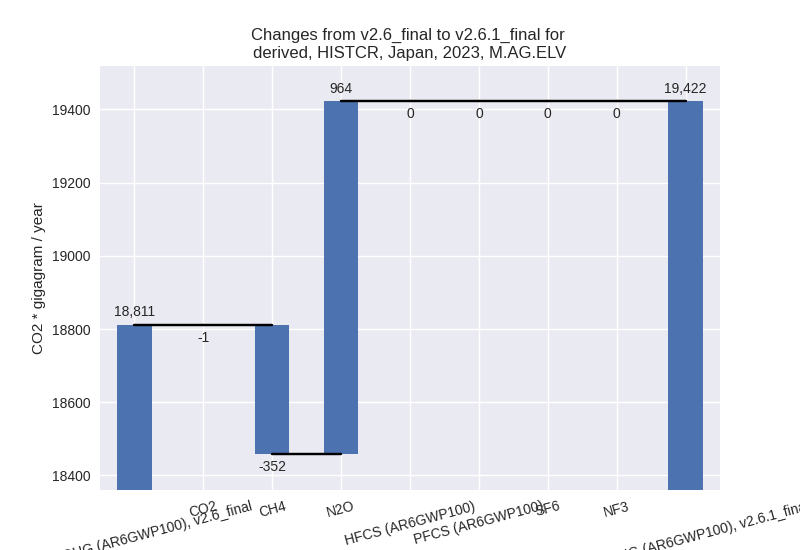
There is no subsector information available in PRIMAP-hist. - M.AG.ELV: Total sectoral emissions in 2022 are
19799.85 Gg CO2 / year which is 58.8% of category M.AG emissions. 2023
Emissions have changed by 3.2%
(611.15 Gg CO2 / year). 1990-2023 Emissions have changed by 5.7% (1127.98 Gg CO2 / year). For 2023 the
changes per gas
are:
For 1990-2023 the changes per gas are: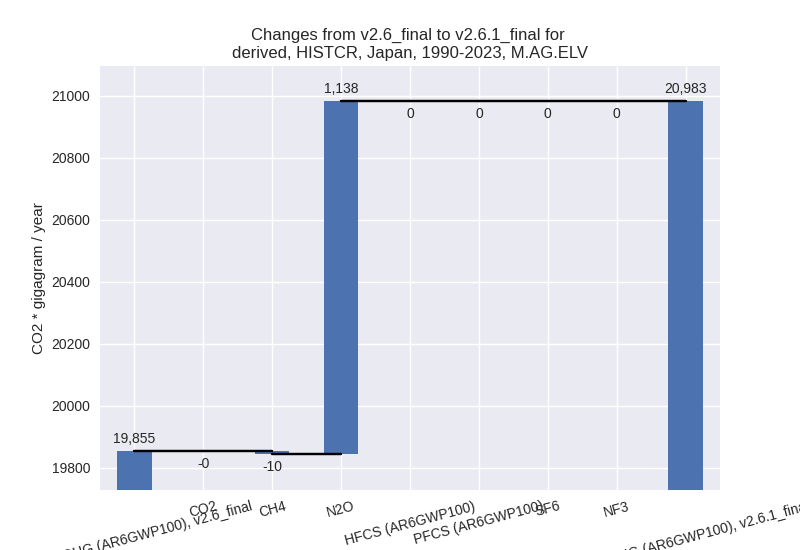
There is no subsector information available in PRIMAP-hist.
- 3.A: Total sectoral emissions in 2022 are 13882.83
Gg CO2 / year which is 41.2% of category M.AG emissions. 2023 Emissions
have changed by -8.8% (-1315.50 Gg
CO2 / year). 1990-2023 Emissions have changed by -7.0% (-1148.69 Gg CO2 / year). For 2023
the changes per gas
are:
- 4: Total sectoral emissions in 2022 are 17607.16 Gg CO2 / year which is 1.5% of M.0.EL emissions. 2023 Emissions have changed by 1.6% (276.99 Gg CO2 / year). 1990-2023 Emissions have changed by 0.0% (8.15 Gg CO2 / year).
- 5: Total sectoral emissions in 2022 are 2196.16 Gg
CO2 / year which is 0.2% of M.0.EL emissions. 2023 Emissions have
changed by -19.8% (-505.60 Gg CO2 /
year). 1990-2023 Emissions have changed by -8.2% (-326.24 Gg CO2 / year). For 2023
the changes per gas
are:

For 1990-2023 the changes per gas are:
third party scenario (HISTTP):
Most important changes per time frame
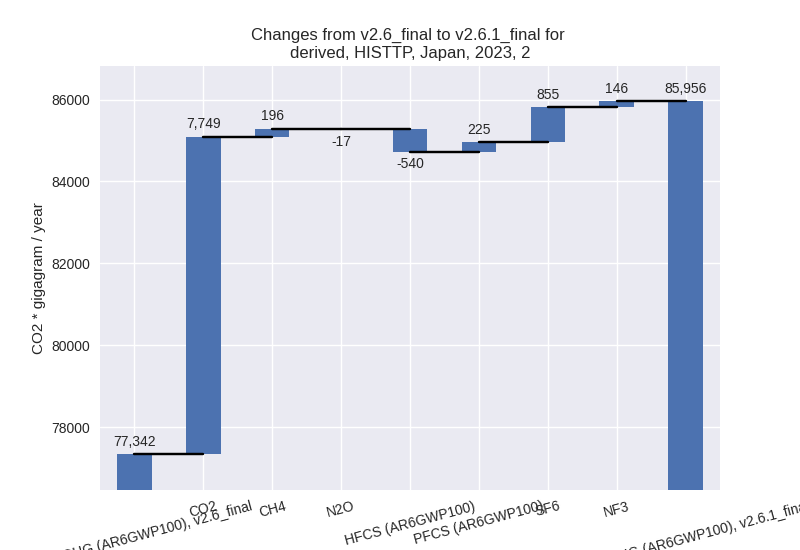
For 2023 the following sector-gas combinations have the highest absolute impact on national total KyotoGHG (AR6GWP100) emissions in 2023 (top 5):
- 1: 1.B.1, CO2 with -8975.92 Gg CO2 / year (-99.9%)
- 2: 2, CO2 with 7749.32 Gg CO2 / year (15.4%)
- 3: 4, CH4 with -1862.62 Gg CO2 / year (-22.4%)
- 4: 2, SF6 with 855.08 Gg CO2 / year (43.6%)
- 5: 4, CO2 with -669.93 Gg CO2 / year (-17.2%)
For 1990-2023 the following sector-gas combinations have the highest absolute impact on national total KyotoGHG (AR6GWP100) emissions in 1990-2023 (top 5):
- 1: 2, HFCS (AR6GWP100) with 4268.92 Gg CO2 / year (36.0%)
- 2: 4, CH4 with -2390.26 Gg CO2 / year (-16.3%)
- 3: 2, CO2 with 2211.79 Gg CO2 / year (3.3%)
- 4: 1.B.2, CO2 with 1056.43 Gg CO2 / year (70943.5%)
- 5: 2, SF6 with 825.82 Gg CO2 / year (11.4%)
Changes in the main sectors for aggregate KyotoGHG (AR6GWP100) are
- 1: Total sectoral emissions in 2022 are 1021143.80 Gg CO2 / year which is 89.0% of M.0.EL emissions. 2023 Emissions have changed by -0.9% (-8729.40 Gg CO2 / year). 1990-2023 Emissions have changed by 0.1% (1147.55 Gg CO2 / year).
- 2: Total sectoral emissions in 2022 are 88544.41 Gg
CO2 / year which is 7.7% of M.0.EL emissions. 2023 Emissions have
changed by 11.1% (8614.13 Gg CO2 /
year). 1990-2023 Emissions have changed by 7.4% (7402.93 Gg CO2 / year). For 2023 the
changes per gas
are:
For 1990-2023 the changes per gas are: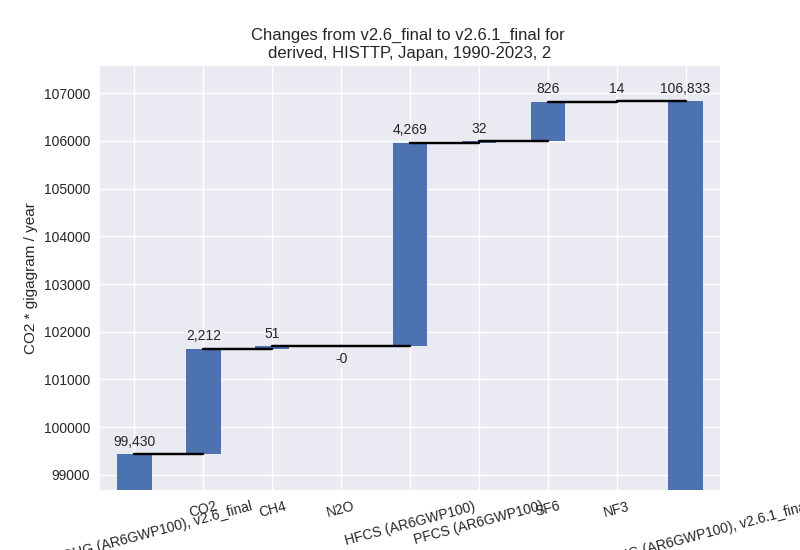
- M.AG: Total sectoral emissions in 2022 are 23684.52 Gg CO2 / year which is 2.1% of M.0.EL emissions. 2023 Emissions have changed by 1.9% (436.41 Gg CO2 / year). 1990-2023 Emissions have changed by 0.1% (35.90 Gg CO2 / year).
- 4: Total sectoral emissions in 2022 are 12075.76 Gg
CO2 / year which is 1.1% of M.0.EL emissions. 2023 Emissions have
changed by -17.6% (-2516.17 Gg CO2 /
year). 1990-2023 Emissions have changed by -11.5% (-2448.66 Gg CO2 / year). For 2023
the changes per gas
are:
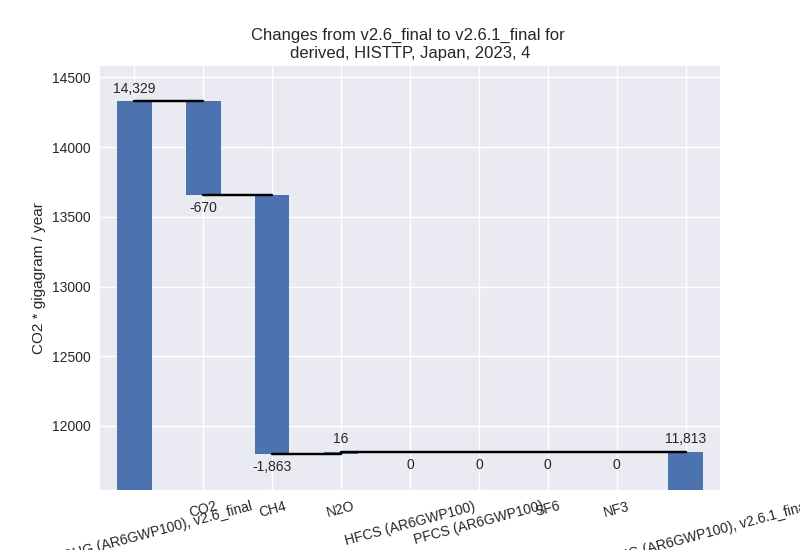
For 1990-2023 the changes per gas are: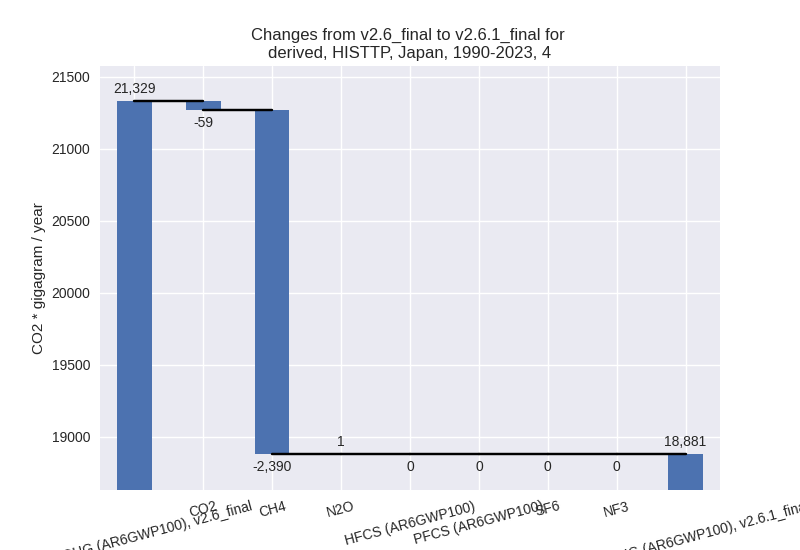
- 5: Total sectoral emissions in 2022 are 2196.16 Gg
CO2 / year which is 0.2% of M.0.EL emissions. 2023 Emissions have
changed by -19.8% (-505.60 Gg CO2 /
year). 1990-2023 Emissions have changed by -8.2% (-326.24 Gg CO2 / year). For 2023
the changes per gas
are:

For 1990-2023 the changes per gas are: