Changes in PRIMAP-hist v2.6.1_final compared to v2.6_final for Kenya
2025-03-19
Johannes Gütschow
Change analysis for Kenya for PRIMAP-hist v2.6.1_final compared to v2.6_final
Overview over emissions by sector and gas
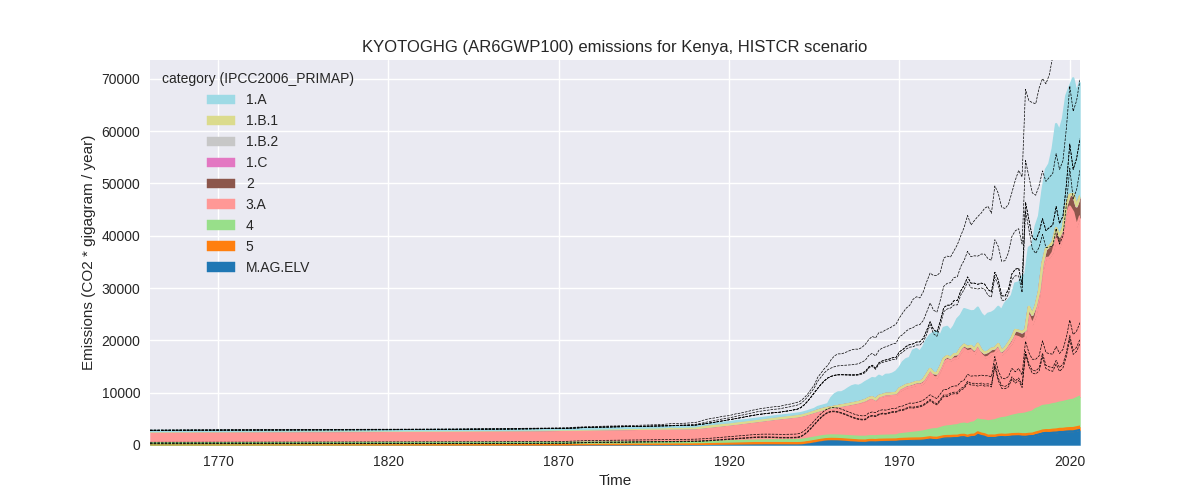
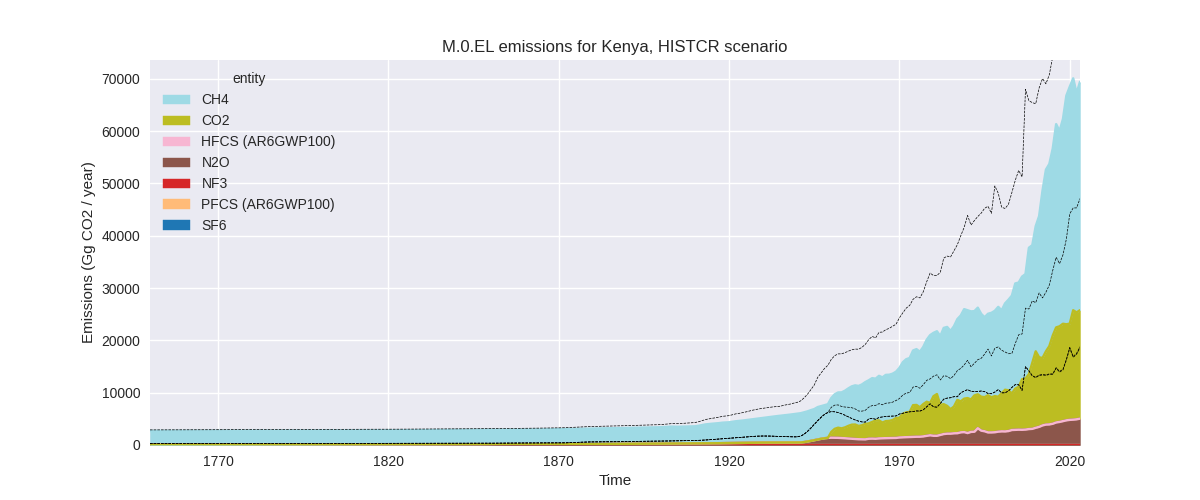
The following figures show the aggregate national total emissions excluding LULUCF AR6GWP100 for the country reported priority scenario. The dotted linesshow the v2.6_final data.
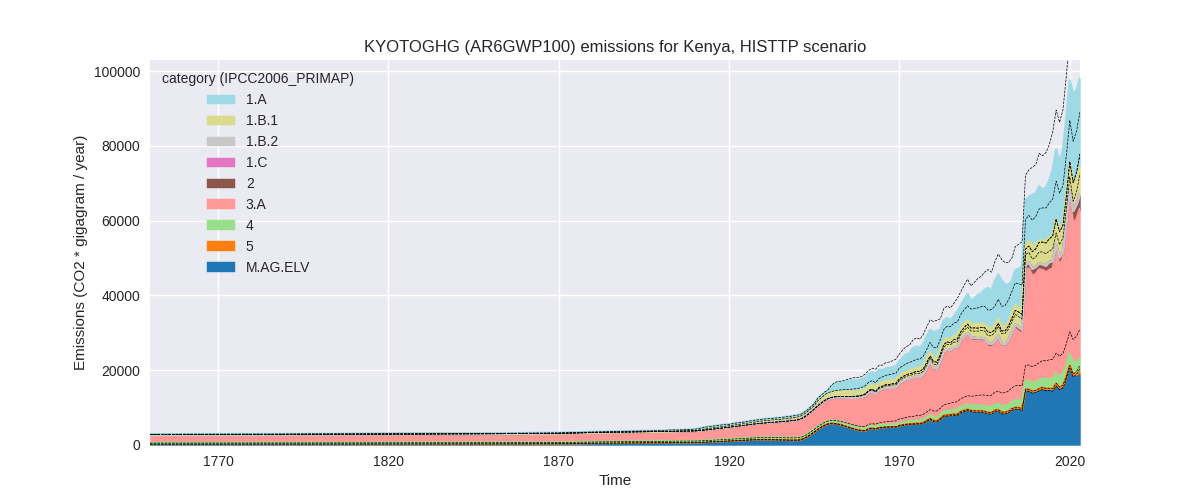
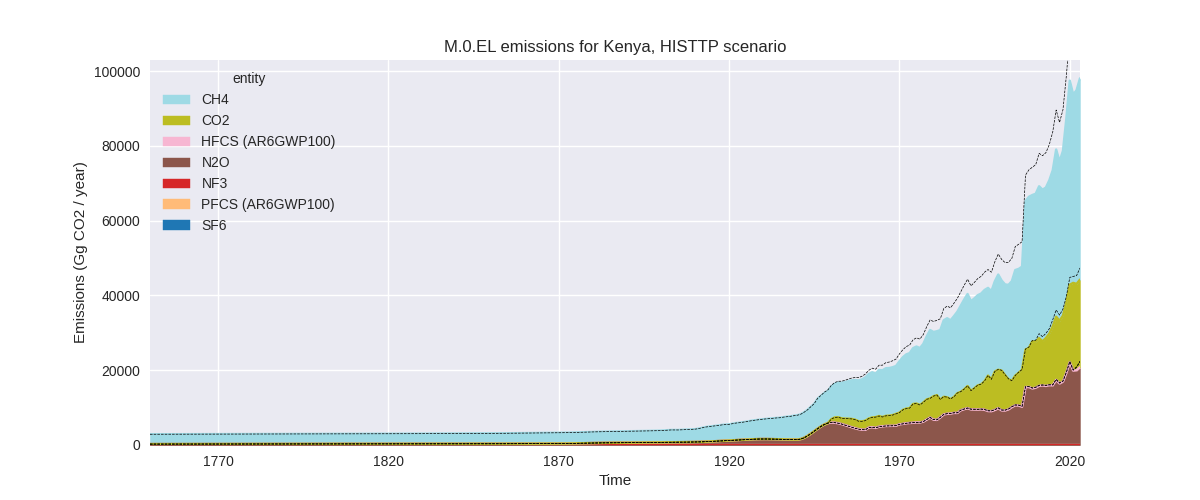
The following figures show the aggregate national total emissions excluding LULUCF AR6GWP100 for the third party priority scenario. The dotted linesshow the v2.6_final data.
Overview over changes
In the country reported priority scenario we have the following changes for aggregate Kyoto GHG and national total emissions excluding LULUCF (M.0.EL):
- Emissions in 2023 have changed by -30.3%% (-30221.10 Gg CO2 / year)
- Emissions in 1990-2023 have changed by -34.2%% (-21282.67 Gg CO2 / year)
In the third party priority scenario we have the following changes for aggregate Kyoto GHG and national total emissions excluding LULUCF (M.0.EL):
- Emissions in 2023 have changed by -13.5%% (-15328.15 Gg CO2 / year)
- Emissions in 1990-2023 have changed by -11.4%% (-7727.32 Gg CO2 / year)
Most important changes per scenario and time frame
In the country reported priority scenario the following sector-gas combinations have the highest absolute impact on national total KyotoGHG (AR6GWP100) emissions in 2023 (top 5):
- 1: M.AG.ELV, N2O with -13068.71 Gg CO2 / year (-83.6%)
- 2: 1.B.1, CH4 with -11154.59 Gg CO2 / year (-100.0%)
- 3: 1.A, CO2 with -5605.21 Gg CO2 / year (-25.2%)
- 4: 3.A, CH4 with 5167.41 Gg CO2 / year (17.9%)
- 5: M.AG.ELV, CH4 with -3197.10 Gg CO2 / year (-92.4%)
In the country reported priority scenario the following sector-gas combinations have the highest absolute impact on national total KyotoGHG (AR6GWP100) emissions in 1990-2023 (top 5):
- 1: M.AG.ELV, N2O with -8799.58 Gg CO2 / year (-83.0%)
- 2: 1.B.1, CH4 with -7929.05 Gg CO2 / year (-100.0%)
- 3: M.AG.ELV, CH4 with -2950.02 Gg CO2 / year (-96.0%)
- 4: 4, CH4 with 1847.83 Gg CO2 / year (124.0%)
- 5: 1.A, CH4 with -1754.39 Gg CO2 / year (-43.7%)
In the third party priority scenario the following sector-gas combinations have the highest absolute impact on national total KyotoGHG (AR6GWP100) emissions in 2023 (top 5):
- 1: 4, CH4 with -6203.23 Gg CO2 / year (-68.1%)
- 2: 1.B.1, CH4 with -3861.86 Gg CO2 / year (-34.6%)
- 3: 3.A, CH4 with -1522.37 Gg CO2 / year (-3.7%)
- 4: M.AG.ELV, N2O with -1365.15 Gg CO2 / year (-6.9%)
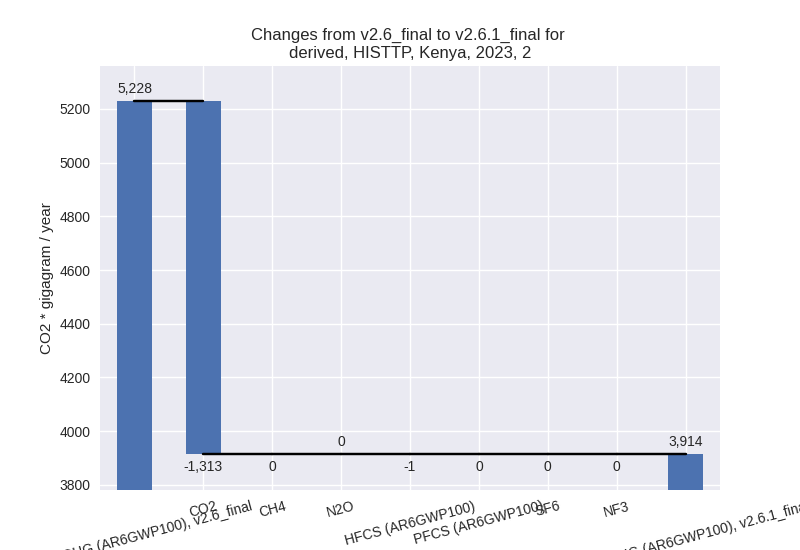
- 5: 2, CO2 with -1313.09 Gg CO2 / year (-26.0%)
In the third party priority scenario the following sector-gas combinations have the highest absolute impact on national total KyotoGHG (AR6GWP100) emissions in 1990-2023 (top 5):
- 1: 4, CH4 with -4167.36 Gg CO2 / year (-69.9%)
- 2: 1.B.1, CH4 with -2467.77 Gg CO2 / year (-31.1%)
- 3: 2, CO2 with -523.85 Gg CO2 / year (-26.0%)
- 4: 1.A, CH4 with -300.05 Gg CO2 / year (-10.4%)
- 5: 5, N2O with -86.96 Gg CO2 / year (-16.0%)
Notes on data changes
Here we list notes explaining important emissions changes for the country.
- CRT from BTR1 covering 1990-2022 has been added. It replaces and extends DI data. For both 2023 and cumulative emissions emissions in many sectors are much lower (M.AG.ELV, N2O; 1.B.1, CO2 (CRT replaces EDGAR); 1.A, CO2). The livestock and waste sectors have higher emission in the CRT data. These changes are not always only through lower country reported data but also due to replacing third party growth rates used to extend country reported data with country reported data. The coverage of the DI data used in PRIMAP-hist v2.6 is relatively low, thus third party data played an important role in the CR scenario.
- Changes in the TP time-series come from updated EDGAR and FAO data. FAO has adjusted data for the latest years while EDGAR has updated full time-series with the main changes coming from the waste sector and CH4 in 1.B.1. for 2023 agricultural emissions are lower because of the additional data year in FAOSTAT data.
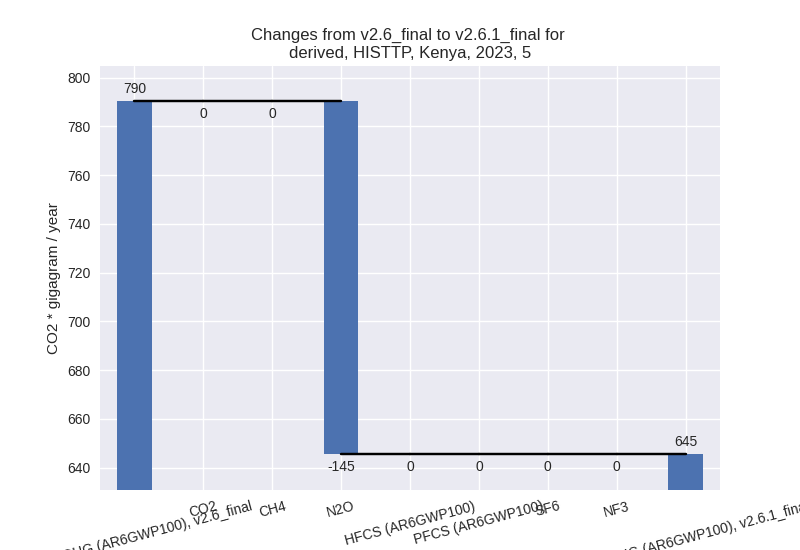
Changes by sector and gas
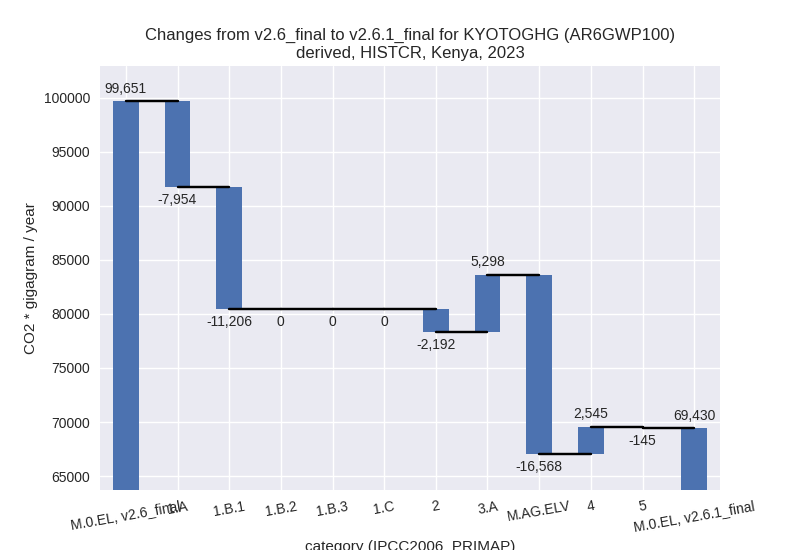
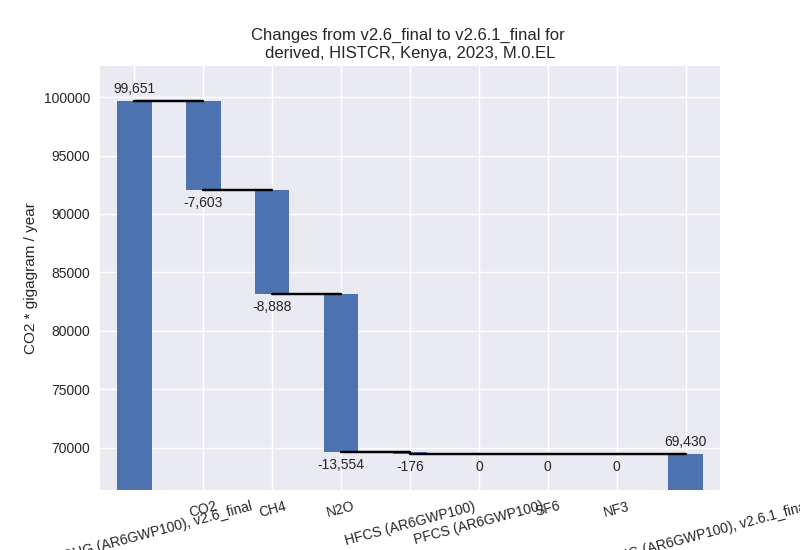
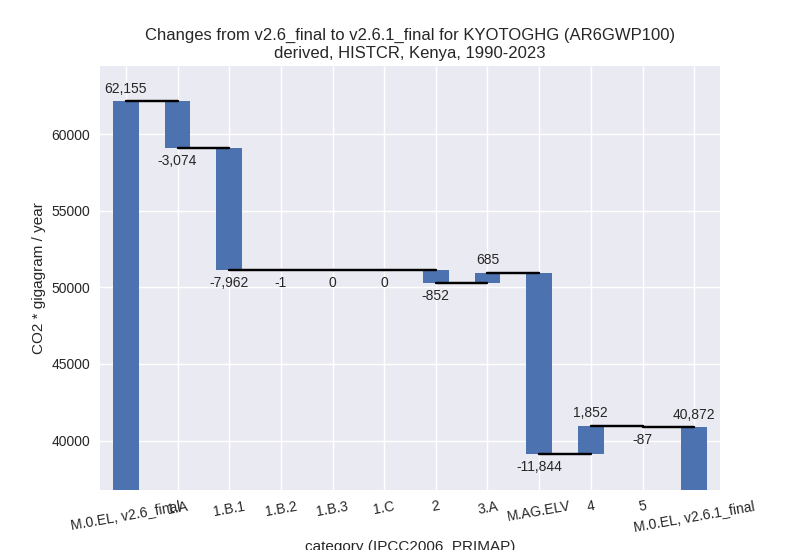
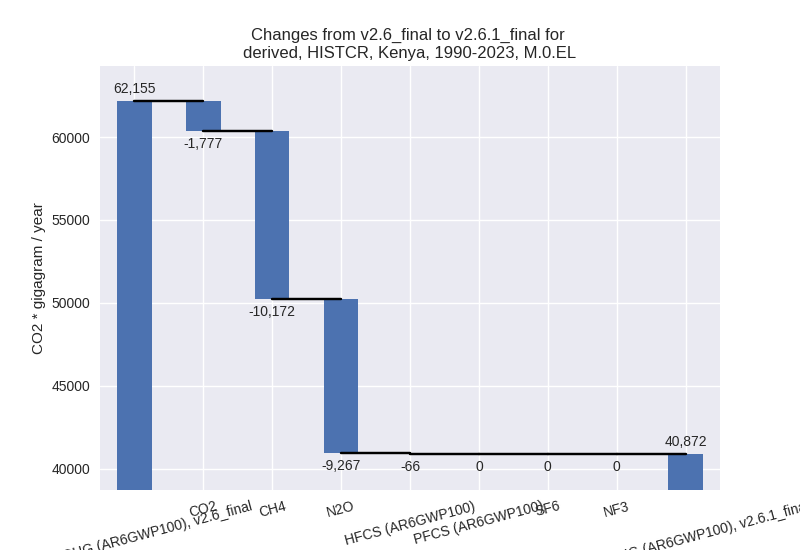
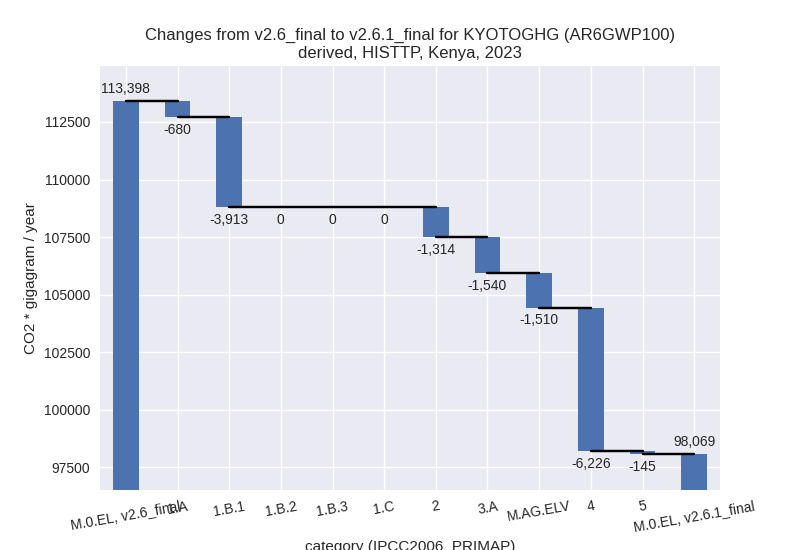
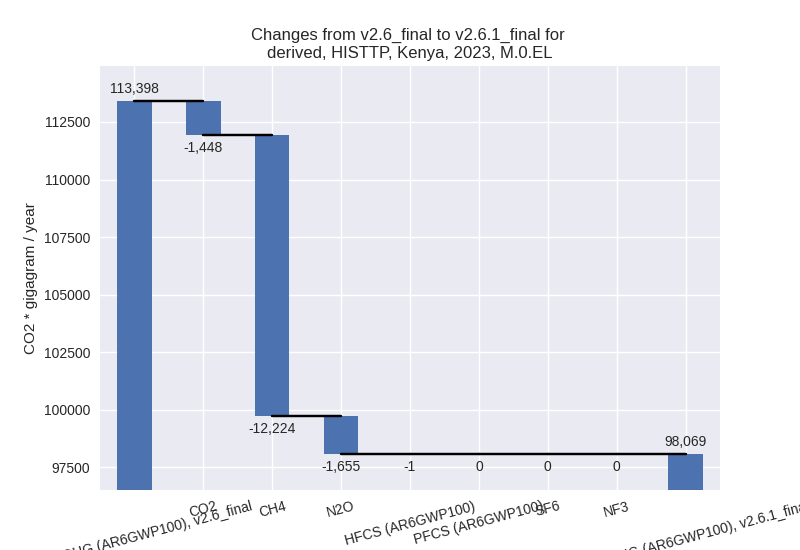
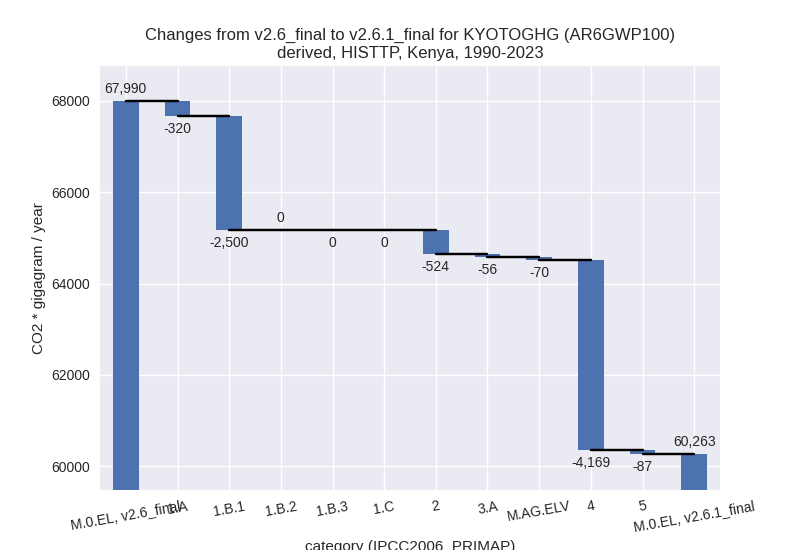
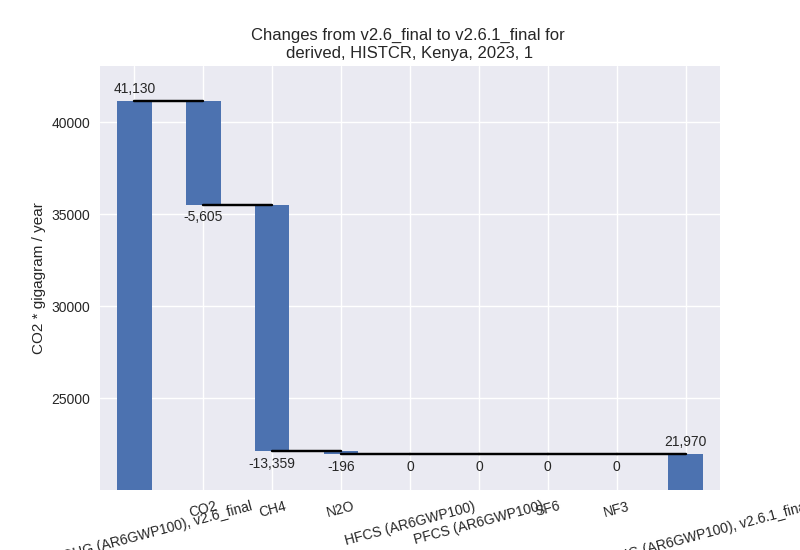
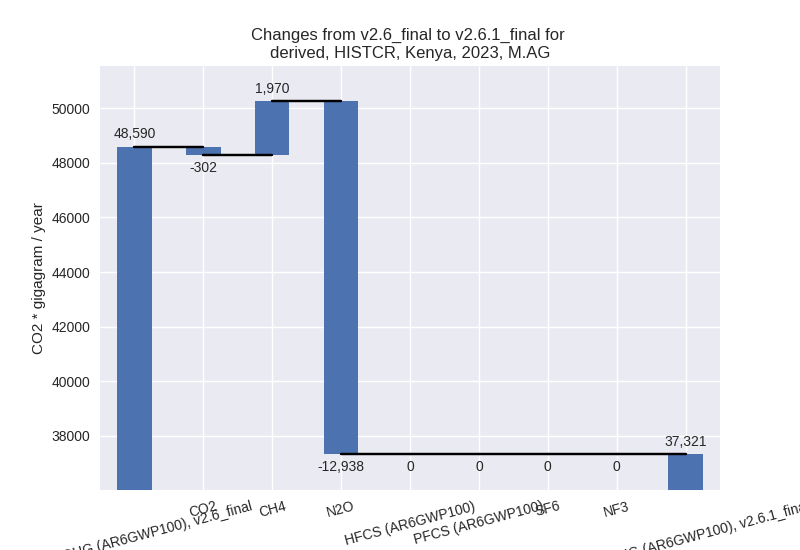
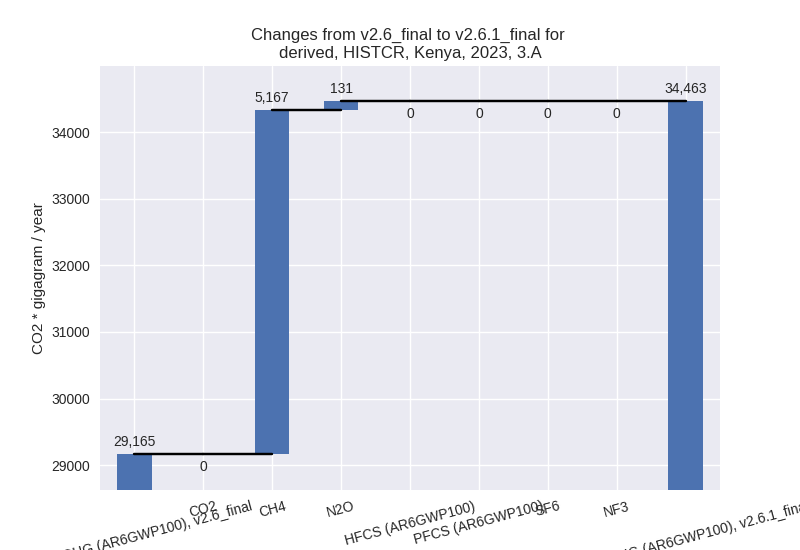
For each scenario and time frame the changes are displayed for all individual sectors and all individual gases. In the sector plot we use aggregate Kyoto GHGs in AR6GWP100. In the gas plot we usenational total emissions without LULUCF.
country reported scenario
2023
1990-2023
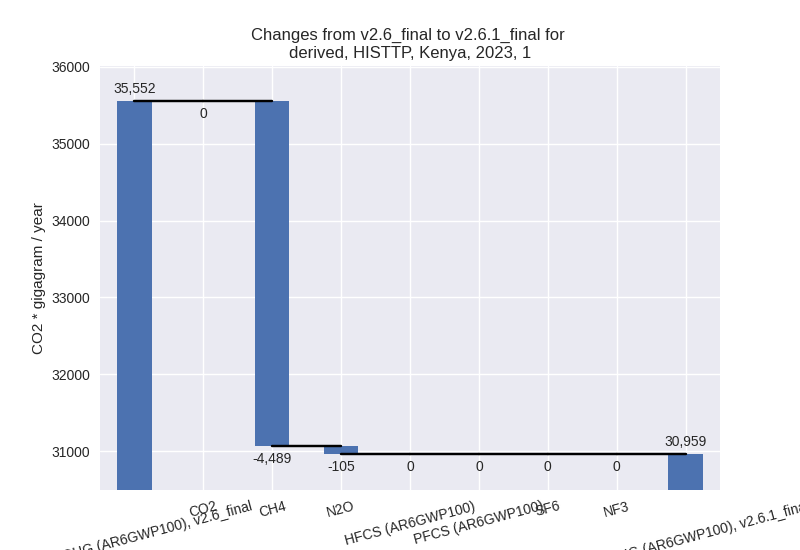
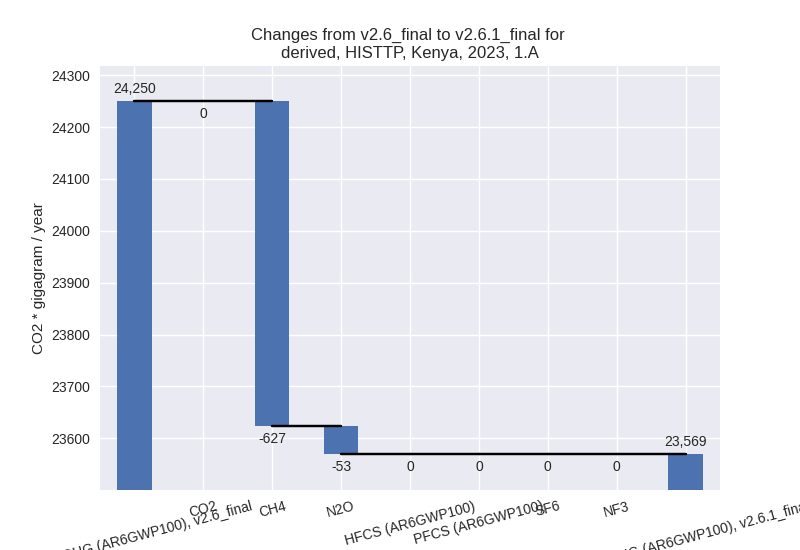
third party scenario
2023
1990-2023

Detailed changes for the scenarios:
country reported scenario (HISTCR):
Most important changes per time frame
For 2023 the following sector-gas combinations have the highest absolute impact on national total KyotoGHG (AR6GWP100) emissions in 2023 (top 5):
- 1: M.AG.ELV, N2O with -13068.71 Gg CO2 / year (-83.6%)
- 2: 1.B.1, CH4 with -11154.59 Gg CO2 / year (-100.0%)
- 3: 1.A, CO2 with -5605.21 Gg CO2 / year (-25.2%)
- 4: 3.A, CH4 with 5167.41 Gg CO2 / year (17.9%)
- 5: M.AG.ELV, CH4 with -3197.10 Gg CO2 / year (-92.4%)
For 1990-2023 the following sector-gas combinations have the highest absolute impact on national total KyotoGHG (AR6GWP100) emissions in 1990-2023 (top 5):
- 1: M.AG.ELV, N2O with -8799.58 Gg CO2 / year (-83.0%)
- 2: 1.B.1, CH4 with -7929.05 Gg CO2 / year (-100.0%)
- 3: M.AG.ELV, CH4 with -2950.02 Gg CO2 / year (-96.0%)
- 4: 4, CH4 with 1847.83 Gg CO2 / year (124.0%)
- 5: 1.A, CH4 with -1754.39 Gg CO2 / year (-43.7%)
Changes in the main sectors for aggregate KyotoGHG (AR6GWP100) are
- 1: Total sectoral emissions in 2022 are 21605.62 Gg
CO2 / year which is 32.1% of M.0.EL emissions. 2023 Emissions have
changed by -46.6% (-19160.15 Gg CO2
/ year). 1990-2023 Emissions have changed by -46.7% (-11036.98 Gg CO2 / year). For 2023
the changes per gas
are:
For 1990-2023 the changes per gas are: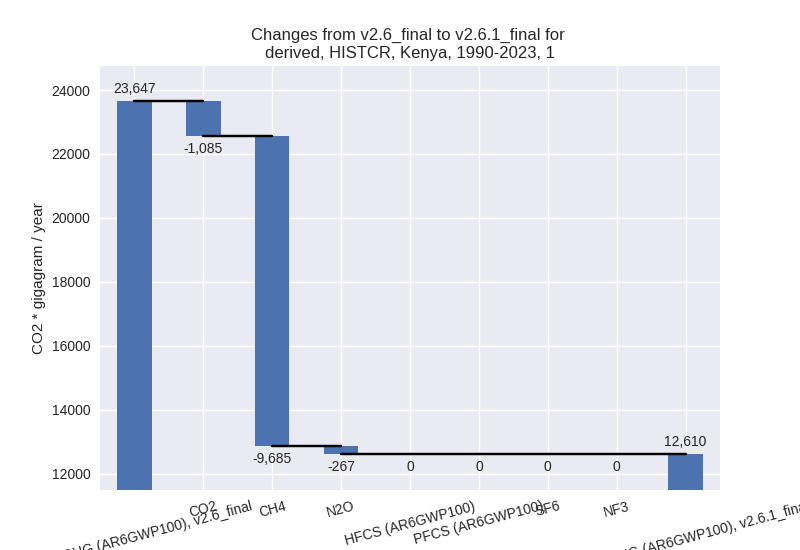
The changes come from the following subsectors:- 1.A: Total sectoral emissions in 2022 are 21508.94
Gg CO2 / year which is 99.6% of category 1 emissions. 2023 Emissions
have changed by -26.7% (-7954.36 Gg
CO2 / year). 1990-2023 Emissions have changed by -19.7% (-3073.90 Gg CO2 / year). For 2023
the changes per gas
are:
For 1990-2023 the changes per gas are: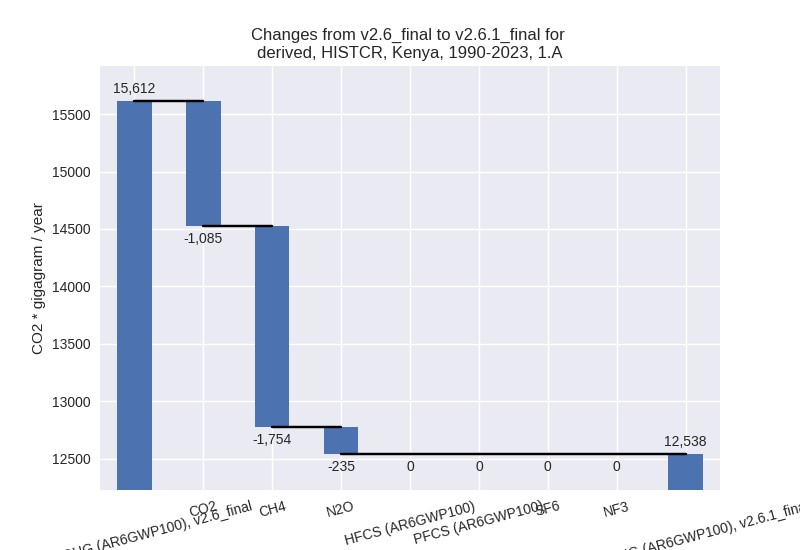
There is no subsector information available in PRIMAP-hist. - 1.B.1: Total sectoral emissions in 2022 are 96.68
Gg CO2 / year which is 0.4% of category 1 emissions. 2023 Emissions have
changed by -99.1% (-11205.79 Gg CO2
/ year). 1990-2023 Emissions have changed by -99.1% (-7961.77 Gg CO2 / year). For 2023
the changes per gas
are:

For 1990-2023 the changes per gas are: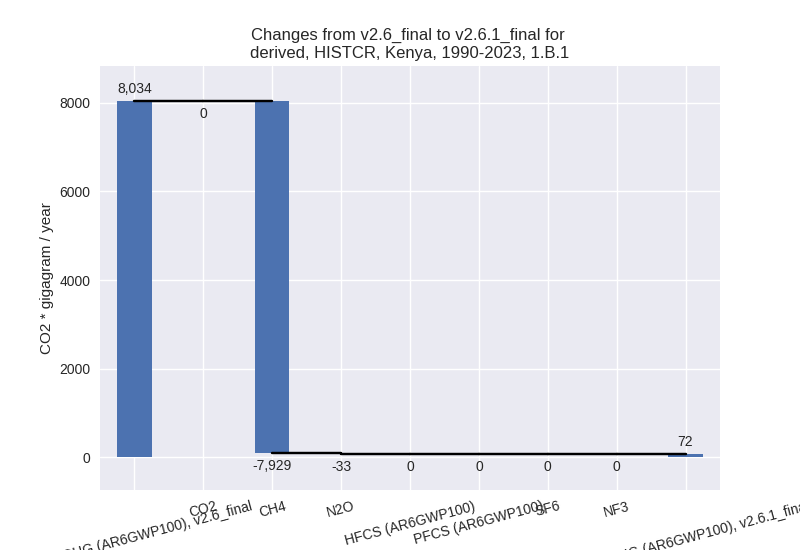
There is no subsector information available in PRIMAP-hist. - 1.B.2: Total sectoral emissions in 2022 are 0.00 Gg
CO2 / year which is 0.0% of category 1 emissions. 2023 Emissions have
changed by 0.0% (0.00 Gg CO2 /
year). 1990-2023 Emissions have changed by -100.0% (-1.32 Gg CO2 / year). For
1990-2023 the changes per gas
are:
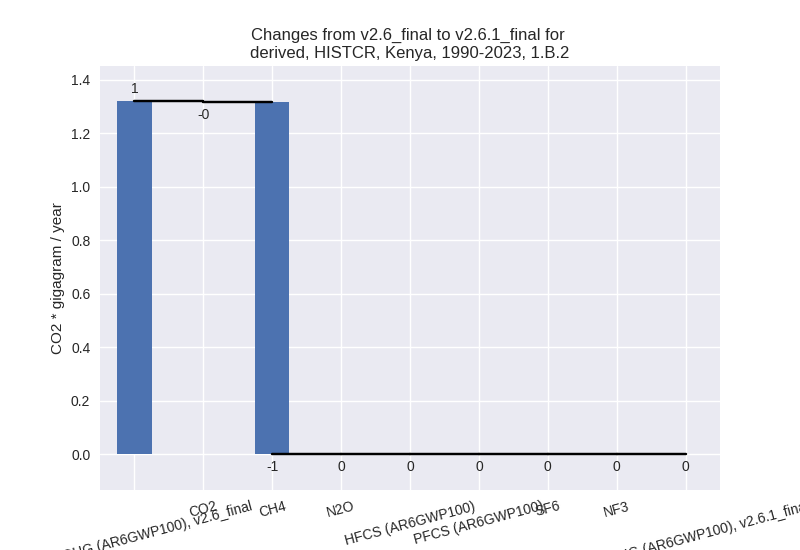
There is no subsector information available in PRIMAP-hist.
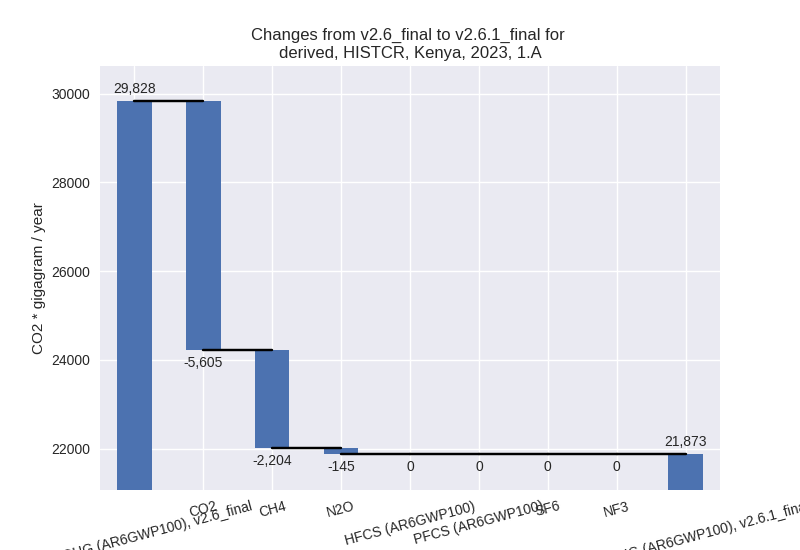
- 1.A: Total sectoral emissions in 2022 are 21508.94
Gg CO2 / year which is 99.6% of category 1 emissions. 2023 Emissions
have changed by -26.7% (-7954.36 Gg
CO2 / year). 1990-2023 Emissions have changed by -19.7% (-3073.90 Gg CO2 / year). For 2023
the changes per gas
are:
- 2: Total sectoral emissions in 2022 are 3840.64 Gg
CO2 / year which is 5.7% of M.0.EL emissions. 2023 Emissions have
changed by -36.8% (-2191.88 Gg CO2 /
year). 1990-2023 Emissions have changed by -36.0% (-852.27 Gg CO2 / year). For 2023
the changes per gas
are:
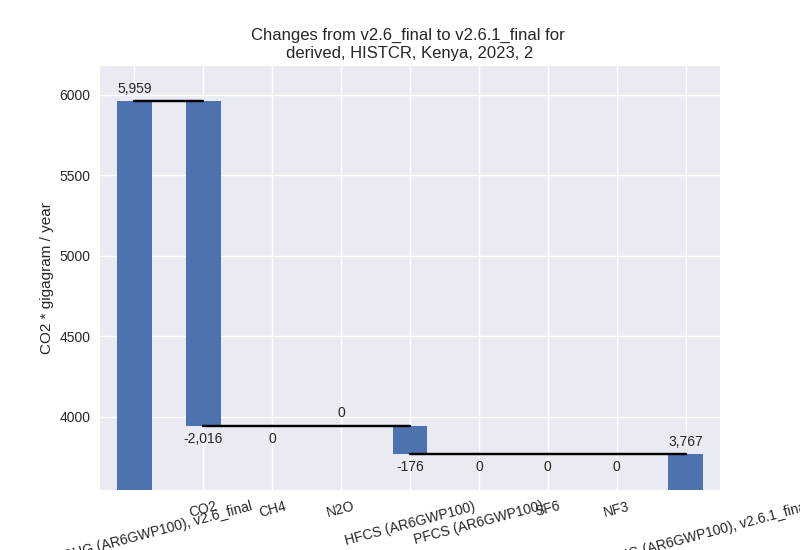
For 1990-2023 the changes per gas are: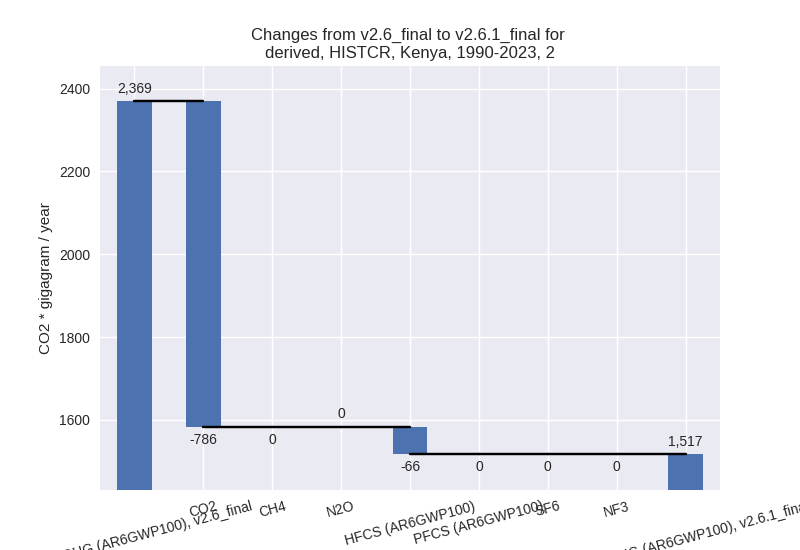
- M.AG: Total sectoral emissions in 2022 are 35567.02
Gg CO2 / year which is 52.9% of M.0.EL emissions. 2023 Emissions have
changed by -23.2% (-11269.21 Gg CO2
/ year). 1990-2023 Emissions have changed by -33.3% (-11158.66 Gg CO2 / year). For 2023
the changes per gas
are:
For 1990-2023 the changes per gas are: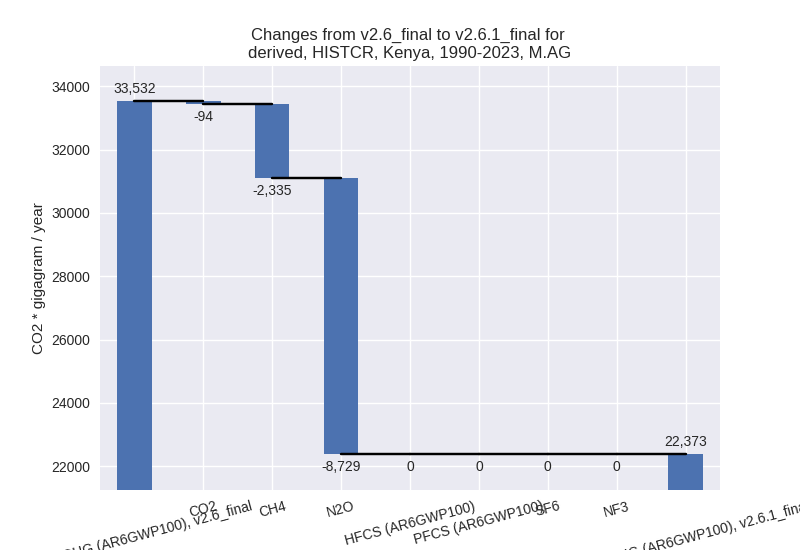
The changes come from the following subsectors:- 3.A: Total sectoral emissions in 2022 are 32852.67
Gg CO2 / year which is 92.4% of category M.AG emissions. 2023 Emissions
have changed by 18.2% (5298.50 Gg
CO2 / year). 1990-2023 Emissions have changed by 3.5% (685.26 Gg CO2 / year). For 2023 the
changes per gas
are:
For 1990-2023 the changes per gas are: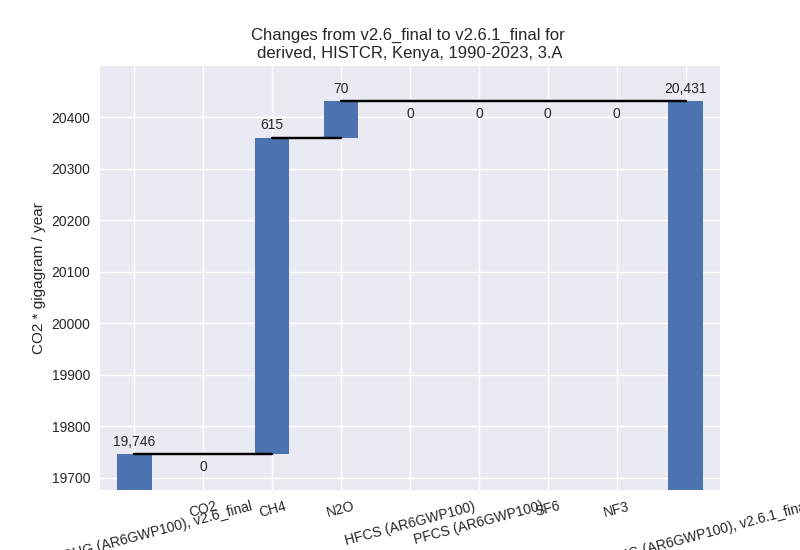
There is no subsector information available in PRIMAP-hist. - M.AG.ELV: Total sectoral emissions in 2022 are
2714.35 Gg CO2 / year which is 7.6% of category M.AG emissions. 2023
Emissions have changed by -85.3%
(-16567.71 Gg CO2 / year). 1990-2023 Emissions have changed by -85.9% (-11843.92 Gg CO2 / year). For 2023
the changes per gas
are:

For 1990-2023 the changes per gas are: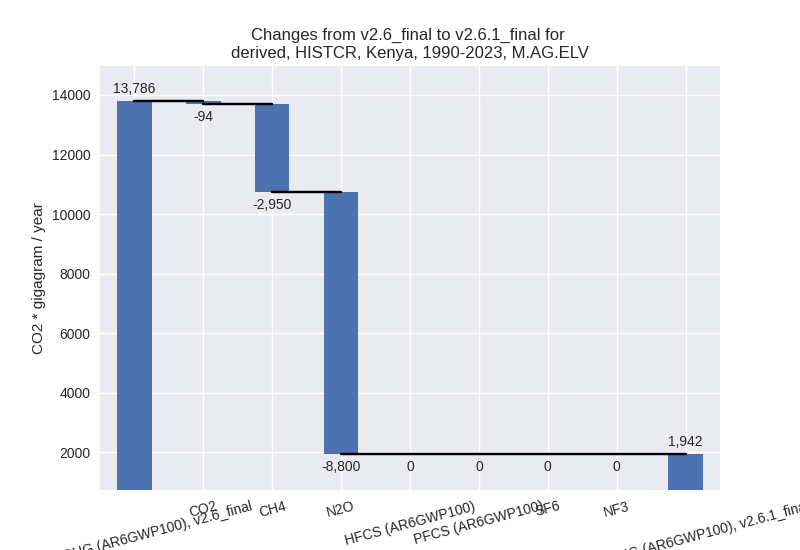
There is no subsector information available in PRIMAP-hist.
- 3.A: Total sectoral emissions in 2022 are 32852.67
Gg CO2 / year which is 92.4% of category M.AG emissions. 2023 Emissions
have changed by 18.2% (5298.50 Gg
CO2 / year). 1990-2023 Emissions have changed by 3.5% (685.26 Gg CO2 / year). For 2023 the
changes per gas
are:
- 4: Total sectoral emissions in 2022 are 5555.34 Gg
CO2 / year which is 8.3% of M.0.EL emissions. 2023 Emissions have
changed by 80.0% (2544.98 Gg CO2 /
year). 1990-2023 Emissions have changed by 89.8% (1852.20 Gg CO2 / year). For 2023
the changes per gas
are:
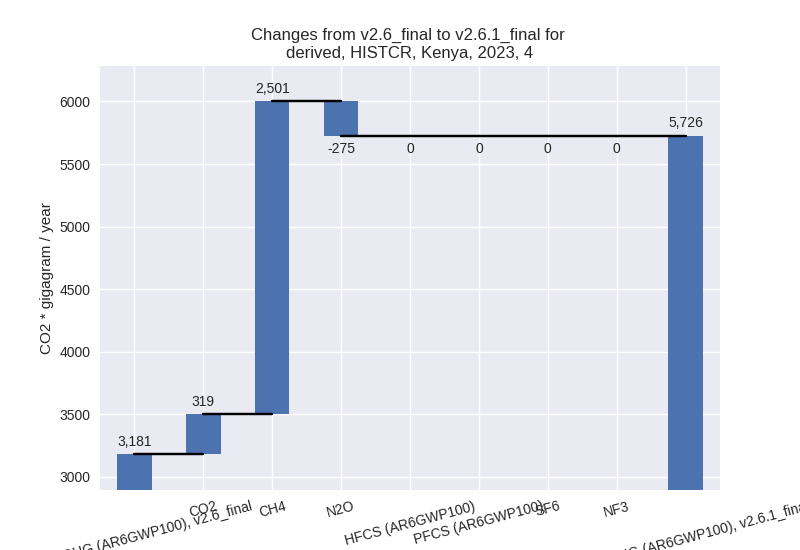
For 1990-2023 the changes per gas are: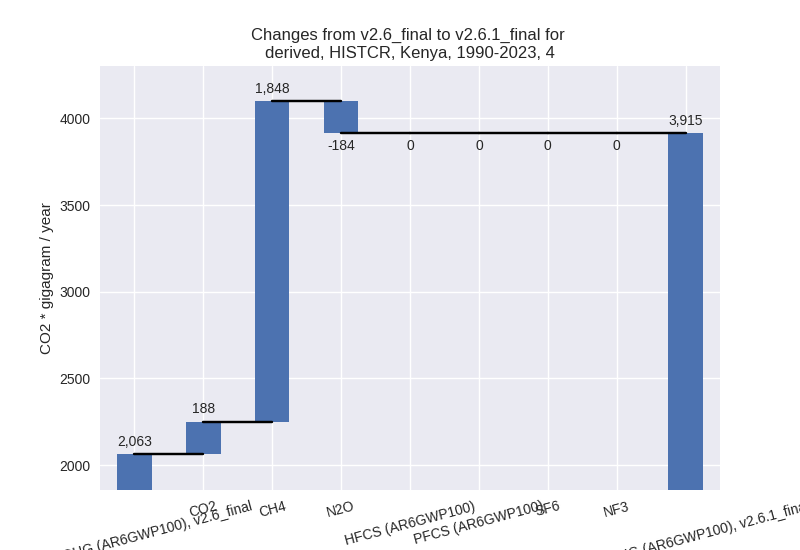
- 5: Total sectoral emissions in 2022 are 644.11 Gg
CO2 / year which is 1.0% of M.0.EL emissions. 2023 Emissions have
changed by -18.3% (-144.85 Gg CO2 /
year). 1990-2023 Emissions have changed by -16.0% (-86.96 Gg CO2 / year). For 2023
the changes per gas
are:

For 1990-2023 the changes per gas are:
third party scenario (HISTTP):
Most important changes per time frame
For 2023 the following sector-gas combinations have the highest absolute impact on national total KyotoGHG (AR6GWP100) emissions in 2023 (top 5):
- 1: 4, CH4 with -6203.23 Gg CO2 / year (-68.1%)
- 2: 1.B.1, CH4 with -3861.86 Gg CO2 / year (-34.6%)
- 3: 3.A, CH4 with -1522.37 Gg CO2 / year (-3.7%)
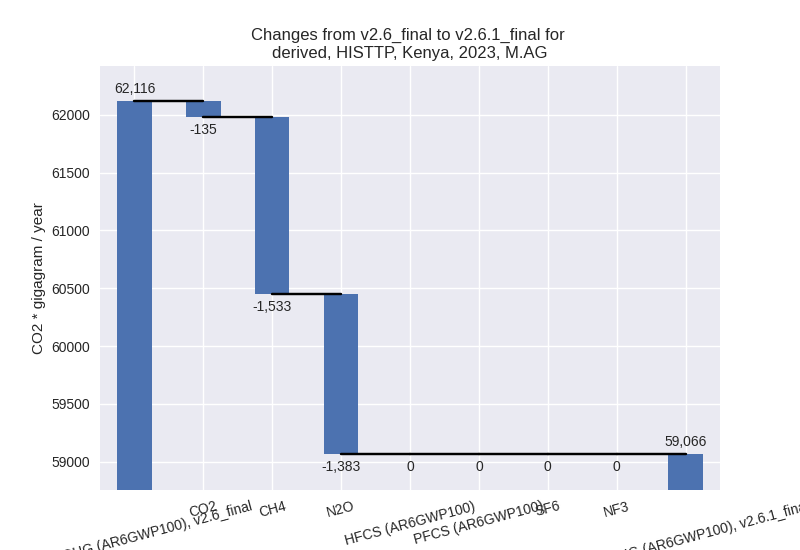
- 4: M.AG.ELV, N2O with -1365.15 Gg CO2 / year (-6.9%)
- 5: 2, CO2 with -1313.09 Gg CO2 / year (-26.0%)
For 1990-2023 the following sector-gas combinations have the highest absolute impact on national total KyotoGHG (AR6GWP100) emissions in 1990-2023 (top 5):
- 1: 4, CH4 with -4167.36 Gg CO2 / year (-69.9%)
- 2: 1.B.1, CH4 with -2467.77 Gg CO2 / year (-31.1%)
- 3: 2, CO2 with -523.85 Gg CO2 / year (-26.0%)
- 4: 1.A, CH4 with -300.05 Gg CO2 / year (-10.4%)
- 5: 5, N2O with -86.96 Gg CO2 / year (-16.0%)
Changes in the main sectors for aggregate KyotoGHG (AR6GWP100) are
- 1: Total sectoral emissions in 2022 are 30531.76 Gg
CO2 / year which is 32.2% of M.0.EL emissions. 2023 Emissions have
changed by -12.9% (-4593.21 Gg CO2 /
year). 1990-2023 Emissions have changed by -12.9% (-2820.65 Gg CO2 / year). For 2023
the changes per gas
are:
For 1990-2023 the changes per gas are:
The changes come from the following subsectors:- 1.A: Total sectoral emissions in 2022 are 23142.35
Gg CO2 / year which is 75.8% of category 1 emissions. 2023 Emissions
have changed by -2.8% (-680.15 Gg
CO2 / year). 1990-2023 Emissions have changed by -2.3% (-320.16 Gg CO2 / year). For 2023
the changes per gas
are:
For 1990-2023 the changes per gas are: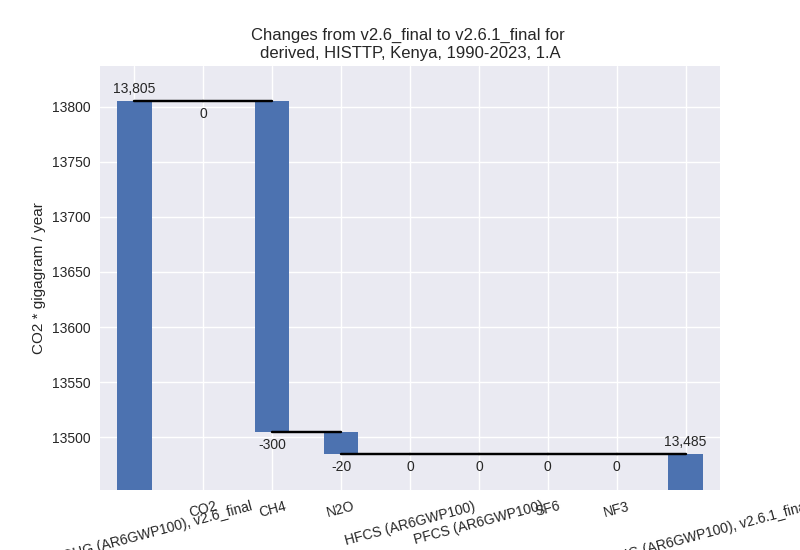
There is no subsector information available in PRIMAP-hist. - 1.B.1: Total sectoral emissions in 2022 are 7389.41
Gg CO2 / year which is 24.2% of category 1 emissions. 2023 Emissions
have changed by -34.6% (-3913.06 Gg
CO2 / year). 1990-2023 Emissions have changed by -31.1% (-2500.48 Gg CO2 / year). For 2023
the changes per gas
are:
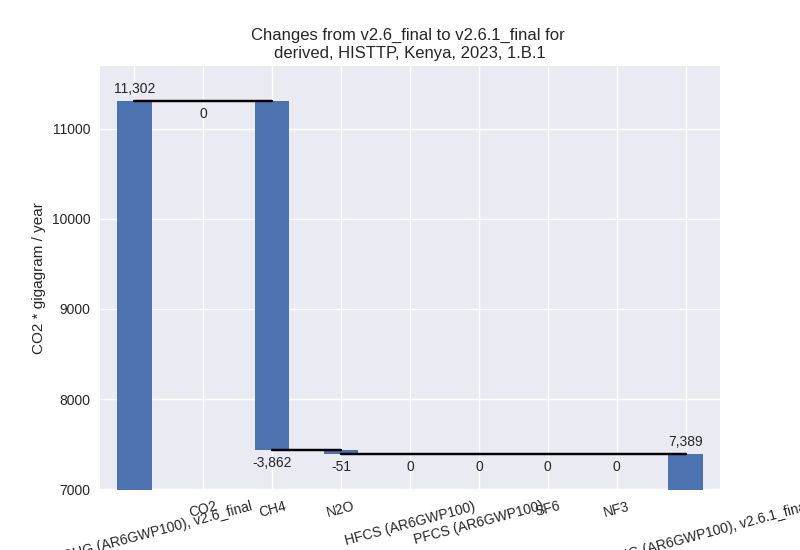
For 1990-2023 the changes per gas are: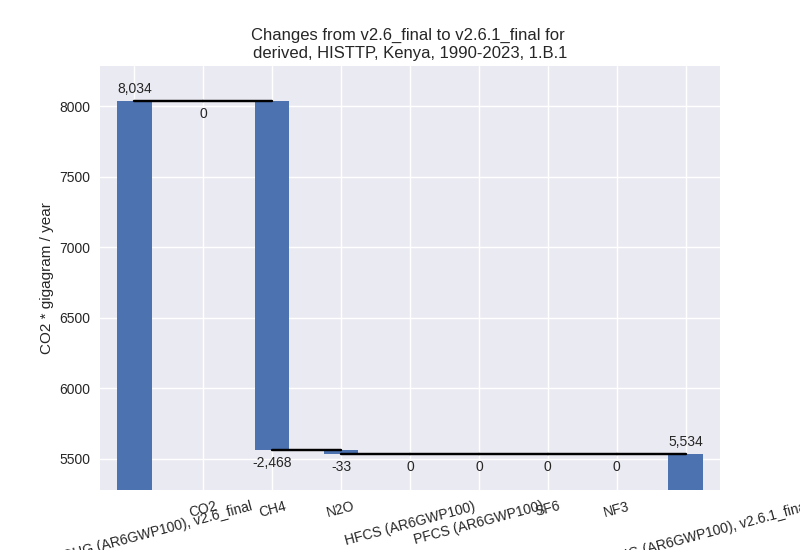
There is no subsector information available in PRIMAP-hist. - 1.B.2: Total sectoral emissions in 2022 are 0.00 Gg CO2 / year which is 0.0% of category 1 emissions. 2023 Emissions have changed by 0.0% (0.00 Gg CO2 / year). 1990-2023 Emissions have changed by 0.0% (0.00 Gg CO2 / year).
- 1.A: Total sectoral emissions in 2022 are 23142.35
Gg CO2 / year which is 75.8% of category 1 emissions. 2023 Emissions
have changed by -2.8% (-680.15 Gg
CO2 / year). 1990-2023 Emissions have changed by -2.3% (-320.16 Gg CO2 / year). For 2023
the changes per gas
are:
- 2: Total sectoral emissions in 2022 are 3979.34 Gg
CO2 / year which is 4.2% of M.0.EL emissions. 2023 Emissions have
changed by -25.1% (-1313.85 Gg CO2 /
year). 1990-2023 Emissions have changed by -25.2% (-524.40 Gg CO2 / year). For 2023
the changes per gas
are:
For 1990-2023 the changes per gas are:
- M.AG: Total sectoral emissions in 2022 are 56357.80
Gg CO2 / year which is 59.4% of M.0.EL emissions. 2023 Emissions have
changed by -4.9% (-3050.03 Gg CO2 /
year). 1990-2023 Emissions have changed by -0.3% (-126.04 Gg CO2 / year). For 2023
the changes per gas
are:
The changes come from the following subsectors:- 3.A: Total sectoral emissions in 2022 are 38202.40
Gg CO2 / year which is 67.8% of category M.AG emissions. 2023 Emissions
have changed by -3.7% (-1540.05 Gg
CO2 / year). 1990-2023 Emissions have changed by -0.2% (-55.58 Gg CO2 / year). For 2023 the
changes per gas
are:

There is no subsector information available in PRIMAP-hist. - M.AG.ELV: Total sectoral emissions in 2022 are
18155.40 Gg CO2 / year which is 32.2% of category M.AG emissions. 2023
Emissions have changed by -7.4%
(-1509.98 Gg CO2 / year). 1990-2023 Emissions have changed by -0.6% (-70.46 Gg CO2 / year). For 2023 the
changes per gas
are:
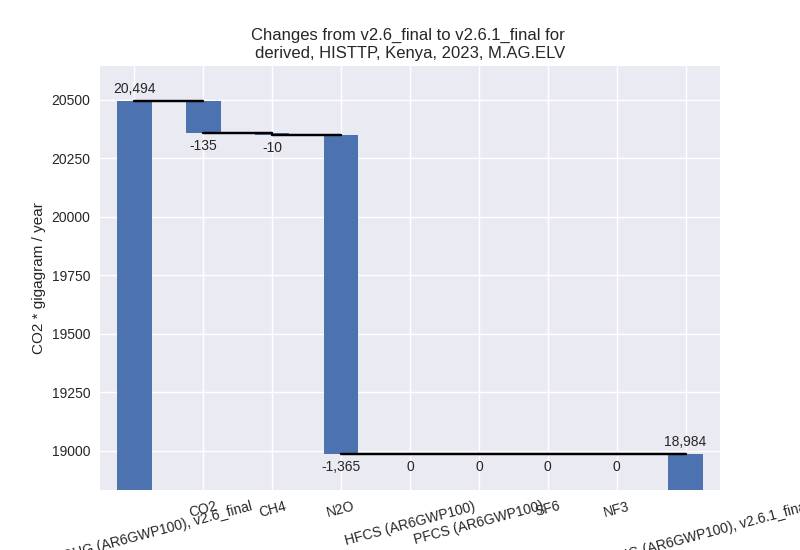
There is no subsector information available in PRIMAP-hist.
- 3.A: Total sectoral emissions in 2022 are 38202.40
Gg CO2 / year which is 67.8% of category M.AG emissions. 2023 Emissions
have changed by -3.7% (-1540.05 Gg
CO2 / year). 1990-2023 Emissions have changed by -0.2% (-55.58 Gg CO2 / year). For 2023 the
changes per gas
are:
- 4: Total sectoral emissions in 2022 are 3386.02 Gg
CO2 / year which is 3.6% of M.0.EL emissions. 2023 Emissions have
changed by -64.1% (-6226.22 Gg CO2 /
year). 1990-2023 Emissions have changed by -65.5% (-4169.27 Gg CO2 / year). For 2023
the changes per gas
are:

For 1990-2023 the changes per gas are:
- 5: Total sectoral emissions in 2022 are 644.11 Gg
CO2 / year which is 0.7% of M.0.EL emissions. 2023 Emissions have
changed by -18.3% (-144.85 Gg CO2 /
year). 1990-2023 Emissions have changed by -16.0% (-86.96 Gg CO2 / year). For 2023
the changes per gas
are:
For 1990-2023 the changes per gas are: