Changes in PRIMAP-hist v2.6.1_final compared to v2.6_final for Kyrgyzstan
2025-03-19
Johannes Gütschow
Change analysis for Kyrgyzstan for PRIMAP-hist v2.6.1_final compared to v2.6_final
Overview over emissions by sector and gas
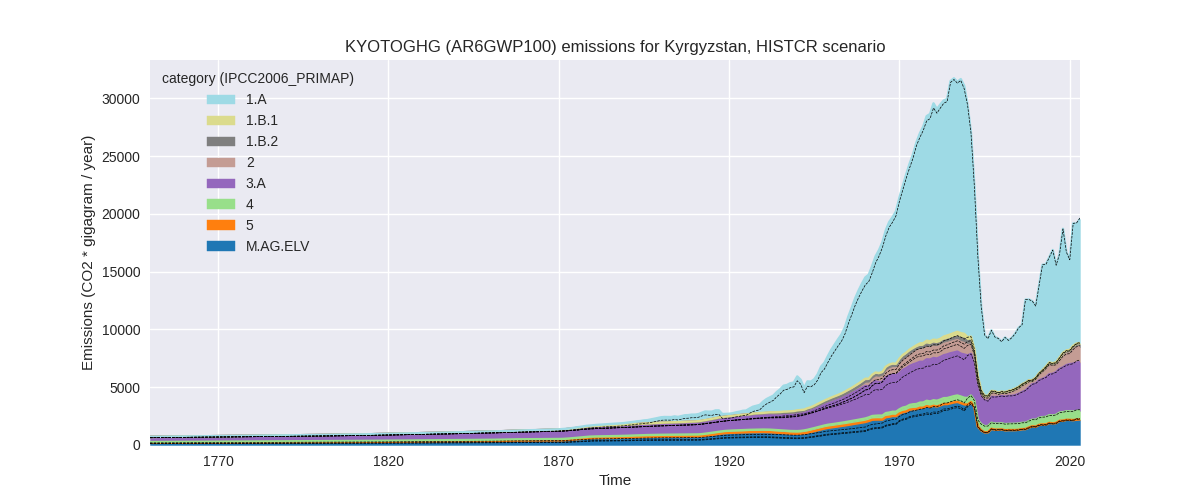
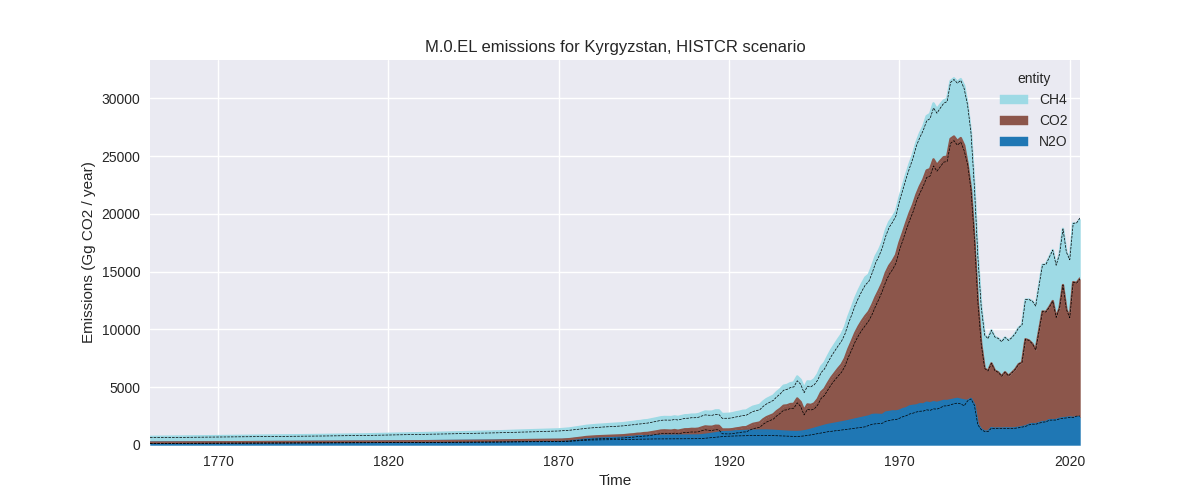
The following figures show the aggregate national total emissions excluding LULUCF AR6GWP100 for the country reported priority scenario. The dotted linesshow the v2.6_final data.
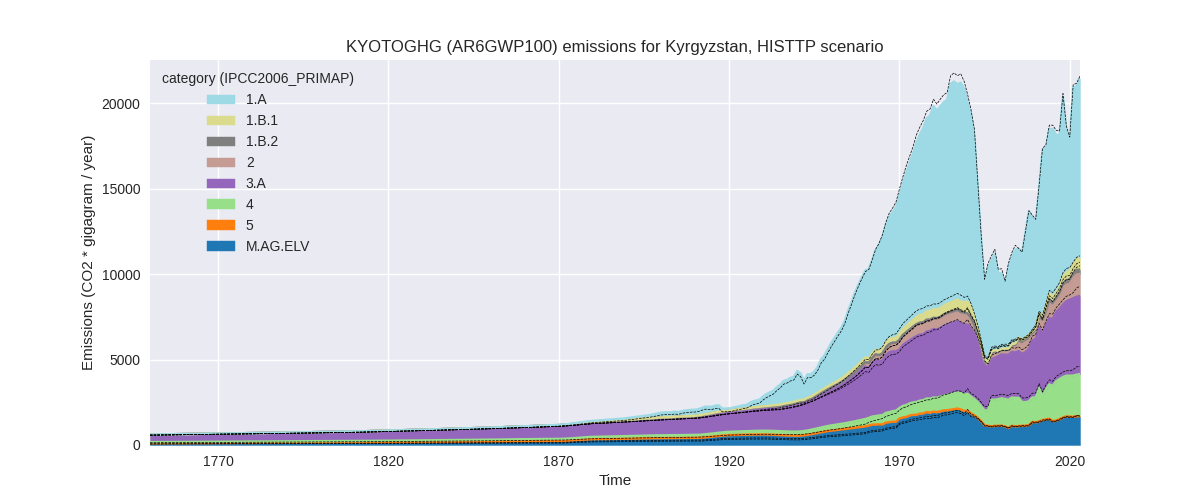
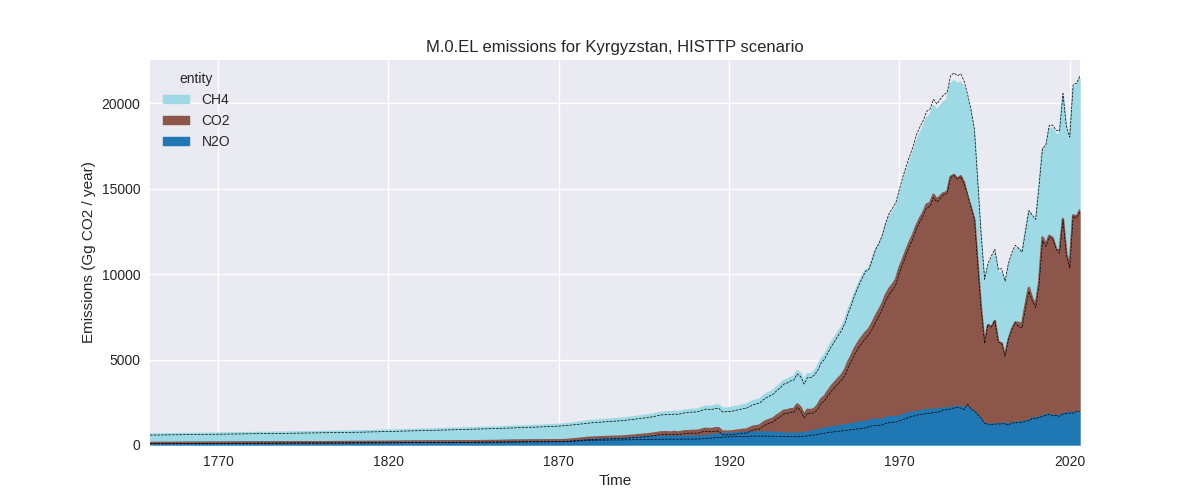
The following figures show the aggregate national total emissions excluding LULUCF AR6GWP100 for the third party priority scenario. The dotted linesshow the v2.6_final data.
Overview over changes
In the country reported priority scenario we have the following changes for aggregate Kyoto GHG and national total emissions excluding LULUCF (M.0.EL):
- Emissions in 2023 have changed by -0.4%% (-77.19 Gg CO2 / year)
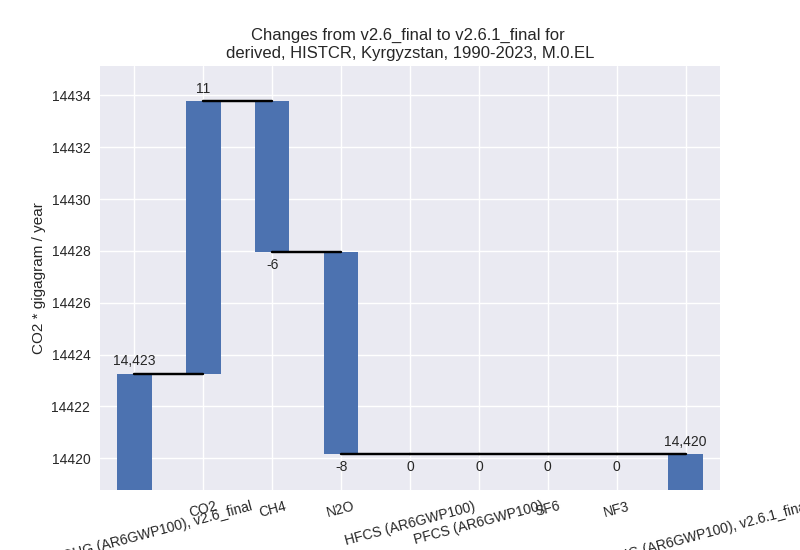
- Emissions in 1990-2023 have changed by -0.0%% (-3.10 Gg CO2 / year)
In the third party priority scenario we have the following changes for aggregate Kyoto GHG and national total emissions excluding LULUCF (M.0.EL):
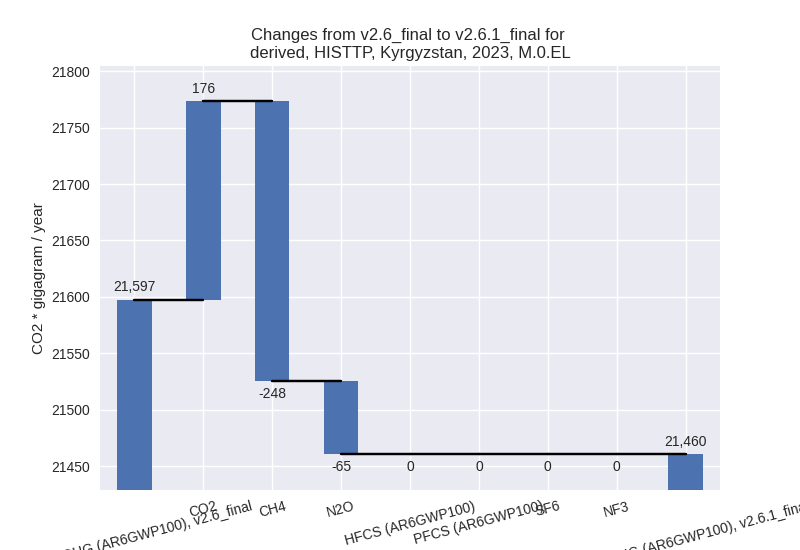
- Emissions in 2023 have changed by -0.6%% (-136.89 Gg CO2 / year)
- Emissions in 1990-2023 have changed by -1.4%% (-218.99 Gg CO2 / year)
Most important changes per scenario and time frame
In the country reported priority scenario the following sector-gas combinations have the highest absolute impact on national total KyotoGHG (AR6GWP100) emissions in 2023 (top 5):
- 1: 3.A, CH4 with -112.38 Gg CO2 / year (-2.8%)
- 2: 2, CO2 with 98.42 Gg CO2 / year (8.0%)
- 3: M.AG.ELV, N2O with -70.90 Gg CO2 / year (-3.5%)
- 4: 1.B.1, CH4 with 40.14 Gg CO2 / year (87.1%)
- 5: M.AG.ELV, CO2 with 32.17 Gg CO2 / year (33.5%)
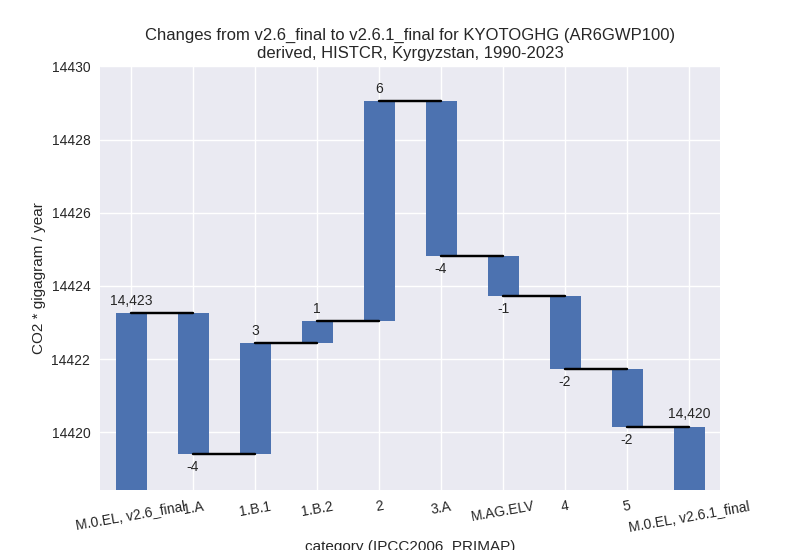
In the country reported priority scenario the following sector-gas combinations have the highest absolute impact on national total KyotoGHG (AR6GWP100) emissions in 1990-2023 (top 5):
- 1: 2, CO2 with 6.01 Gg CO2 / year (1.0%)
- 2: M.AG.ELV, N2O with -5.29 Gg CO2 / year (-0.3%)
- 3: M.AG.ELV, CO2 with 4.78 Gg CO2 / year (5.7%)
- 4: 3.A, CH4 with -3.88 Gg CO2 / year (-0.1%)
- 5: 1.A, CH4 with -3.25 Gg CO2 / year (-2.4%)
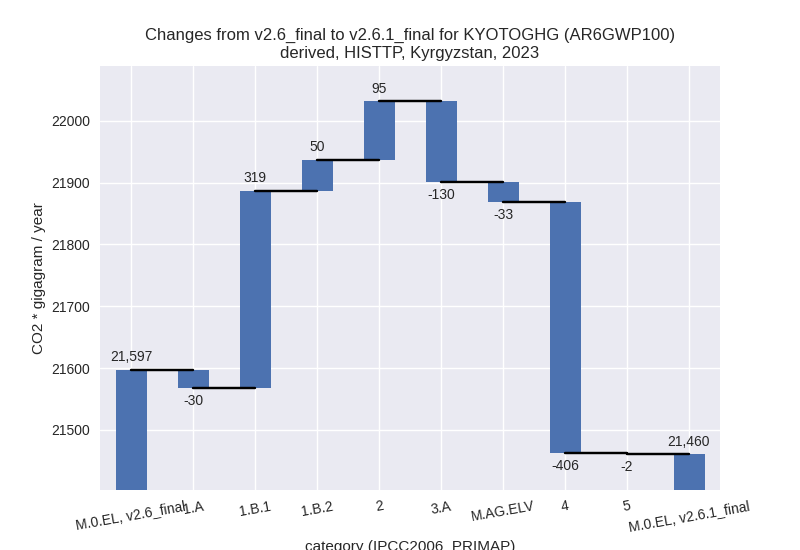
In the third party priority scenario the following sector-gas combinations have the highest absolute impact on national total KyotoGHG (AR6GWP100) emissions in 2023 (top 5):
- 1: 4, CH4 with -406.03 Gg CO2 / year (-14.7%)
- 2: 1.B.1, CH4 with 312.79 Gg CO2 / year (87.1%)
- 3: 3.A, CH4 with -121.75 Gg CO2 / year (-2.8%)
- 4: 2, CO2 with 94.59 Gg CO2 / year (7.9%)
- 5: M.AG.ELV, N2O with -52.30 Gg CO2 / year (-3.5%)
In the third party priority scenario the following sector-gas combinations have the highest absolute impact on national total KyotoGHG (AR6GWP100) emissions in 1990-2023 (top 5):
- 1: 4, CH4 with -266.17 Gg CO2 / year (-14.5%)
- 2: 1.B.2, CO2 with 58.25 Gg CO2 / year (2470.9%)
- 3: 1.B.1, CH4 with 21.31 Gg CO2 / year (9.5%)
- 4: 1.A, N2O with -16.80 Gg CO2 / year (-24.0%)
- 5: 1.A, CH4 with -7.49 Gg CO2 / year (-8.5%)
Notes on data changes
Here we list notes explaining important emissions changes for the country.
- No new country reported data has been included. Changes in the CR time-series are small and come from updated third party data (EDGAR, FAO) which is used to extrapolate the country reported data.
- Total changes in the TP time series are small as well because sectoral changes partly cancel. The new EDGAR data leads to changes for waste and fugitive emissions. For 2023 the new FAO data introduces small changes in agricultural sectors as it replaces numerical extrapolation.
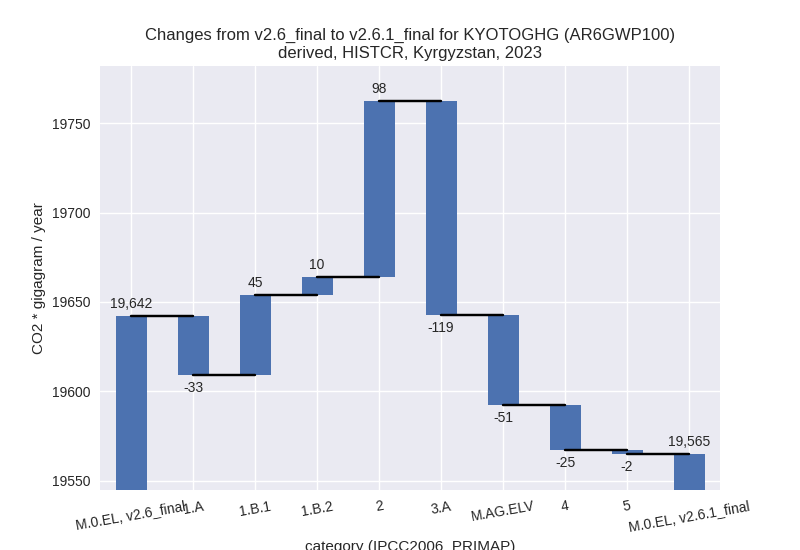
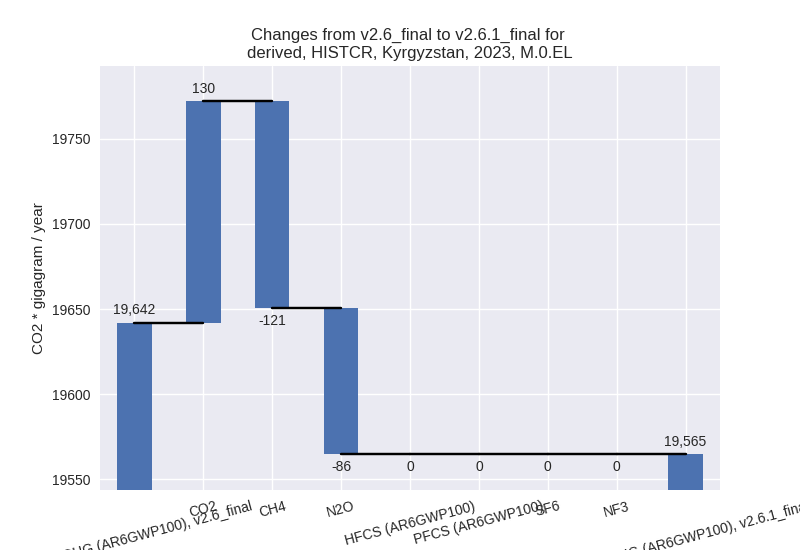
Changes by sector and gas
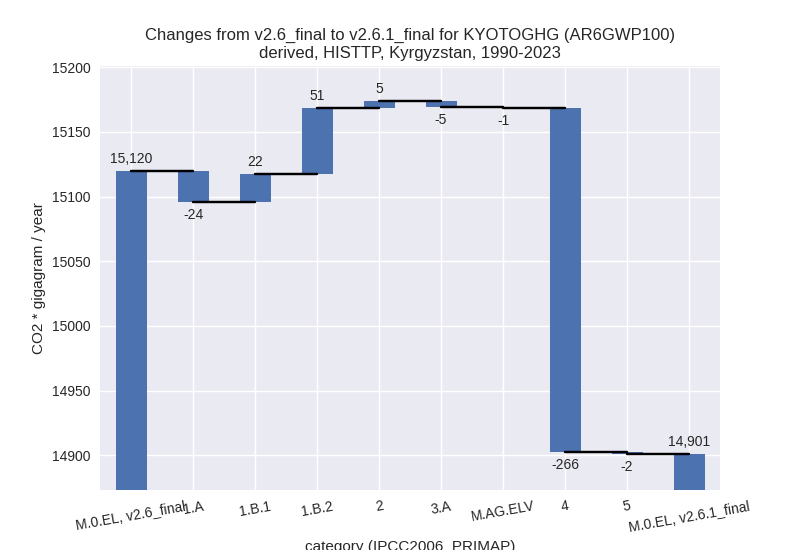
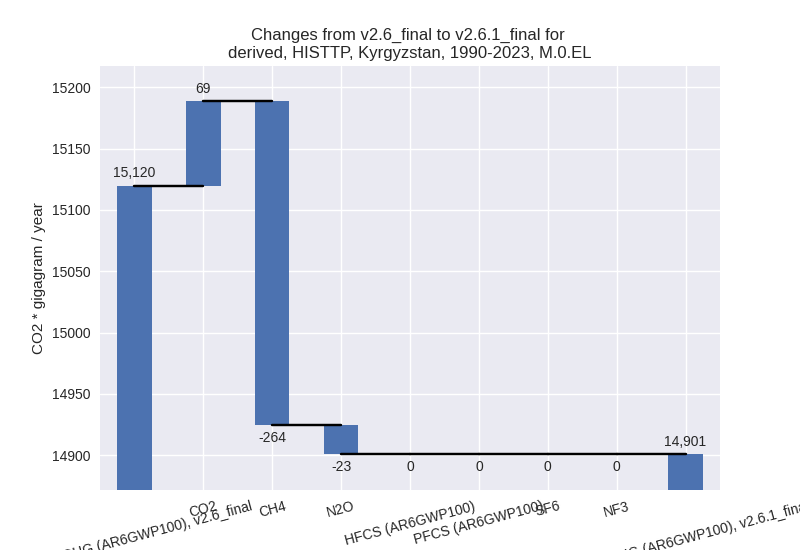
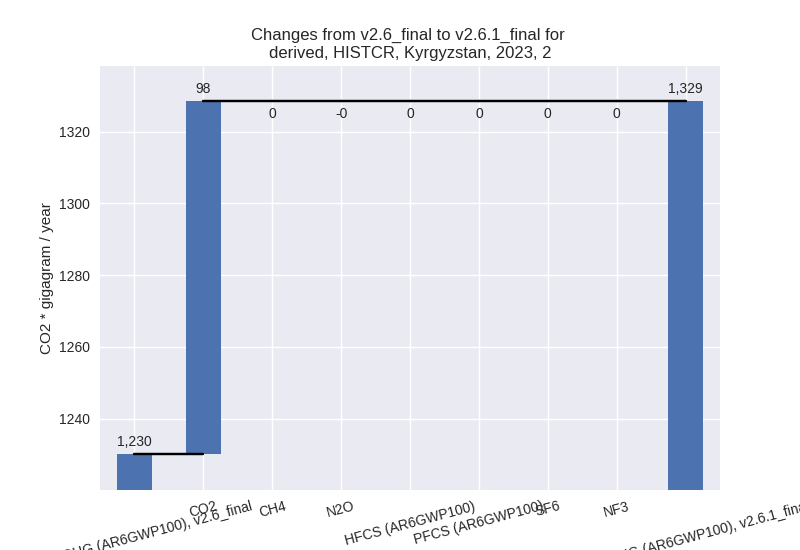
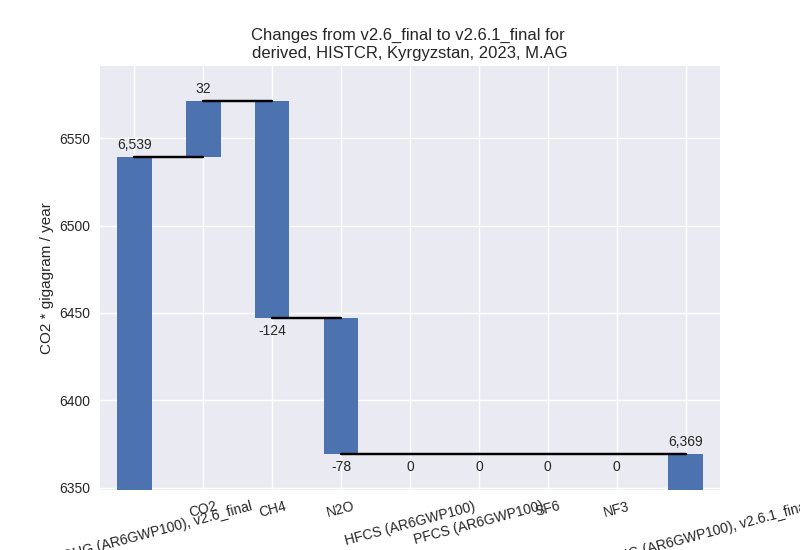
For each scenario and time frame the changes are displayed for all individual sectors and all individual gases. In the sector plot we use aggregate Kyoto GHGs in AR6GWP100. In the gas plot we usenational total emissions without LULUCF.
country reported scenario
2023
1990-2023
third party scenario
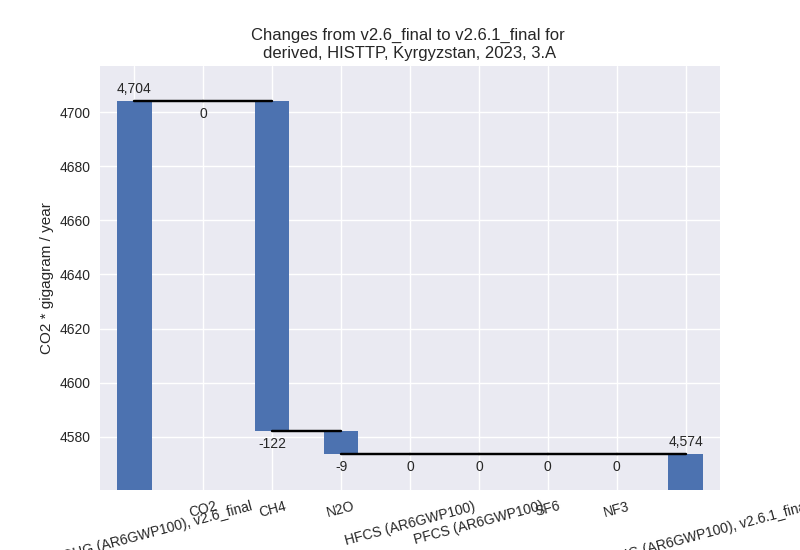
2023
1990-2023
Detailed changes for the scenarios:
country reported scenario (HISTCR):
Most important changes per time frame
For 2023 the following sector-gas combinations have the highest absolute impact on national total KyotoGHG (AR6GWP100) emissions in 2023 (top 5):
- 1: 3.A, CH4 with -112.38 Gg CO2 / year (-2.8%)
- 2: 2, CO2 with 98.42 Gg CO2 / year (8.0%)
- 3: M.AG.ELV, N2O with -70.90 Gg CO2 / year (-3.5%)
- 4: 1.B.1, CH4 with 40.14 Gg CO2 / year (87.1%)
- 5: M.AG.ELV, CO2 with 32.17 Gg CO2 / year (33.5%)
For 1990-2023 the following sector-gas combinations have the highest absolute impact on national total KyotoGHG (AR6GWP100) emissions in 1990-2023 (top 5):
- 1: 2, CO2 with 6.01 Gg CO2 / year (1.0%)
- 2: M.AG.ELV, N2O with -5.29 Gg CO2 / year (-0.3%)
- 3: M.AG.ELV, CO2 with 4.78 Gg CO2 / year (5.7%)
- 4: 3.A, CH4 with -3.88 Gg CO2 / year (-0.1%)
- 5: 1.A, CH4 with -3.25 Gg CO2 / year (-2.4%)
Changes in the main sectors for aggregate KyotoGHG (AR6GWP100) are
- 1: Total sectoral emissions in 2022 are 10698.20 Gg CO2 / year which is 55.9% of M.0.EL emissions. 2023 Emissions have changed by 0.2% (21.82 Gg CO2 / year). 1990-2023 Emissions have changed by -0.0% (-0.22 Gg CO2 / year).
- 2: Total sectoral emissions in 2022 are 1328.44 Gg
CO2 / year which is 6.9% of M.0.EL emissions. 2023 Emissions have
changed by 8.0% (98.42 Gg CO2 /
year). 1990-2023 Emissions have changed by 1.0% (6.01 Gg CO2 / year). For 2023 the
changes per gas
are:
- M.AG: Total sectoral emissions in 2022 are 6341.23
Gg CO2 / year which is 33.1% of M.0.EL emissions. 2023 Emissions have
changed by -2.6% (-169.94 Gg CO2 /
year). 1990-2023 Emissions have changed by -0.1% (-5.32 Gg CO2 / year). For 2023 the
changes per gas
are:
The changes come from the following subsectors:- 3.A: Total sectoral emissions in 2022 are 4180.69
Gg CO2 / year which is 65.9% of category M.AG emissions. 2023 Emissions
have changed by -2.8% (-119.34 Gg
CO2 / year). 1990-2023 Emissions have changed by -0.1% (-4.23 Gg CO2 / year). For 2023 the
changes per gas
are:

There is no subsector information available in PRIMAP-hist. - M.AG.ELV: Total sectoral emissions in 2022 are
2160.54 Gg CO2 / year which is 34.1% of category M.AG emissions. 2023
Emissions have changed by -2.3%
(-50.60 Gg CO2 / year). 1990-2023 Emissions have changed by -0.1% (-1.09 Gg CO2 / year). For 2023 the
changes per gas
are:
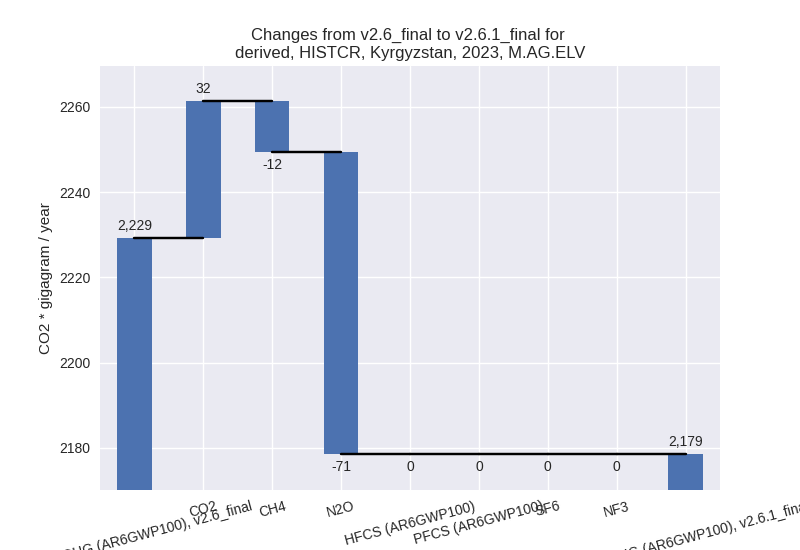
There is no subsector information available in PRIMAP-hist.
- 3.A: Total sectoral emissions in 2022 are 4180.69
Gg CO2 / year which is 65.9% of category M.AG emissions. 2023 Emissions
have changed by -2.8% (-119.34 Gg
CO2 / year). 1990-2023 Emissions have changed by -0.1% (-4.23 Gg CO2 / year). For 2023 the
changes per gas
are:
- 4: Total sectoral emissions in 2022 are 751.06 Gg
CO2 / year which is 3.9% of M.0.EL emissions. 2023 Emissions have
changed by -3.2% (-25.30 Gg CO2 /
year). 1990-2023 Emissions have changed by -0.3% (-1.99 Gg CO2 / year). For 2023 the
changes per gas
are:

- 5: Total sectoral emissions in 2022 are 34.37 Gg
CO2 / year which is 0.2% of M.0.EL emissions. 2023 Emissions have
changed by -5.9% (-2.18 Gg CO2 /
year). 1990-2023 Emissions have changed by -3.3% (-1.58 Gg CO2 / year). For 2023 the
changes per gas
are:

For 1990-2023 the changes per gas are: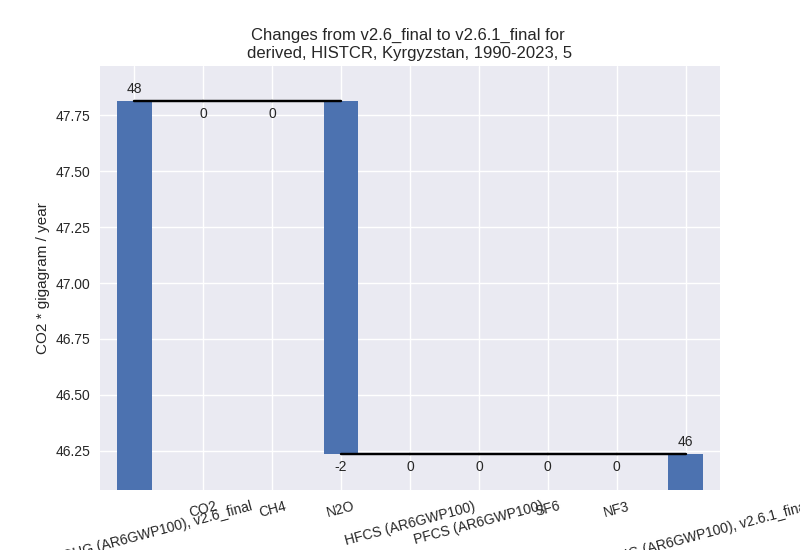
third party scenario (HISTTP):
Most important changes per time frame
For 2023 the following sector-gas combinations have the highest absolute impact on national total KyotoGHG (AR6GWP100) emissions in 2023 (top 5):
- 1: 4, CH4 with -406.03 Gg CO2 / year (-14.7%)
- 2: 1.B.1, CH4 with 312.79 Gg CO2 / year (87.1%)
- 3: 3.A, CH4 with -121.75 Gg CO2 / year (-2.8%)
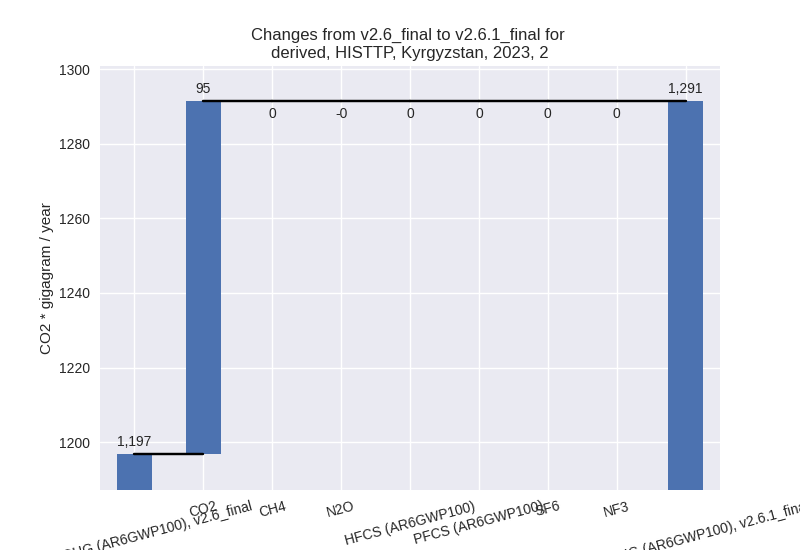
- 4: 2, CO2 with 94.59 Gg CO2 / year (7.9%)
- 5: M.AG.ELV, N2O with -52.30 Gg CO2 / year (-3.5%)
For 1990-2023 the following sector-gas combinations have the highest absolute impact on national total KyotoGHG (AR6GWP100) emissions in 1990-2023 (top 5):
- 1: 4, CH4 with -266.17 Gg CO2 / year (-14.5%)
- 2: 1.B.2, CO2 with 58.25 Gg CO2 / year (2470.9%)
- 3: 1.B.1, CH4 with 21.31 Gg CO2 / year (9.5%)
- 4: 1.A, N2O with -16.80 Gg CO2 / year (-24.0%)
- 5: 1.A, CH4 with -7.49 Gg CO2 / year (-8.5%)
Changes in the main sectors for aggregate KyotoGHG (AR6GWP100) are
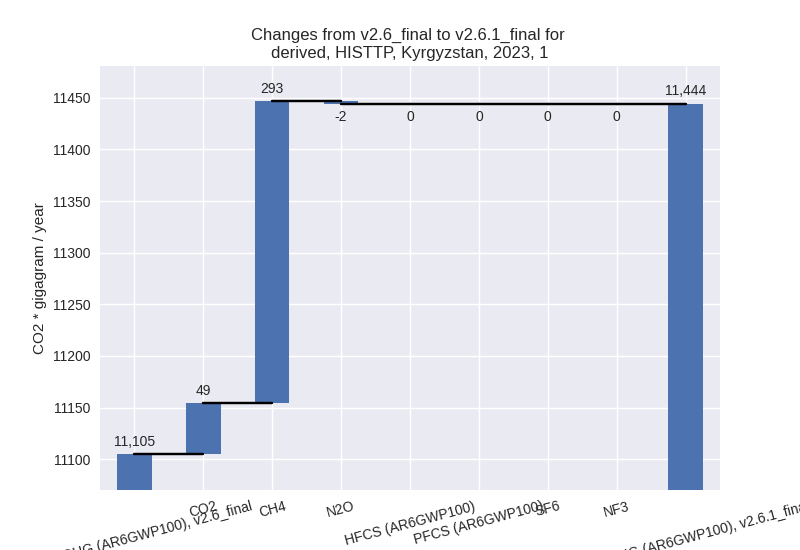
- 1: Total sectoral emissions in 2022 are 11018.65 Gg
CO2 / year which is 52.5% of M.0.EL emissions. 2023 Emissions have
changed by 3.1% (339.64 Gg CO2 /
year). 1990-2023 Emissions have changed by 0.6% (48.52 Gg CO2 / year). For 2023 the
changes per gas
are:
The changes come from the following subsectors:- 1.A: Total sectoral emissions in 2022 are 10136.12 Gg CO2 / year which is 92.0% of category 1 emissions. 2023 Emissions have changed by -0.3% (-29.57 Gg CO2 / year). 1990-2023 Emissions have changed by -0.3% (-24.29 Gg CO2 / year).
- 1.B.1: Total sectoral emissions in 2022 are 624.25
Gg CO2 / year which is 5.7% of category 1 emissions. 2023 Emissions have
changed by 87.2% (319.24 Gg CO2 /
year). 1990-2023 Emissions have changed by 9.5% (21.75 Gg CO2 / year). For 2023 the
changes per gas
are:
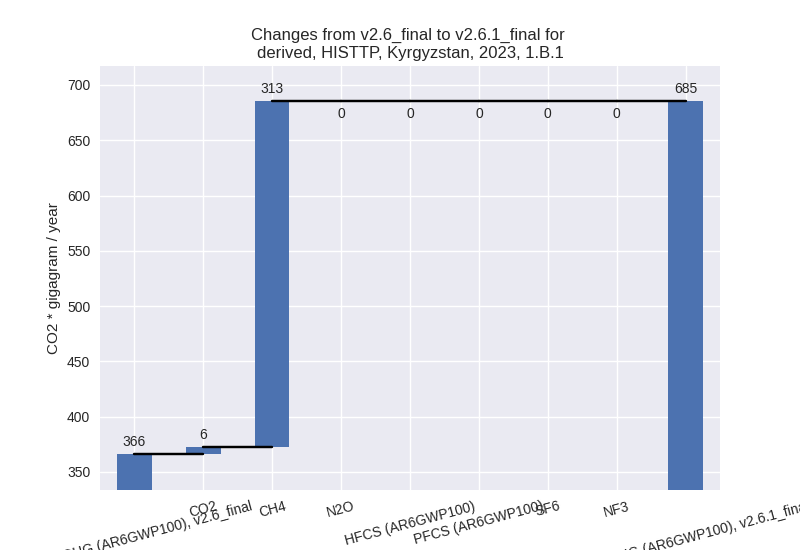
For 1990-2023 the changes per gas are:
There is no subsector information available in PRIMAP-hist. - 1.B.2: Total sectoral emissions in 2022 are 258.28
Gg CO2 / year which is 2.3% of category 1 emissions. 2023 Emissions have
changed by 23.1% (49.97 Gg CO2 /
year). 1990-2023 Emissions have changed by 59.1% (51.06 Gg CO2 / year). For 2023 the
changes per gas
are:
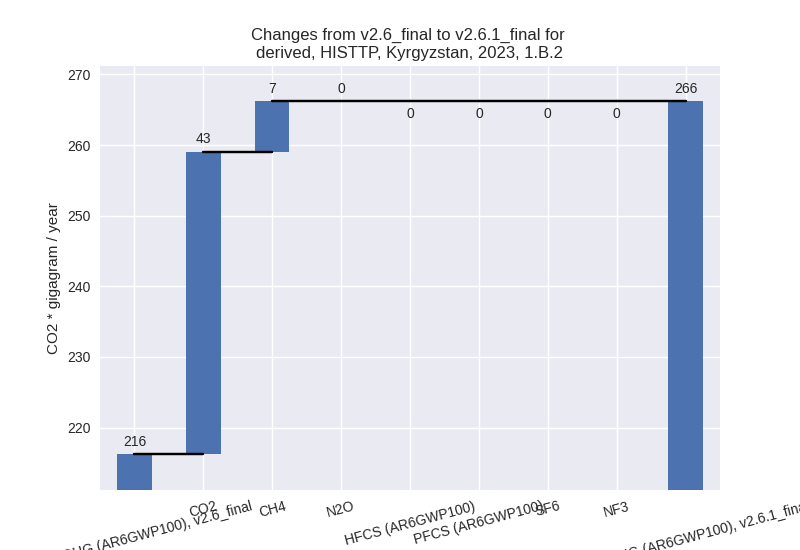
For 1990-2023 the changes per gas are: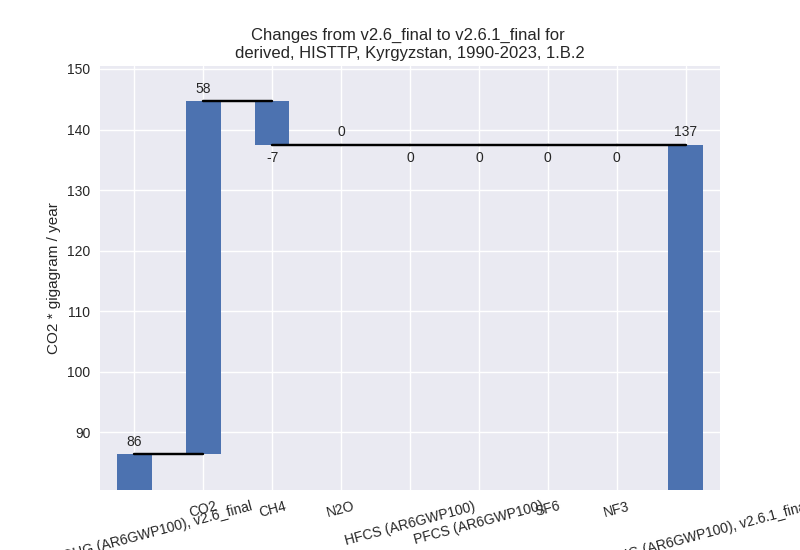
There is no subsector information available in PRIMAP-hist.
- 2: Total sectoral emissions in 2022 are 1291.08 Gg
CO2 / year which is 6.2% of M.0.EL emissions. 2023 Emissions have
changed by 7.9% (94.59 Gg CO2 /
year). 1990-2023 Emissions have changed by 1.0% (5.40 Gg CO2 / year). For 2023 the
changes per gas
are:
- M.AG: Total sectoral emissions in 2022 are 6211.25
Gg CO2 / year which is 29.6% of M.0.EL emissions. 2023 Emissions have
changed by -2.5% (-163.08 Gg CO2 /
year). 1990-2023 Emissions have changed by -0.1% (-5.19 Gg CO2 / year). For 2023 the
changes per gas
are:
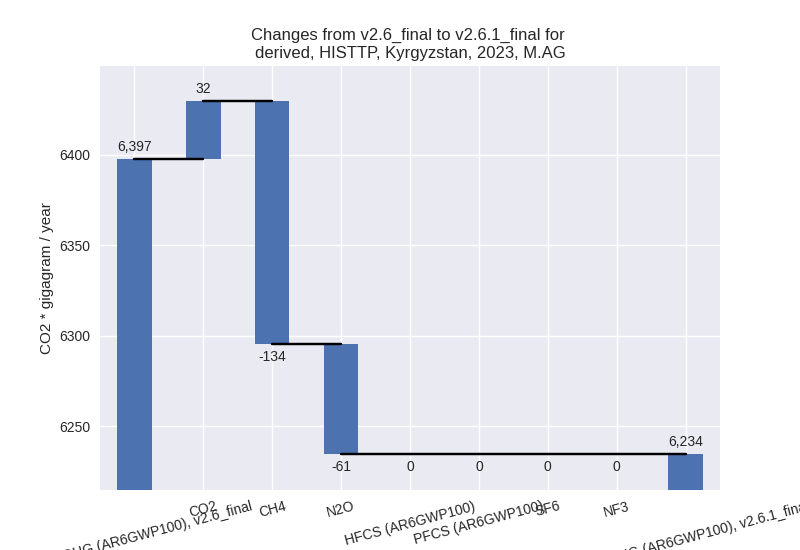
The changes come from the following subsectors:- 3.A: Total sectoral emissions in 2022 are 4562.92
Gg CO2 / year which is 73.5% of category M.AG emissions. 2023 Emissions
have changed by -2.8% (-130.33 Gg
CO2 / year). 1990-2023 Emissions have changed by -0.1% (-4.63 Gg CO2 / year). For 2023 the
changes per gas
are:
There is no subsector information available in PRIMAP-hist. - M.AG.ELV: Total sectoral emissions in 2022 are 1648.33 Gg CO2 / year which is 26.5% of category M.AG emissions. 2023 Emissions have changed by -1.9% (-32.75 Gg CO2 / year). 1990-2023 Emissions have changed by -0.0% (-0.56 Gg CO2 / year).
- 3.A: Total sectoral emissions in 2022 are 4562.92
Gg CO2 / year which is 73.5% of category M.AG emissions. 2023 Emissions
have changed by -2.8% (-130.33 Gg
CO2 / year). 1990-2023 Emissions have changed by -0.1% (-4.63 Gg CO2 / year). For 2023 the
changes per gas
are:
- 4: Total sectoral emissions in 2022 are 2431.94 Gg
CO2 / year which is 11.6% of M.0.EL emissions. 2023 Emissions have
changed by -14.2% (-405.86 Gg CO2 /
year). 1990-2023 Emissions have changed by -13.9% (-266.14 Gg CO2 / year). For 2023
the changes per gas
are:

For 1990-2023 the changes per gas are: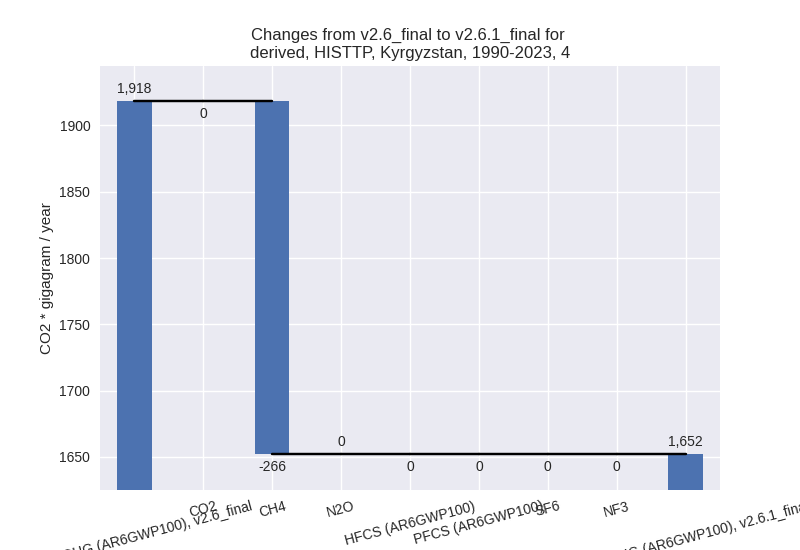
- 5: Total sectoral emissions in 2022 are 34.37 Gg
CO2 / year which is 0.2% of M.0.EL emissions. 2023 Emissions have
changed by -5.9% (-2.18 Gg CO2 /
year). 1990-2023 Emissions have changed by -3.3% (-1.58 Gg CO2 / year). For 2023 the
changes per gas
are:

For 1990-2023 the changes per gas are: