Changes in PRIMAP-hist v2.6.1_final compared to v2.6_final for Cambodia
2025-03-19
Johannes Gütschow
Change analysis for Cambodia for PRIMAP-hist v2.6.1_final compared to v2.6_final
Overview over emissions by sector and gas
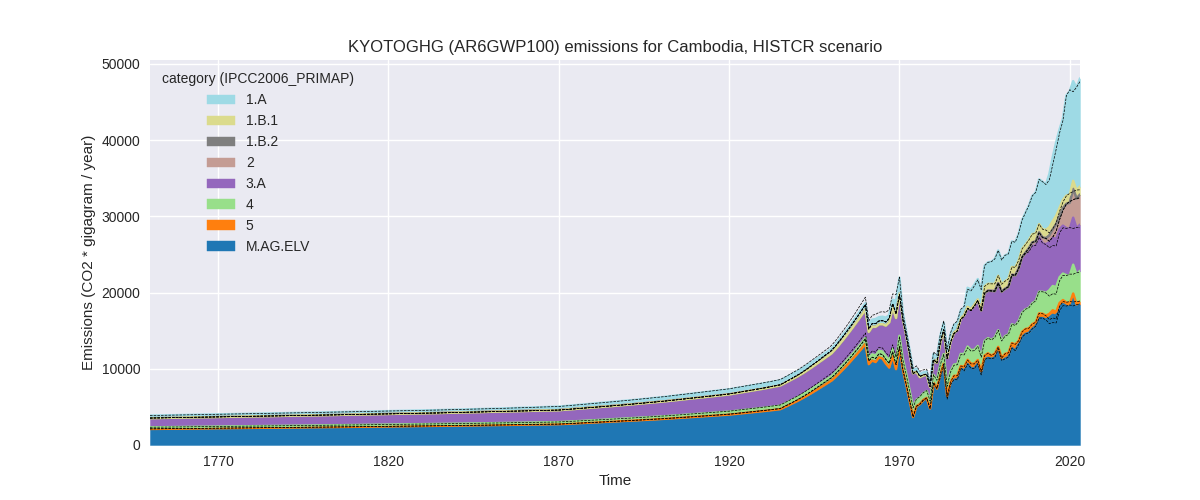
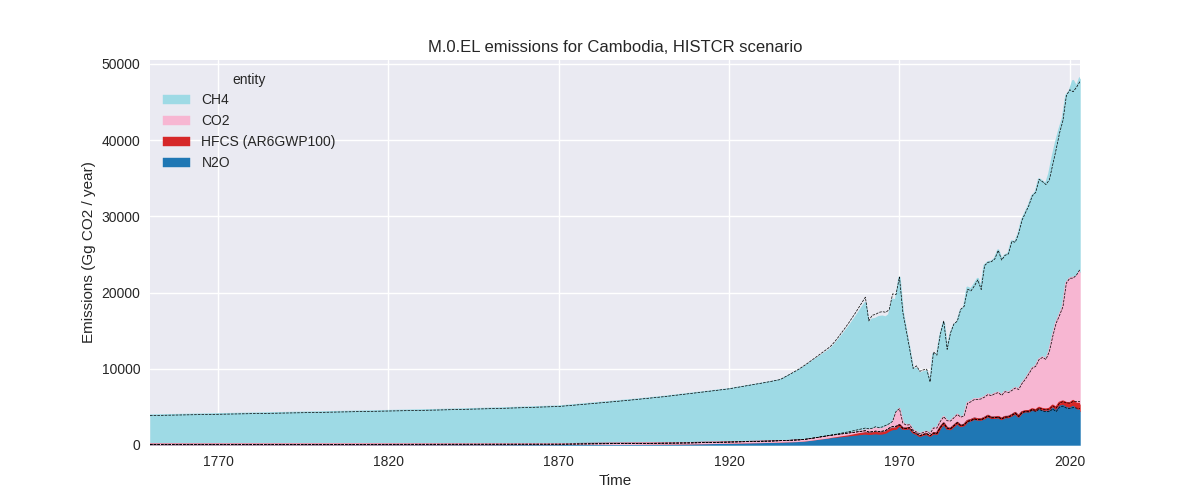
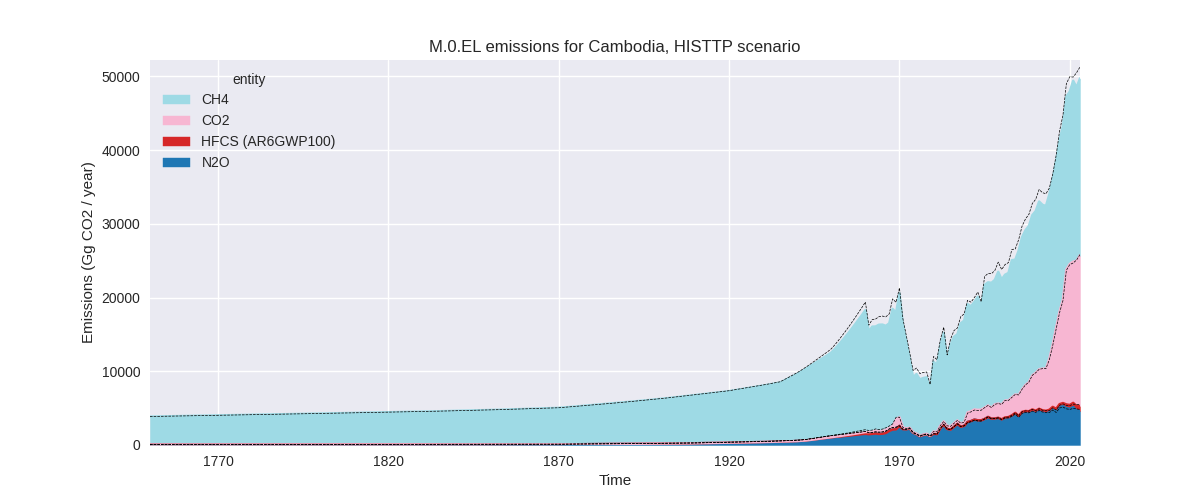
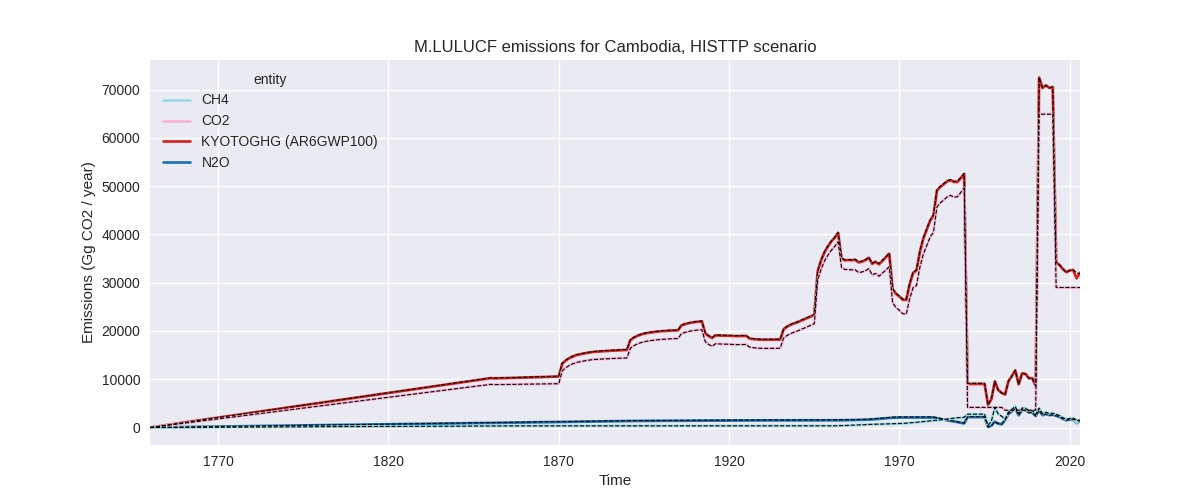
The following figures show the aggregate national total emissions excluding LULUCF AR6GWP100 for the country reported priority scenario. The dotted linesshow the v2.6_final data.
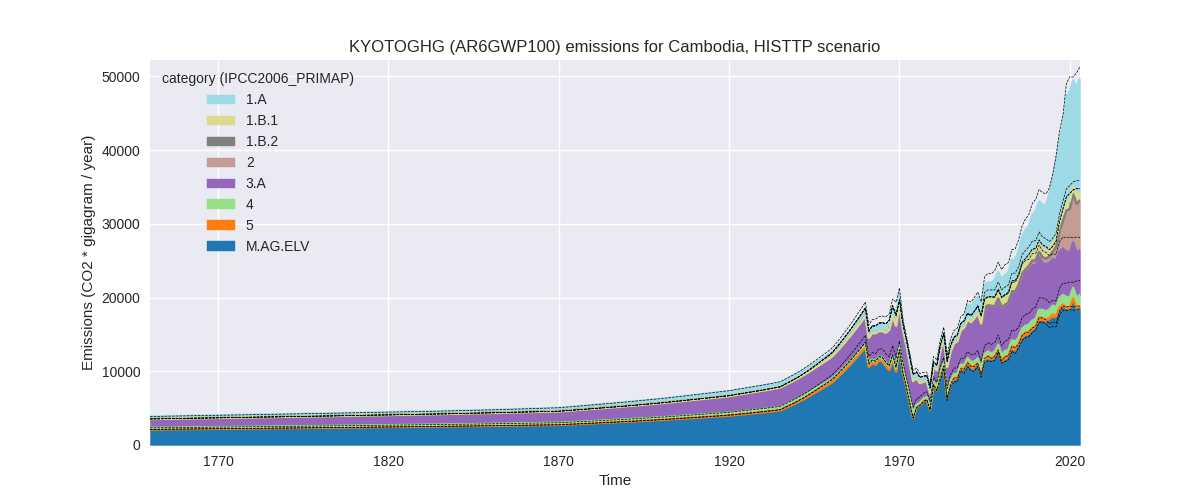
The following figures show the aggregate national total emissions excluding LULUCF AR6GWP100 for the third party priority scenario. The dotted linesshow the v2.6_final data.
Overview over changes
In the country reported priority scenario we have the following changes for aggregate Kyoto GHG and national total emissions excluding LULUCF (M.0.EL):
- Emissions in 2023 have changed by 0.9%% (411.72 Gg CO2 / year)
- Emissions in 1990-2023 have changed by 0.5%% (166.59 Gg CO2 / year)
In the third party priority scenario we have the following changes for aggregate Kyoto GHG and national total emissions excluding LULUCF (M.0.EL):
- Emissions in 2023 have changed by -3.0%% (-1540.49 Gg CO2 / year)
- Emissions in 1990-2023 have changed by -4.0%% (-1264.55 Gg CO2 / year)
Most important changes per scenario and time frame
In the country reported priority scenario the following sector-gas combinations have the highest absolute impact on national total KyotoGHG (AR6GWP100) emissions in 2023 (top 5):
- 1: M.AG.ELV, CH4 with 303.91 Gg CO2 / year (2.0%)
- 2: M.AG.ELV, N2O with -225.64 Gg CO2 / year (-7.0%)
- 3: 4, CH4 with 177.74 Gg CO2 / year (6.9%)
- 4: 3.A, CH4 with 174.15 Gg CO2 / year (3.3%)
- 5: 2, CO2 with 70.22 Gg CO2 / year (2.4%)
In the country reported priority scenario the following sector-gas combinations have the highest absolute impact on national total KyotoGHG (AR6GWP100) emissions in 1990-2023 (top 5):
- 1: M.AG.ELV, CH4 with 127.18 Gg CO2 / year (1.1%)
- 2: 4, CH4 with 31.29 Gg CO2 / year (1.8%)
- 3: M.AG.ELV, N2O with -13.39 Gg CO2 / year (-0.5%)
- 4: 3.A, CH4 with 13.33 Gg CO2 / year (0.2%)
- 5: 1.B.1, CH4 with 5.67 Gg CO2 / year (0.6%)
In the third party priority scenario the following sector-gas combinations have the highest absolute impact on national total KyotoGHG (AR6GWP100) emissions in 2023 (top 5):
- 1: 4, CH4 with -1944.19 Gg CO2 / year (-60.0%)
- 2: M.AG.ELV, CH4 with 303.91 Gg CO2 / year (2.0%)
- 3: M.AG.ELV, N2O with -225.64 Gg CO2 / year (-7.0%)
- 4: 3.A, CH4 with 174.15 Gg CO2 / year (3.3%)
- 5: 2, CO2 with 139.20 Gg CO2 / year (2.3%)
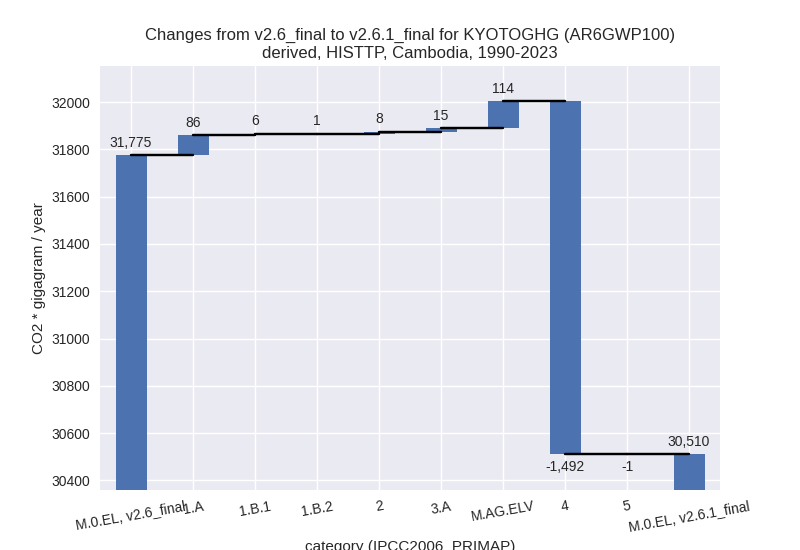
In the third party priority scenario the following sector-gas combinations have the highest absolute impact on national total KyotoGHG (AR6GWP100) emissions in 1990-2023 (top 5):
- 1: 4, CH4 with -1492.09 Gg CO2 / year (-64.7%)
- 2: M.AG.ELV, CH4 with 127.18 Gg CO2 / year (1.1%)
- 3: 1.A, CH4 with 45.83 Gg CO2 / year (7.0%)
- 4: 1.A, N2O with 39.93 Gg CO2 / year (23.1%)
- 5: M.AG.ELV, N2O with -13.39 Gg CO2 / year (-0.5%)
Notes on data changes
Here we list notes explaining important emissions changes for the country.
- No new country reported data has been included. Changes in the CR time-series are small and come from updated third party data (EDGAR, FAO) which is used to extrapolate the country reported data.
- In the TP scenario the main change is for waste CH4 and due to
updated EDGAR data.
- Further changes come from the agricultural sector and come from small changes for recent years in the FAO data.
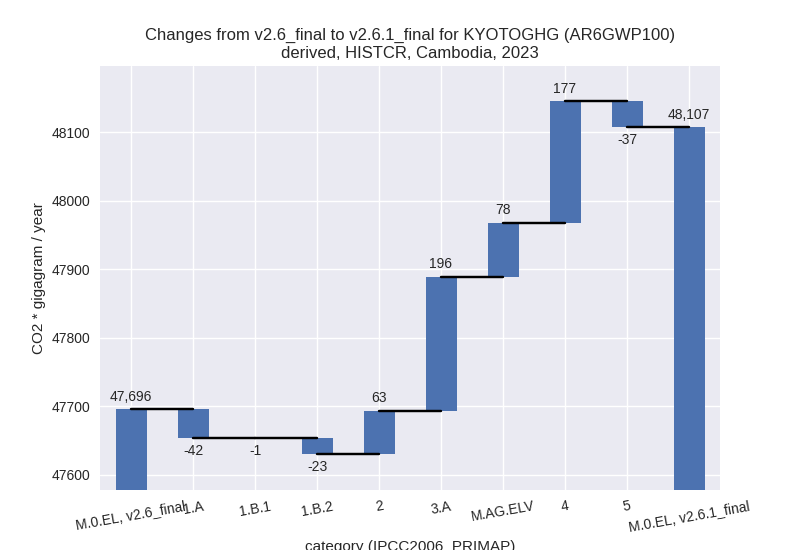
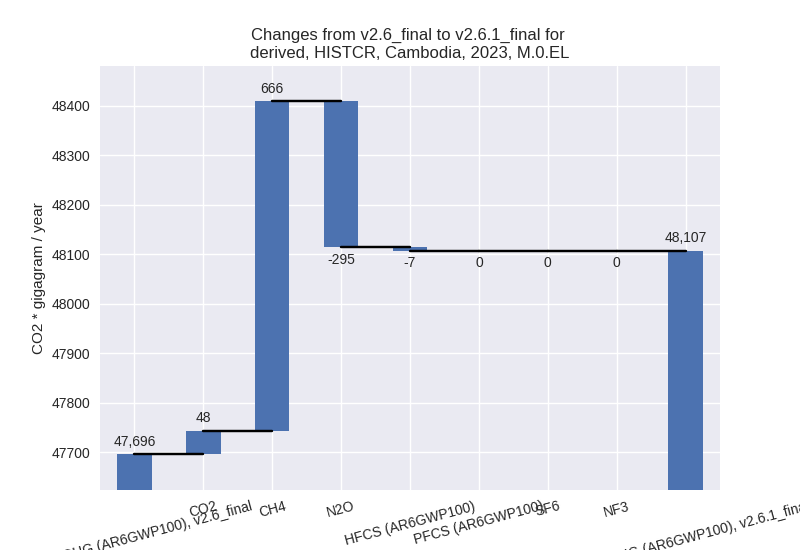
Changes by sector and gas
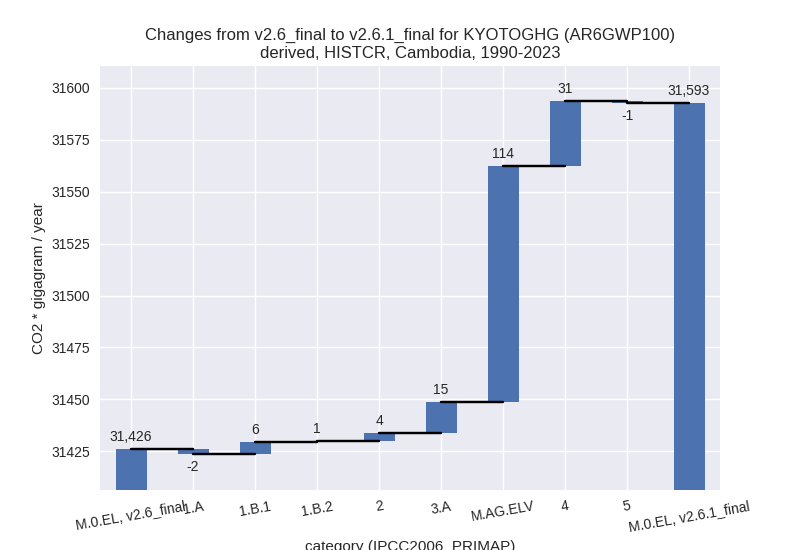
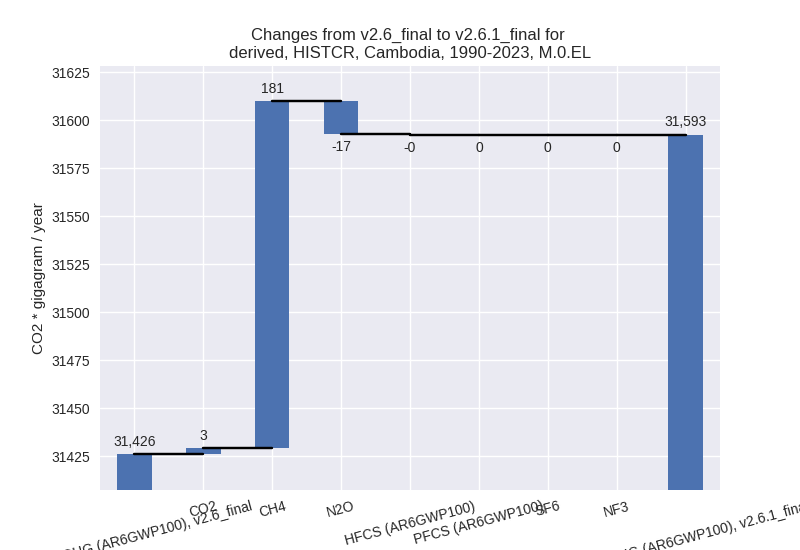
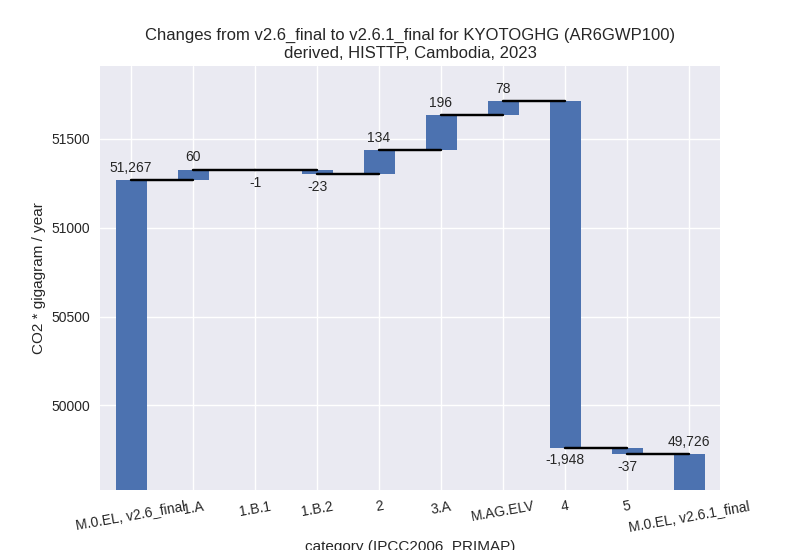
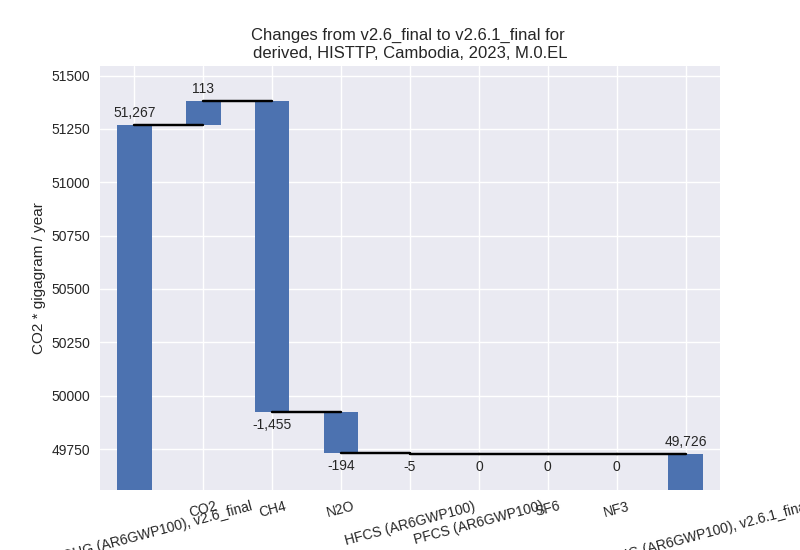
For each scenario and time frame the changes are displayed for all individual sectors and all individual gases. In the sector plot we use aggregate Kyoto GHGs in AR6GWP100. In the gas plot we usenational total emissions without LULUCF.
country reported scenario
2023
1990-2023
third party scenario
2023
1990-2023

Detailed changes for the scenarios:
country reported scenario (HISTCR):
Most important changes per time frame
For 2023 the following sector-gas combinations have the highest absolute impact on national total KyotoGHG (AR6GWP100) emissions in 2023 (top 5):
- 1: M.AG.ELV, CH4 with 303.91 Gg CO2 / year (2.0%)
- 2: M.AG.ELV, N2O with -225.64 Gg CO2 / year (-7.0%)
- 3: 4, CH4 with 177.74 Gg CO2 / year (6.9%)
- 4: 3.A, CH4 with 174.15 Gg CO2 / year (3.3%)
- 5: 2, CO2 with 70.22 Gg CO2 / year (2.4%)
For 1990-2023 the following sector-gas combinations have the highest absolute impact on national total KyotoGHG (AR6GWP100) emissions in 1990-2023 (top 5):
- 1: M.AG.ELV, CH4 with 127.18 Gg CO2 / year (1.1%)
- 2: 4, CH4 with 31.29 Gg CO2 / year (1.8%)
- 3: M.AG.ELV, N2O with -13.39 Gg CO2 / year (-0.5%)
- 4: 3.A, CH4 with 13.33 Gg CO2 / year (0.2%)
- 5: 1.B.1, CH4 with 5.67 Gg CO2 / year (0.6%)
Changes in the main sectors for aggregate KyotoGHG (AR6GWP100) are
- 1: Total sectoral emissions in 2022 are 14530.57 Gg CO2 / year which is 31.0% of M.0.EL emissions. 2023 Emissions have changed by -0.4% (-65.79 Gg CO2 / year). 1990-2023 Emissions have changed by 0.1% (3.93 Gg CO2 / year).
- 2: Total sectoral emissions in 2022 are 3879.46 Gg CO2 / year which is 8.3% of M.0.EL emissions. 2023 Emissions have changed by 1.6% (63.45 Gg CO2 / year). 1990-2023 Emissions have changed by 0.4% (3.73 Gg CO2 / year).
- M.AG: Total sectoral emissions in 2022 are 24111.48 Gg CO2 / year which is 51.5% of M.0.EL emissions. 2023 Emissions have changed by 1.1% (274.09 Gg CO2 / year). 1990-2023 Emissions have changed by 0.6% (128.78 Gg CO2 / year).
- 4: Total sectoral emissions in 2022 are 3891.78 Gg
CO2 / year which is 8.3% of M.0.EL emissions. 2023 Emissions have
changed by 4.6% (177.44 Gg CO2 /
year). 1990-2023 Emissions have changed by 1.2% (31.17 Gg CO2 / year). For 2023 the
changes per gas
are:
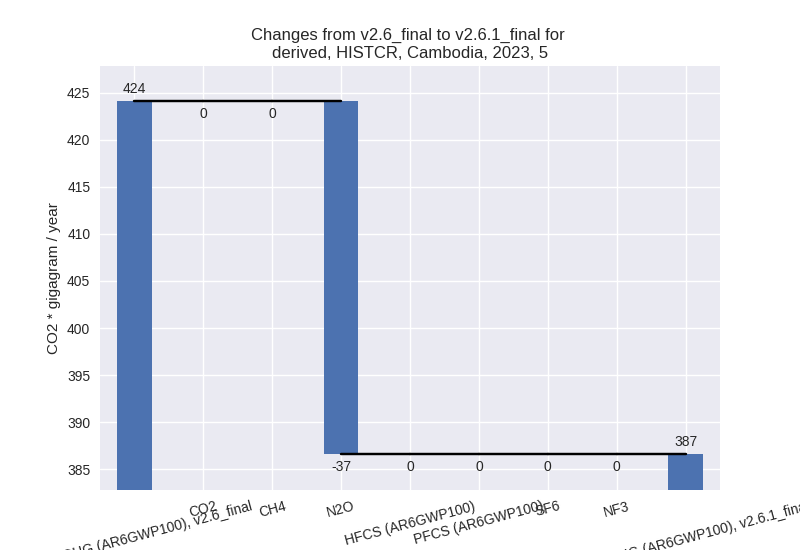
- 5: Total sectoral emissions in 2022 are 436.63 Gg
CO2 / year which is 0.9% of M.0.EL emissions. 2023 Emissions have
changed by -8.8% (-37.47 Gg CO2 /
year). 1990-2023 Emissions have changed by -0.2% (-1.03 Gg CO2 / year). For 2023 the
changes per gas
are:
third party scenario (HISTTP):
Most important changes per time frame
For 2023 the following sector-gas combinations have the highest absolute impact on national total KyotoGHG (AR6GWP100) emissions in 2023 (top 5):
- 1: 4, CH4 with -1944.19 Gg CO2 / year (-60.0%)
- 2: M.AG.ELV, CH4 with 303.91 Gg CO2 / year (2.0%)
- 3: M.AG.ELV, N2O with -225.64 Gg CO2 / year (-7.0%)
- 4: 3.A, CH4 with 174.15 Gg CO2 / year (3.3%)
- 5: 2, CO2 with 139.20 Gg CO2 / year (2.3%)
For 1990-2023 the following sector-gas combinations have the highest absolute impact on national total KyotoGHG (AR6GWP100) emissions in 1990-2023 (top 5):
- 1: 4, CH4 with -1492.09 Gg CO2 / year (-64.7%)
- 2: M.AG.ELV, CH4 with 127.18 Gg CO2 / year (1.1%)
- 3: 1.A, CH4 with 45.83 Gg CO2 / year (7.0%)
- 4: 1.A, N2O with 39.93 Gg CO2 / year (23.1%)
- 5: M.AG.ELV, N2O with -13.39 Gg CO2 / year (-0.5%)
Changes in the main sectors for aggregate KyotoGHG (AR6GWP100) are
- 1: Total sectoral emissions in 2022 are 15785.84 Gg CO2 / year which is 32.6% of M.0.EL emissions. 2023 Emissions have changed by 0.2% (36.05 Gg CO2 / year). 1990-2023 Emissions have changed by 1.3% (92.13 Gg CO2 / year).
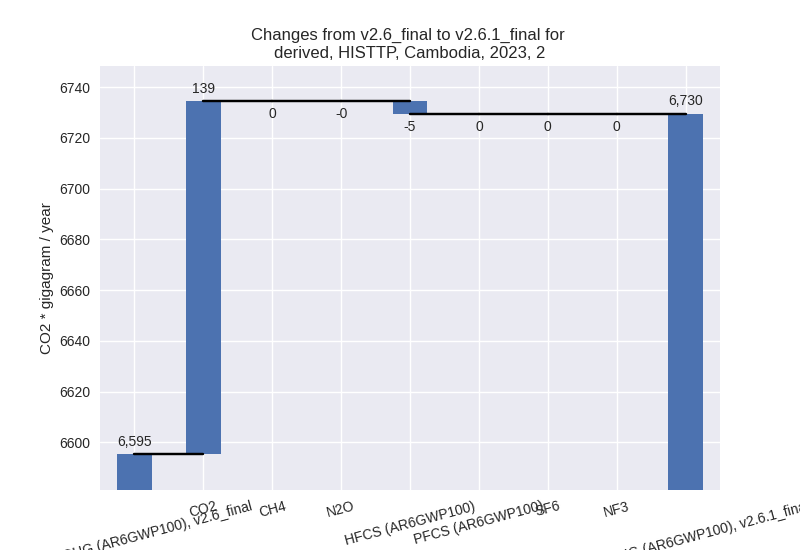
- 2: Total sectoral emissions in 2022 are 6682.80 Gg
CO2 / year which is 13.8% of M.0.EL emissions. 2023 Emissions have
changed by 2.0% (134.34 Gg CO2 /
year). 1990-2023 Emissions have changed by 0.6% (7.91 Gg CO2 / year). For 2023 the
changes per gas
are:
- M.AG: Total sectoral emissions in 2022 are 24111.48 Gg CO2 / year which is 49.7% of M.0.EL emissions. 2023 Emissions have changed by 1.1% (274.09 Gg CO2 / year). 1990-2023 Emissions have changed by 0.6% (128.78 Gg CO2 / year).
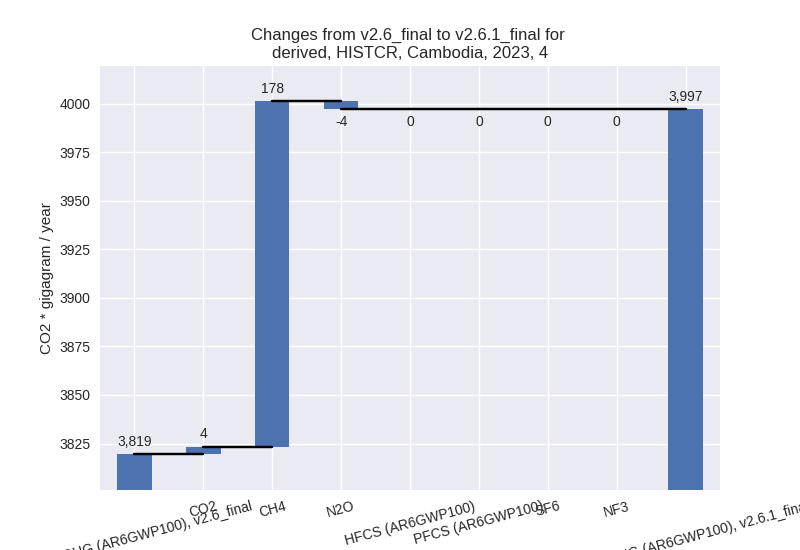
- 4: Total sectoral emissions in 2022 are 1477.11 Gg
CO2 / year which is 3.0% of M.0.EL emissions. 2023 Emissions have
changed by -56.2% (-1947.50 Gg CO2 /
year). 1990-2023 Emissions have changed by -60.8% (-1492.34 Gg CO2 / year). For 2023
the changes per gas
are:

For 1990-2023 the changes per gas are: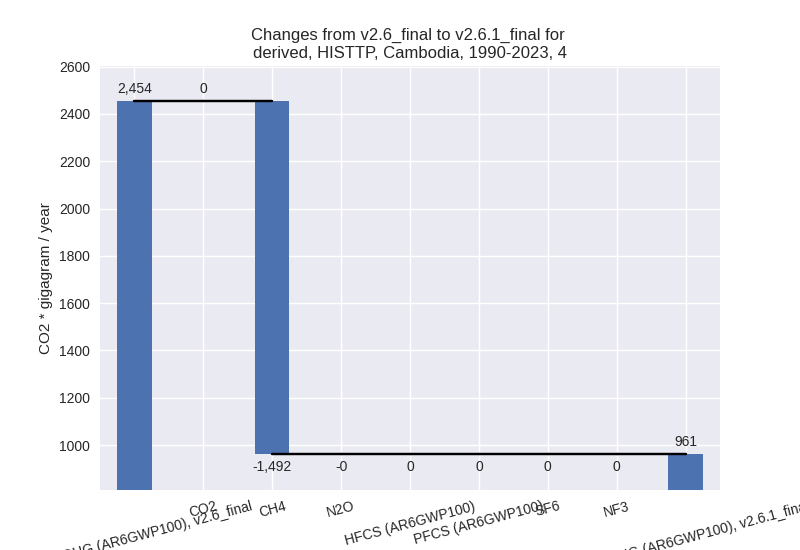
- 5: Total sectoral emissions in 2022 are 436.63 Gg
CO2 / year which is 0.9% of M.0.EL emissions. 2023 Emissions have
changed by -8.8% (-37.47 Gg CO2 /
year). 1990-2023 Emissions have changed by -0.2% (-1.03 Gg CO2 / year). For 2023 the
changes per gas
are:
