Changes in PRIMAP-hist v2.6.1_final compared to v2.6_final for Kuwait
2025-03-19
Johannes Gütschow
Change analysis for Kuwait for PRIMAP-hist v2.6.1_final compared to v2.6_final
Overview over emissions by sector and gas
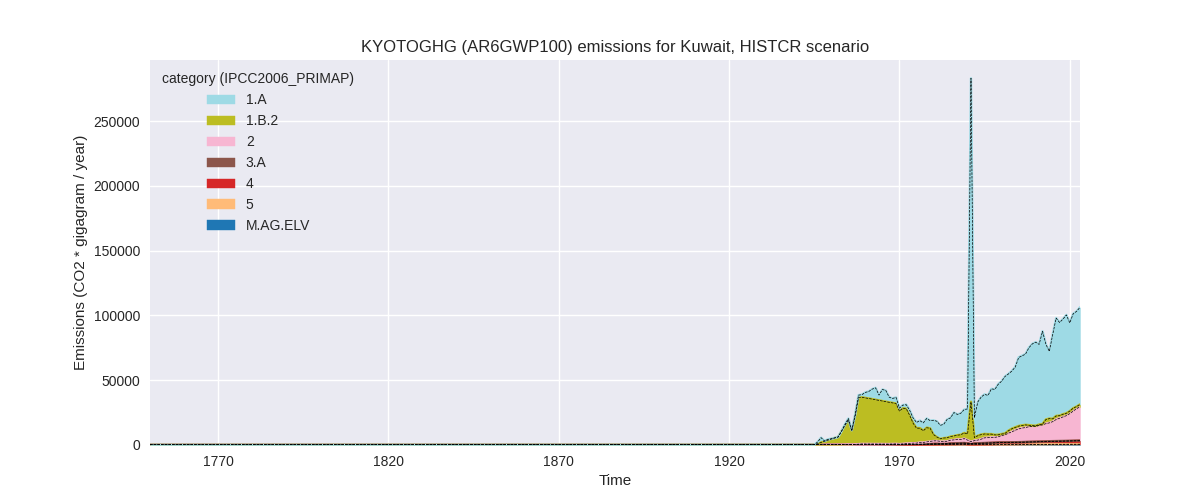
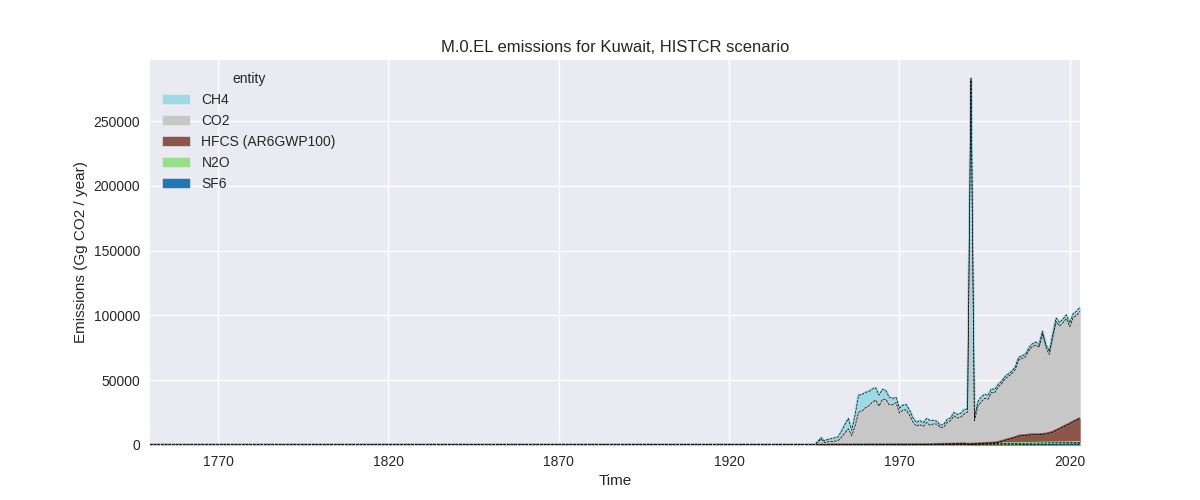
The following figures show the aggregate national total emissions excluding LULUCF AR6GWP100 for the country reported priority scenario. The dotted linesshow the v2.6_final data.
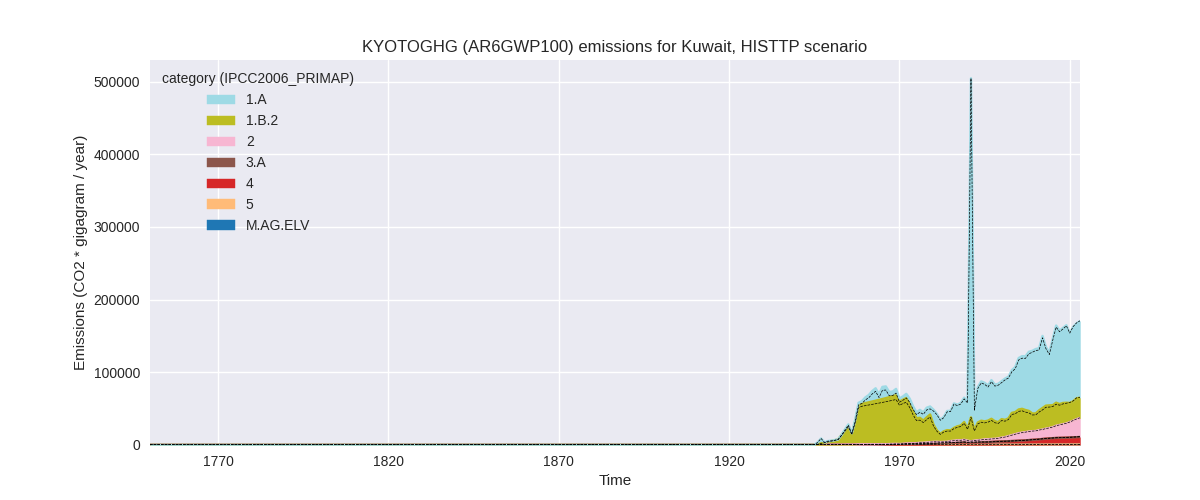
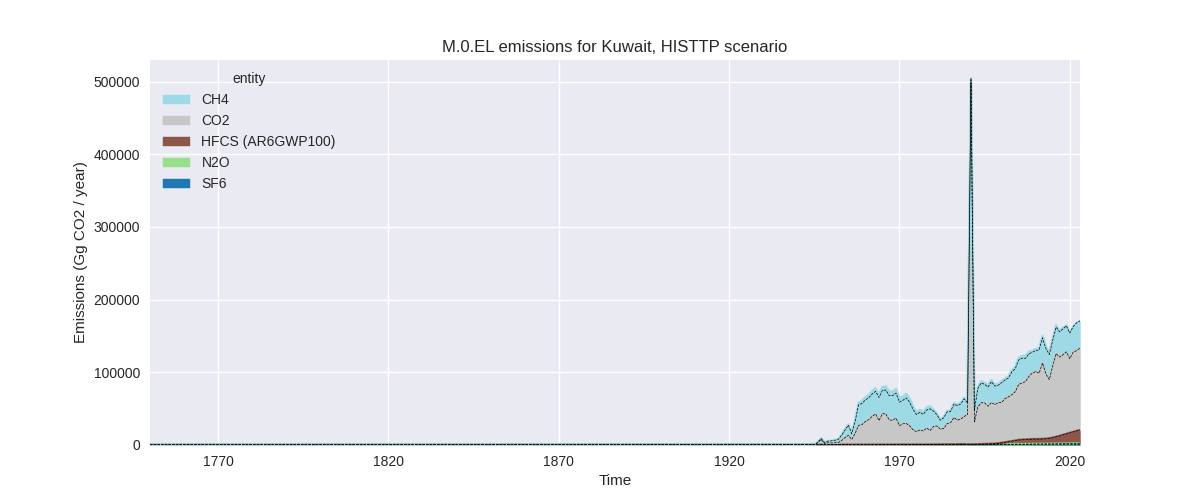
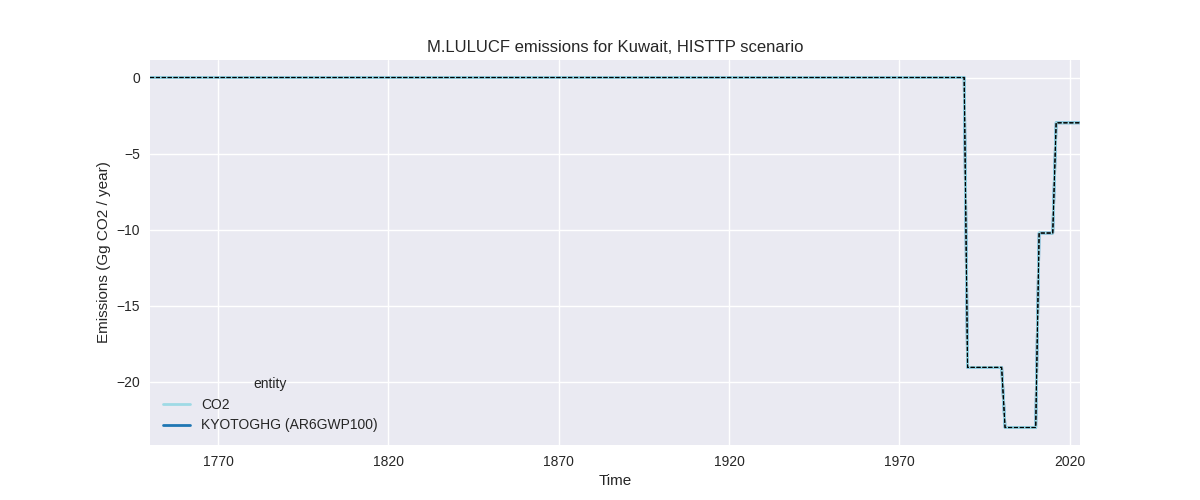
The following figures show the aggregate national total emissions excluding LULUCF AR6GWP100 for the third party priority scenario. The dotted linesshow the v2.6_final data.
Overview over changes
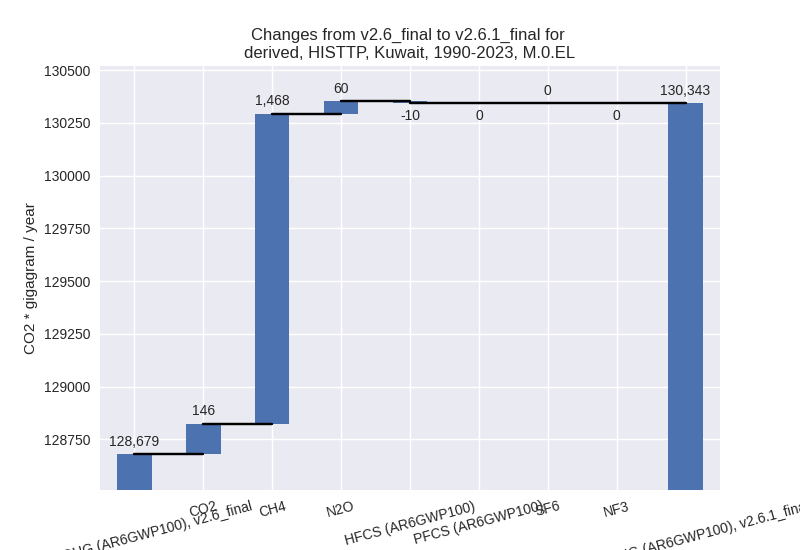
In the country reported priority scenario we have the following changes for aggregate Kyoto GHG and national total emissions excluding LULUCF (M.0.EL):
- Emissions in 2023 have changed by 0.0%% (36.88 Gg CO2 / year)
- Emissions in 1990-2023 have changed by 0.1%% (38.81 Gg CO2 / year)
In the third party priority scenario we have the following changes for aggregate Kyoto GHG and national total emissions excluding LULUCF (M.0.EL):
- Emissions in 2023 have changed by -0.2%% (-416.63 Gg CO2 / year)
- Emissions in 1990-2023 have changed by 1.3%% (1663.70 Gg CO2 / year)
Most important changes per scenario and time frame
In the country reported priority scenario the following sector-gas combinations have the highest absolute impact on national total KyotoGHG (AR6GWP100) emissions in 2023 (top 5):
- 1: 2, CO2 with 188.71 Gg CO2 / year (3.0%)
- 2: 2, HFCS (AR6GWP100) with -135.88 Gg CO2 / year (-0.7%)
- 3: 5, N2O with 40.24 Gg CO2 / year (13.3%)
- 4: 4, CH4 with -26.95 Gg CO2 / year (-1.1%)
- 5: M.AG.ELV, N2O with -13.73 Gg CO2 / year (-4.1%)
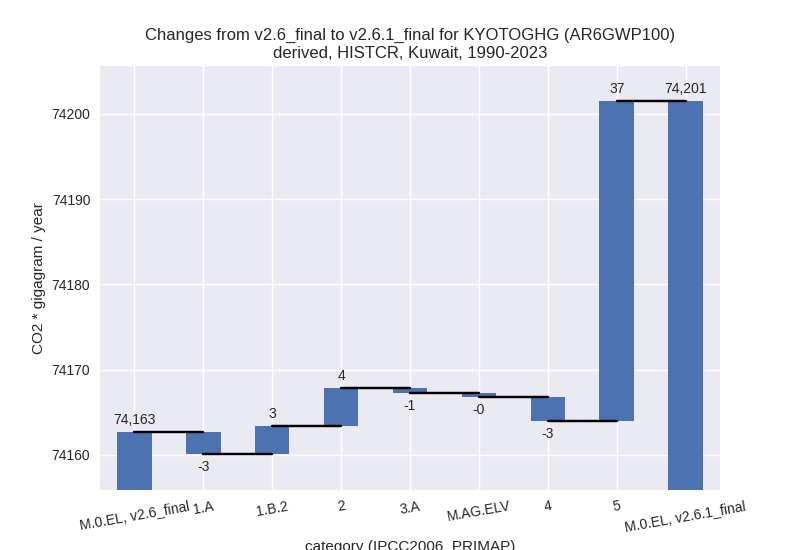
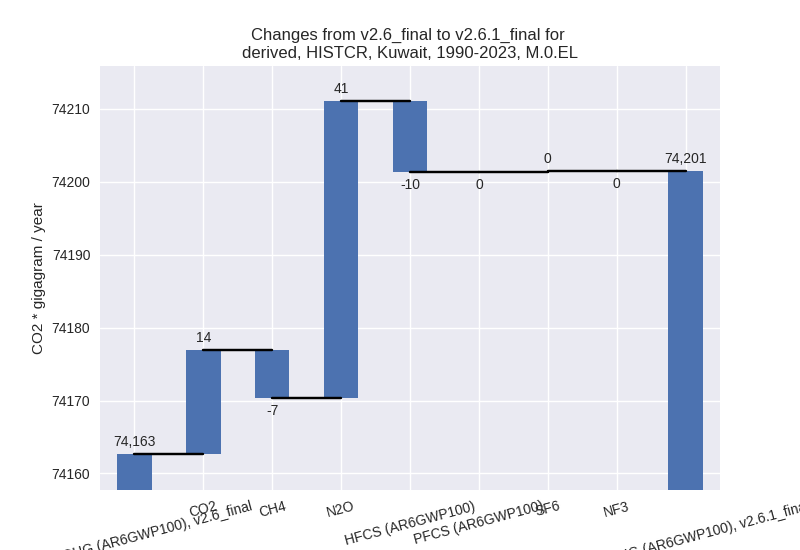
In the country reported priority scenario the following sector-gas combinations have the highest absolute impact on national total KyotoGHG (AR6GWP100) emissions in 1990-2023 (top 5):
- 1: 5, N2O with 37.43 Gg CO2 / year (15.8%)
- 2: 2, CO2 with 14.07 Gg CO2 / year (0.3%)
- 3: 2, HFCS (AR6GWP100) with -9.68 Gg CO2 / year (-0.2%)
- 4: 1.B.2, N2O with 4.05 Gg CO2 / year (24.8%)
- 5: 4, CH4 with -3.34 Gg CO2 / year (-0.2%)
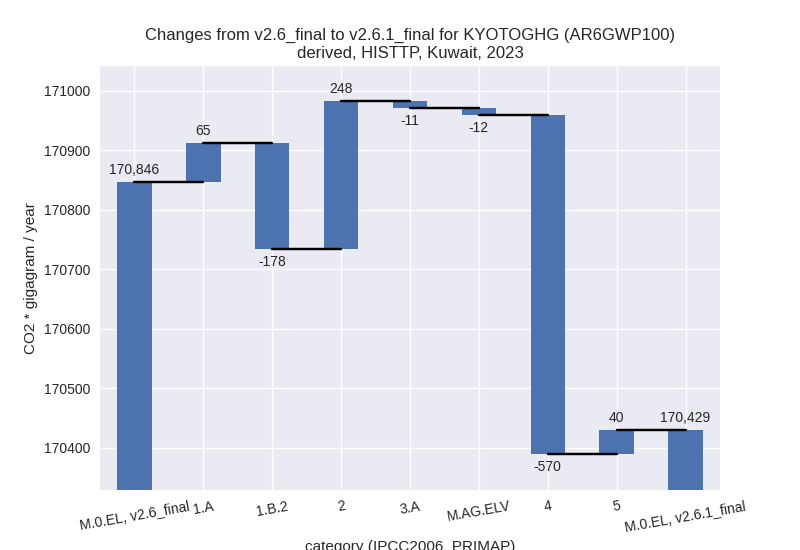
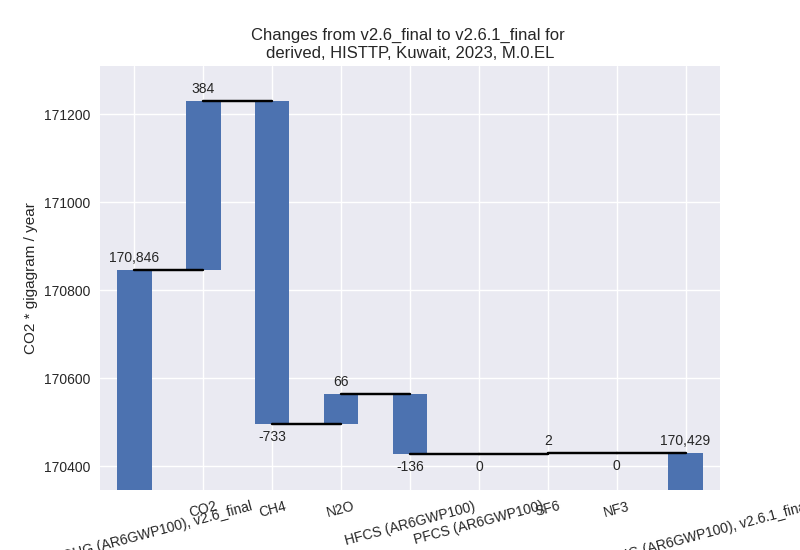
In the third party priority scenario the following sector-gas combinations have the highest absolute impact on national total KyotoGHG (AR6GWP100) emissions in 2023 (top 5):
- 1: 4, CH4 with -577.39 Gg CO2 / year (-5.5%)
- 2: 2, CO2 with 382.03 Gg CO2 / year (6.1%)
- 3: 1.B.2, CH4 with -183.27 Gg CO2 / year (-0.7%)
- 4: 2, HFCS (AR6GWP100) with -135.88 Gg CO2 / year (-0.7%)
- 5: 5, N2O with 40.24 Gg CO2 / year (13.3%)
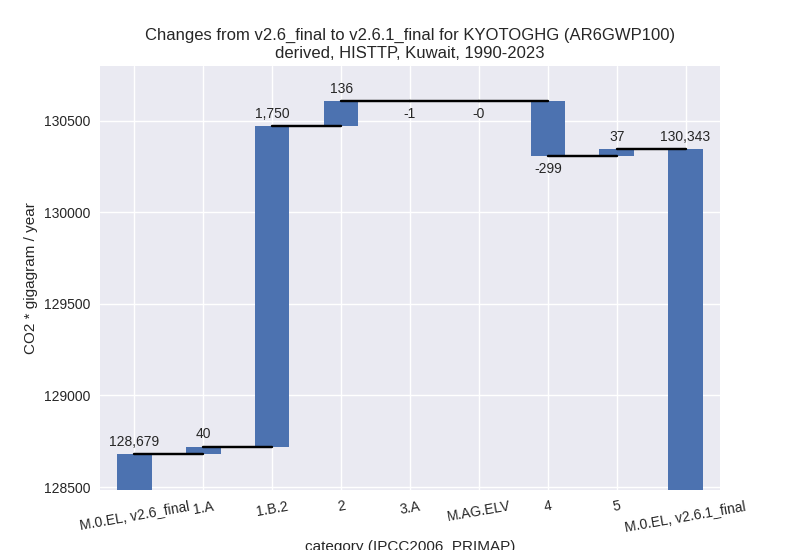
In the third party priority scenario the following sector-gas combinations have the highest absolute impact on national total KyotoGHG (AR6GWP100) emissions in 1990-2023 (top 5):
- 1: 1.B.2, CH4 with 1745.97 Gg CO2 / year (7.6%)
- 2: 4, CH4 with -299.27 Gg CO2 / year (-4.6%)
- 3: 2, CO2 with 145.37 Gg CO2 / year (3.6%)
- 4: 5, N2O with 37.43 Gg CO2 / year (15.8%)
- 5: 1.A, CH4 with 22.08 Gg CO2 / year (25.0%)
Notes on data changes
Here we list notes explaining important emissions changes for the country.
- No new country reported data has been included. Changes in the CR time-series are small and come from updated third party data (EDGAR, FAO) which is used to extrapolate the country reported data.
- Changes in the TP time-series come from updated EDGAR and FAO data. FAO has adjusted data for the latest years while EDGAR has updated full time-series with the main change coming from the waste sector and fugitive emissions (from new EDGAR data).
Changes by sector and gas
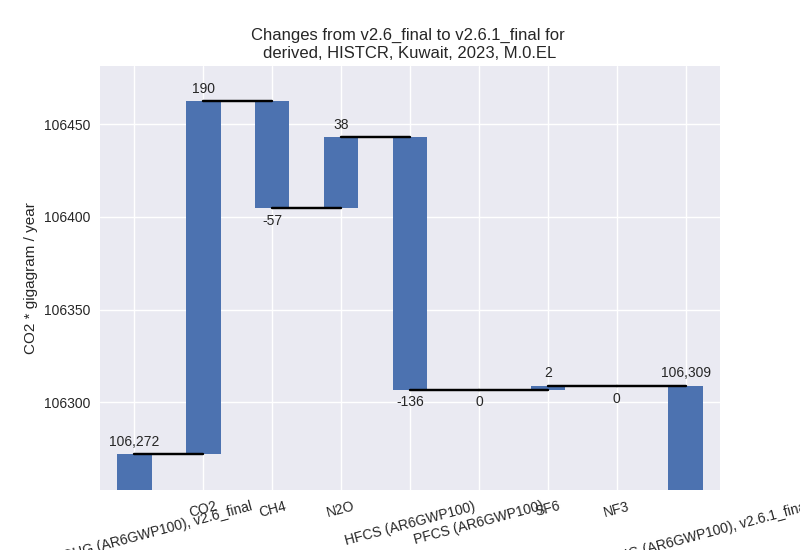
For each scenario and time frame the changes are displayed for all individual sectors and all individual gases. In the sector plot we use aggregate Kyoto GHGs in AR6GWP100. In the gas plot we usenational total emissions without LULUCF.
country reported scenario
2023
1990-2023
third party scenario
2023
1990-2023
Detailed changes for the scenarios:
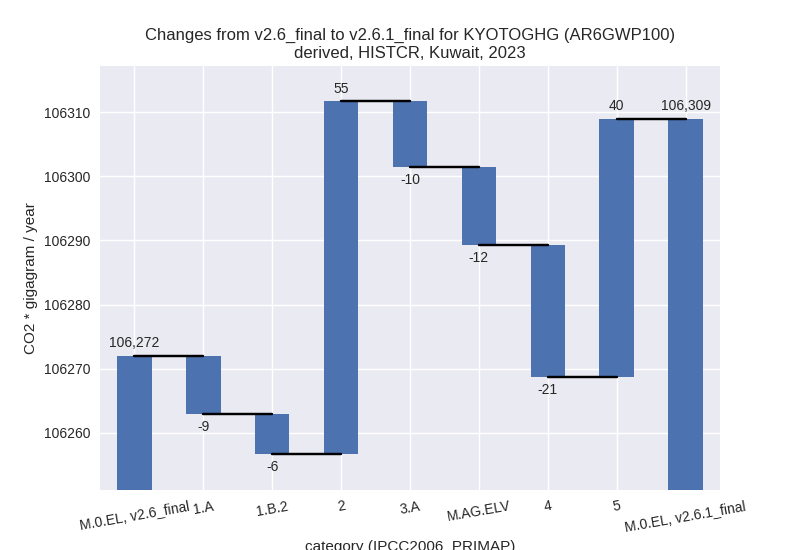
country reported scenario (HISTCR):
Most important changes per time frame
For 2023 the following sector-gas combinations have the highest absolute impact on national total KyotoGHG (AR6GWP100) emissions in 2023 (top 5):
- 1: 2, CO2 with 188.71 Gg CO2 / year (3.0%)
- 2: 2, HFCS (AR6GWP100) with -135.88 Gg CO2 / year (-0.7%)
- 3: 5, N2O with 40.24 Gg CO2 / year (13.3%)
- 4: 4, CH4 with -26.95 Gg CO2 / year (-1.1%)
- 5: M.AG.ELV, N2O with -13.73 Gg CO2 / year (-4.1%)
For 1990-2023 the following sector-gas combinations have the highest absolute impact on national total KyotoGHG (AR6GWP100) emissions in 1990-2023 (top 5):
- 1: 5, N2O with 37.43 Gg CO2 / year (15.8%)
- 2: 2, CO2 with 14.07 Gg CO2 / year (0.3%)
- 3: 2, HFCS (AR6GWP100) with -9.68 Gg CO2 / year (-0.2%)
- 4: 1.B.2, N2O with 4.05 Gg CO2 / year (24.8%)
- 5: 4, CH4 with -3.34 Gg CO2 / year (-0.2%)
Changes in the main sectors for aggregate KyotoGHG (AR6GWP100) are
- 1: Total sectoral emissions in 2022 are 75098.61 Gg CO2 / year which is 72.8% of M.0.EL emissions. 2023 Emissions have changed by -0.0% (-15.37 Gg CO2 / year). 1990-2023 Emissions have changed by 0.0% (0.72 Gg CO2 / year).
- 2: Total sectoral emissions in 2022 are 24620.42 Gg CO2 / year which is 23.9% of M.0.EL emissions. 2023 Emissions have changed by 0.2% (54.98 Gg CO2 / year). 1990-2023 Emissions have changed by 0.0% (4.47 Gg CO2 / year).
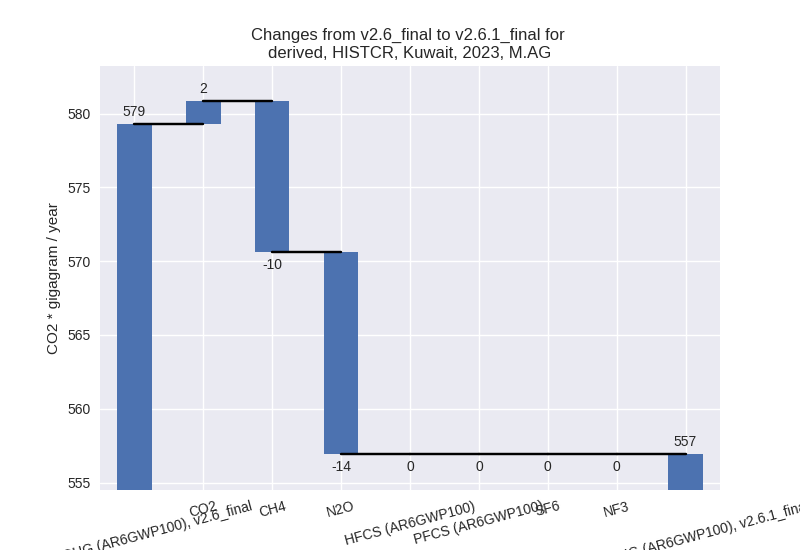
- M.AG: Total sectoral emissions in 2022 are 547.32
Gg CO2 / year which is 0.5% of M.0.EL emissions. 2023 Emissions have
changed by -3.9% (-22.36 Gg CO2 /
year). 1990-2023 Emissions have changed by -0.3% (-1.05 Gg CO2 / year). For 2023 the
changes per gas
are:
The changes come from the following subsectors:- 3.A: Total sectoral emissions in 2022 are 225.65 Gg
CO2 / year which is 41.2% of category M.AG emissions. 2023 Emissions
have changed by -4.2% (-10.18 Gg CO2
/ year). 1990-2023 Emissions have changed by -0.4% (-0.56 Gg CO2 / year). For 2023 the
changes per gas
are:

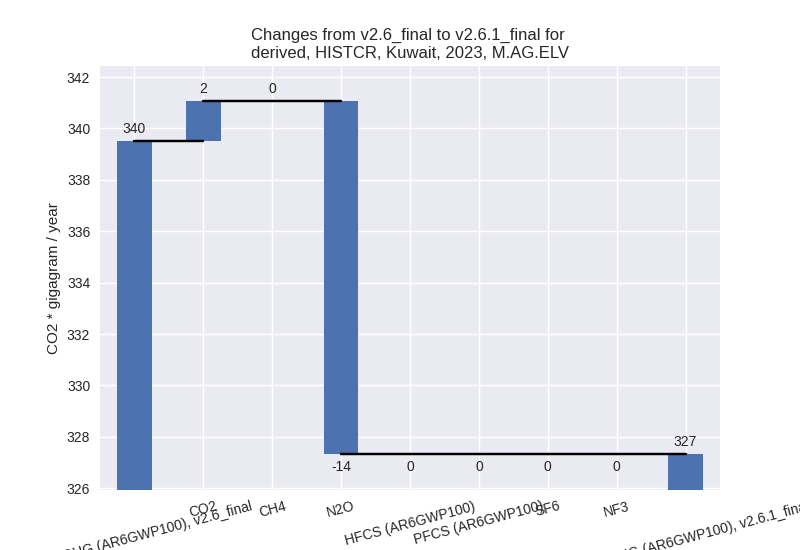
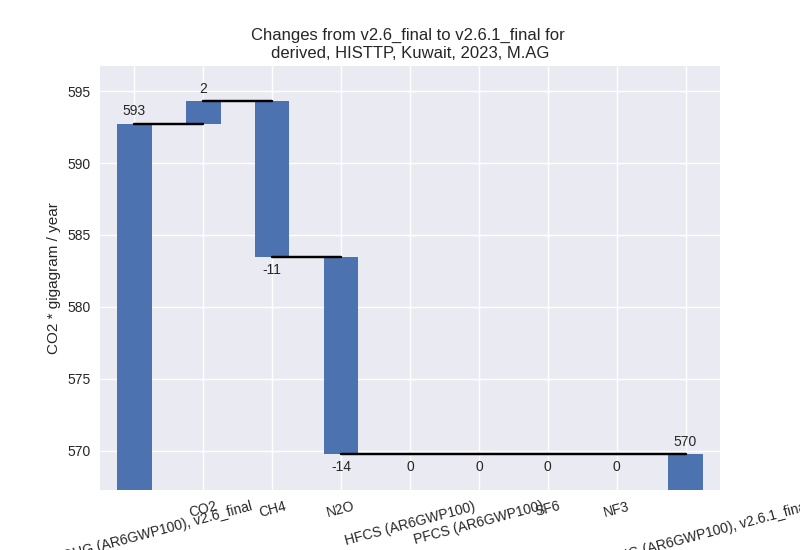
There is no subsector information available in PRIMAP-hist. - M.AG.ELV: Total sectoral emissions in 2022 are
321.66 Gg CO2 / year which is 58.8% of category M.AG emissions. 2023
Emissions have changed by -3.6%
(-12.17 Gg CO2 / year). 1990-2023 Emissions have changed by -0.2% (-0.48 Gg CO2 / year). For 2023 the
changes per gas
are:
There is no subsector information available in PRIMAP-hist.
- 3.A: Total sectoral emissions in 2022 are 225.65 Gg
CO2 / year which is 41.2% of category M.AG emissions. 2023 Emissions
have changed by -4.2% (-10.18 Gg CO2
/ year). 1990-2023 Emissions have changed by -0.4% (-0.56 Gg CO2 / year). For 2023 the
changes per gas
are:
- 4: Total sectoral emissions in 2022 are 2485.50 Gg CO2 / year which is 2.4% of M.0.EL emissions. 2023 Emissions have changed by -0.8% (-20.62 Gg CO2 / year). 1990-2023 Emissions have changed by -0.2% (-2.77 Gg CO2 / year).
- 5: Total sectoral emissions in 2022 are 342.36 Gg
CO2 / year which is 0.3% of M.0.EL emissions. 2023 Emissions have
changed by 13.3% (40.24 Gg CO2 /
year). 1990-2023 Emissions have changed by 15.8% (37.43 Gg CO2 / year). For 2023 the
changes per gas
are:

For 1990-2023 the changes per gas are: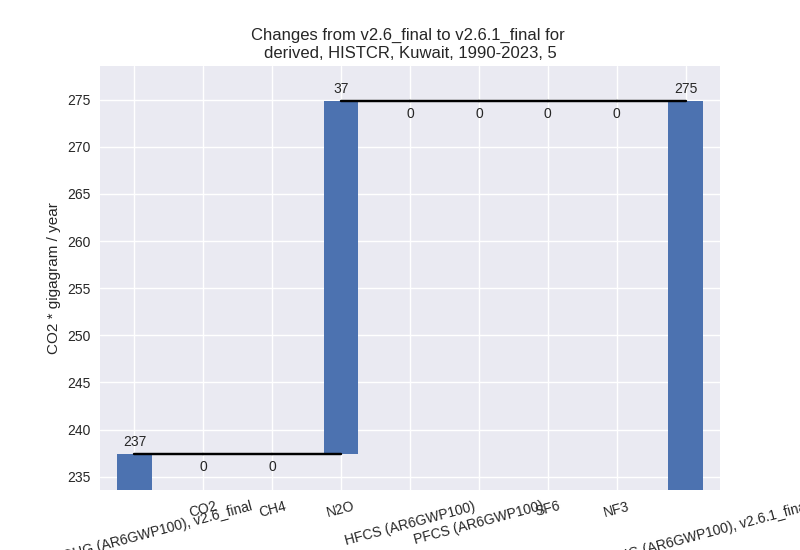
third party scenario (HISTTP):
Most important changes per time frame
For 2023 the following sector-gas combinations have the highest absolute impact on national total KyotoGHG (AR6GWP100) emissions in 2023 (top 5):
- 1: 4, CH4 with -577.39 Gg CO2 / year (-5.5%)
- 2: 2, CO2 with 382.03 Gg CO2 / year (6.1%)
- 3: 1.B.2, CH4 with -183.27 Gg CO2 / year (-0.7%)
- 4: 2, HFCS (AR6GWP100) with -135.88 Gg CO2 / year (-0.7%)
- 5: 5, N2O with 40.24 Gg CO2 / year (13.3%)
For 1990-2023 the following sector-gas combinations have the highest absolute impact on national total KyotoGHG (AR6GWP100) emissions in 1990-2023 (top 5):
- 1: 1.B.2, CH4 with 1745.97 Gg CO2 / year (7.6%)
- 2: 4, CH4 with -299.27 Gg CO2 / year (-4.6%)
- 3: 2, CO2 with 145.37 Gg CO2 / year (3.6%)
- 4: 5, N2O with 37.43 Gg CO2 / year (15.8%)
- 5: 1.A, CH4 with 22.08 Gg CO2 / year (25.0%)
Changes in the main sectors for aggregate KyotoGHG (AR6GWP100) are
- 1: Total sectoral emissions in 2022 are 131977.97 Gg CO2 / year which is 78.8% of M.0.EL emissions. 2023 Emissions have changed by -0.1% (-112.27 Gg CO2 / year). 1990-2023 Emissions have changed by 1.6% (1790.16 Gg CO2 / year).
- 2: Total sectoral emissions in 2022 are 24669.51 Gg CO2 / year which is 14.7% of M.0.EL emissions. 2023 Emissions have changed by 1.0% (248.30 Gg CO2 / year). 1990-2023 Emissions have changed by 1.3% (135.77 Gg CO2 / year).
- M.AG: Total sectoral emissions in 2022 are 559.95
Gg CO2 / year which is 0.3% of M.0.EL emissions. 2023 Emissions have
changed by -3.9% (-22.97 Gg CO2 /
year). 1990-2023 Emissions have changed by -0.3% (-1.08 Gg CO2 / year). For 2023 the
changes per gas
are:
The changes come from the following subsectors:- 3.A: Total sectoral emissions in 2022 are 238.28 Gg
CO2 / year which is 42.6% of category M.AG emissions. 2023 Emissions
have changed by -4.3% (-10.79 Gg CO2
/ year). 1990-2023 Emissions have changed by -0.4% (-0.60 Gg CO2 / year). For 2023 the
changes per gas
are:

There is no subsector information available in PRIMAP-hist. - M.AG.ELV: Total sectoral emissions in 2022 are
321.66 Gg CO2 / year which is 57.4% of category M.AG emissions. 2023
Emissions have changed by -3.6%
(-12.17 Gg CO2 / year). 1990-2023 Emissions have changed by -0.2% (-0.48 Gg CO2 / year). For 2023 the
changes per gas
are:

There is no subsector information available in PRIMAP-hist.
- 3.A: Total sectoral emissions in 2022 are 238.28 Gg
CO2 / year which is 42.6% of category M.AG emissions. 2023 Emissions
have changed by -4.3% (-10.79 Gg CO2
/ year). 1990-2023 Emissions have changed by -0.4% (-0.60 Gg CO2 / year). For 2023 the
changes per gas
are:
- 4: Total sectoral emissions in 2022 are 9861.45 Gg
CO2 / year which is 5.9% of M.0.EL emissions. 2023 Emissions have
changed by -5.4% (-569.95 Gg CO2 /
year). 1990-2023 Emissions have changed by -4.6% (-298.59 Gg CO2 / year). For 2023
the changes per gas
are:
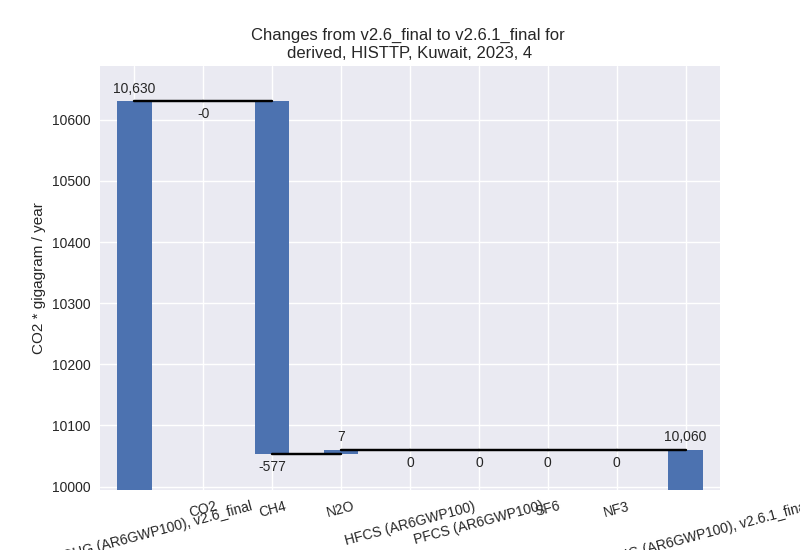
For 1990-2023 the changes per gas are:
- 5: Total sectoral emissions in 2022 are 342.36 Gg
CO2 / year which is 0.2% of M.0.EL emissions. 2023 Emissions have
changed by 13.3% (40.24 Gg CO2 /
year). 1990-2023 Emissions have changed by 15.8% (37.43 Gg CO2 / year). For 2023 the
changes per gas
are:
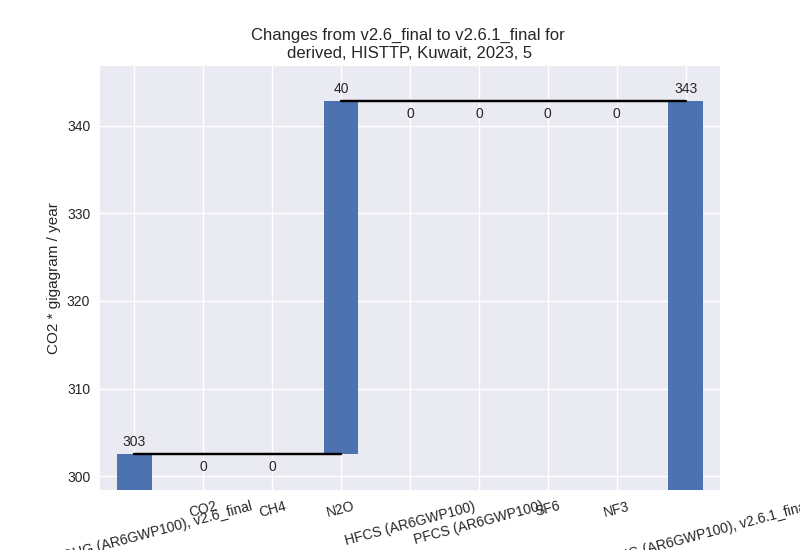
For 1990-2023 the changes per gas are: