Changes in PRIMAP-hist v2.6.1_final compared to v2.6_final for Liberia
2025-03-19
Johannes Gütschow
Change analysis for Liberia for PRIMAP-hist v2.6.1_final compared to v2.6_final
Overview over emissions by sector and gas
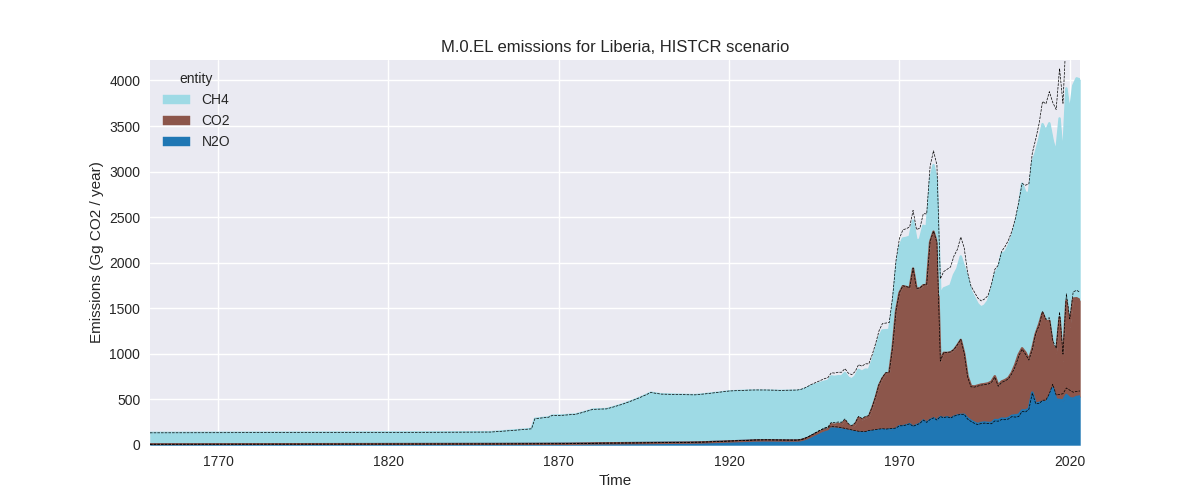
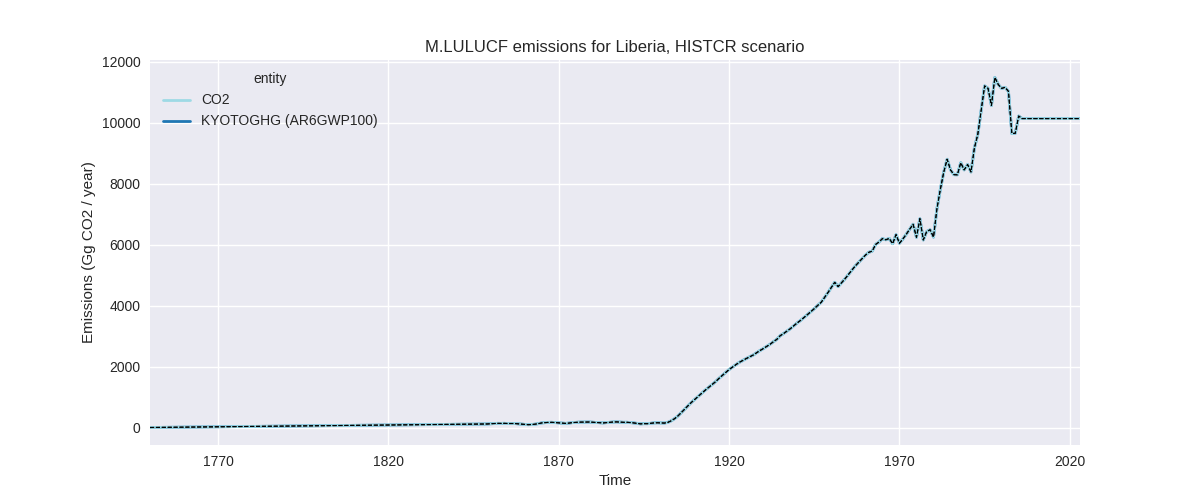
The following figures show the aggregate national total emissions excluding LULUCF AR6GWP100 for the country reported priority scenario. The dotted linesshow the v2.6_final data.

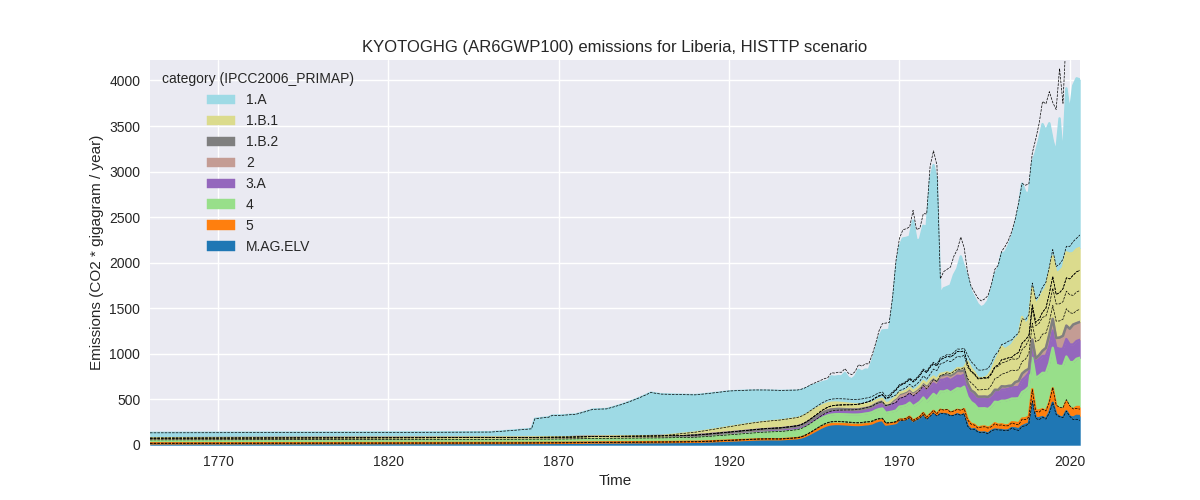
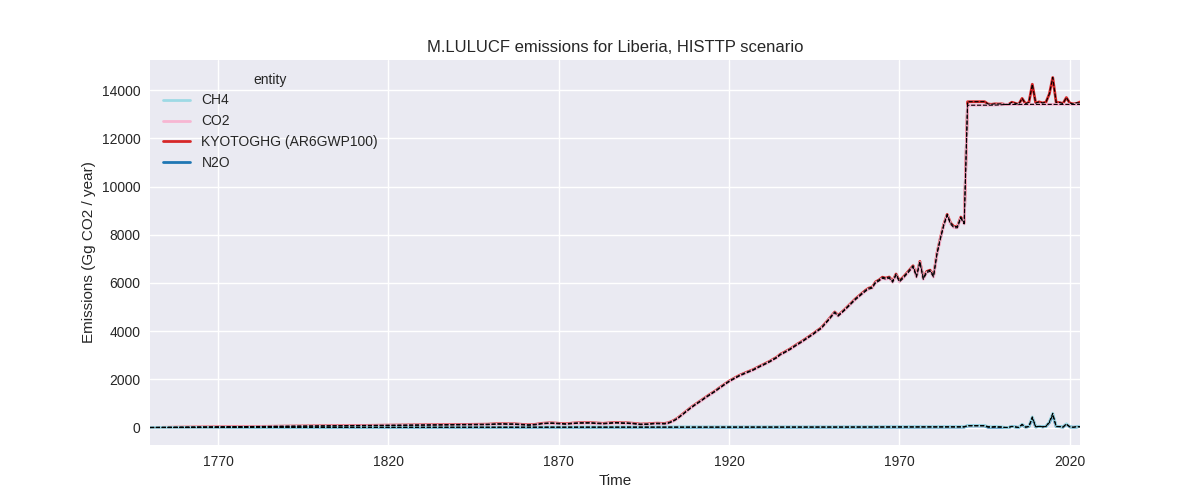
The following figures show the aggregate national total emissions excluding LULUCF AR6GWP100 for the third party priority scenario. The dotted linesshow the v2.6_final data.

Overview over changes
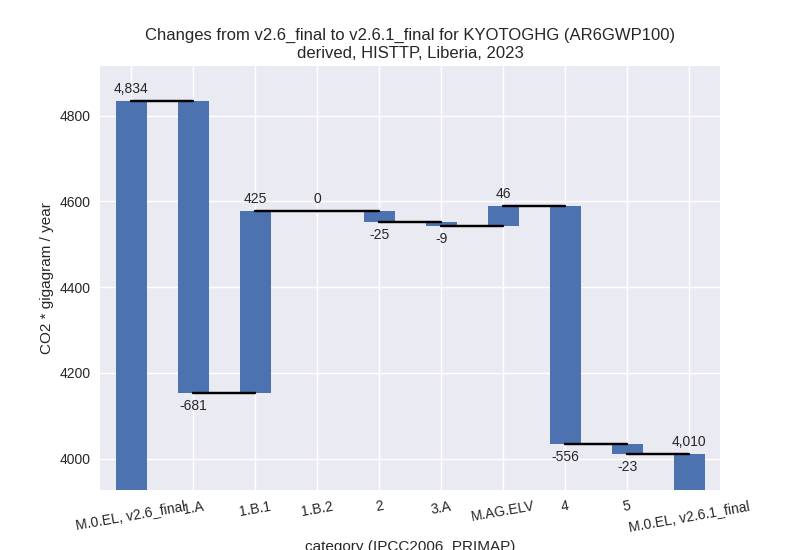
In the country reported priority scenario we have the following changes for aggregate Kyoto GHG and national total emissions excluding LULUCF (M.0.EL):
- Emissions in 2023 have changed by -17.0%% (-823.28 Gg CO2 / year)
- Emissions in 1990-2023 have changed by -8.1%% (-238.75 Gg CO2 / year)
In the third party priority scenario we have the following changes for aggregate Kyoto GHG and national total emissions excluding LULUCF (M.0.EL):
- Emissions in 2023 have changed by -17.0%% (-823.28 Gg CO2 / year)
- Emissions in 1990-2023 have changed by -8.1%% (-238.75 Gg CO2 / year)
Most important changes per scenario and time frame
In the country reported priority scenario the following sector-gas combinations have the highest absolute impact on national total KyotoGHG (AR6GWP100) emissions in 2023 (top 5):
- 1: 1.A, CH4 with -606.39 Gg CO2 / year (-41.4%)
- 2: 4, CH4 with -554.77 Gg CO2 / year (-52.4%)
- 3: 1.B.1, CH4 with 419.09 Gg CO2 / year (109.7%)
- 4: 1.A, N2O with -74.48 Gg CO2 / year (-36.8%)
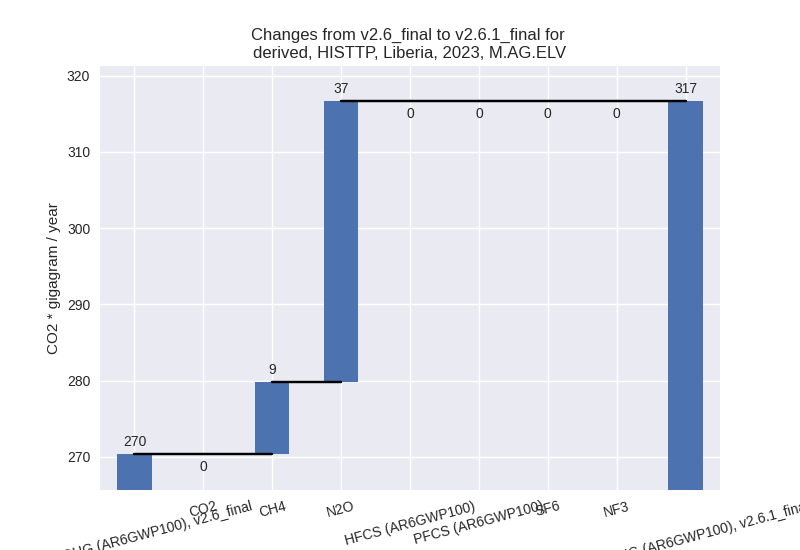
- 5: M.AG.ELV, N2O with 36.83 Gg CO2 / year (20.2%)
In the country reported priority scenario the following sector-gas combinations have the highest absolute impact on national total KyotoGHG (AR6GWP100) emissions in 1990-2023 (top 5):
- 1: 4, CH4 with -360.30 Gg CO2 / year (-53.3%)
- 2: 1.B.1, CH4 with 287.72 Gg CO2 / year (131.1%)
- 3: 1.A, CH4 with -151.42 Gg CO2 / year (-18.8%)
- 4: 1.A, N2O with -18.25 Gg CO2 / year (-16.5%)
- 5: 1.B.1, N2O with 3.81 Gg CO2 / year (131.1%)
In the third party priority scenario the following sector-gas combinations have the highest absolute impact on national total KyotoGHG (AR6GWP100) emissions in 2023 (top 5):
- 1: 1.A, CH4 with -606.39 Gg CO2 / year (-41.4%)
- 2: 4, CH4 with -554.77 Gg CO2 / year (-52.4%)
- 3: 1.B.1, CH4 with 419.09 Gg CO2 / year (109.7%)
- 4: 1.A, N2O with -74.48 Gg CO2 / year (-36.8%)
- 5: M.AG.ELV, N2O with 36.83 Gg CO2 / year (20.2%)
In the third party priority scenario the following sector-gas combinations have the highest absolute impact on national total KyotoGHG (AR6GWP100) emissions in 1990-2023 (top 5):
- 1: 4, CH4 with -360.30 Gg CO2 / year (-53.3%)
- 2: 1.B.1, CH4 with 287.72 Gg CO2 / year (131.1%)
- 3: 1.A, CH4 with -151.42 Gg CO2 / year (-18.8%)
- 4: 1.A, N2O with -18.25 Gg CO2 / year (-16.5%)
- 5: 1.B.1, N2O with 3.81 Gg CO2 / year (131.1%)
Notes on data changes
Here we list notes explaining important emissions changes for the country.
- There is no usable country reported data for Liberia, thus the CR and TP time-series are identical.
- The new EDGAR data revised non CO2 emissions from fossil fuel combustion (1.A) down for all years after 2009 leading to much lower 2023 and lower cumulative emissions.
- Waste CH4 is much lower for all years in the new EDGAR data.
- Fugitive emissions from solid fuels (1.B.1) have been revised up in the new EDGAR data.
- New FAO data shows revised emissions for M.AG.ELV for the latest years.
Changes by sector and gas
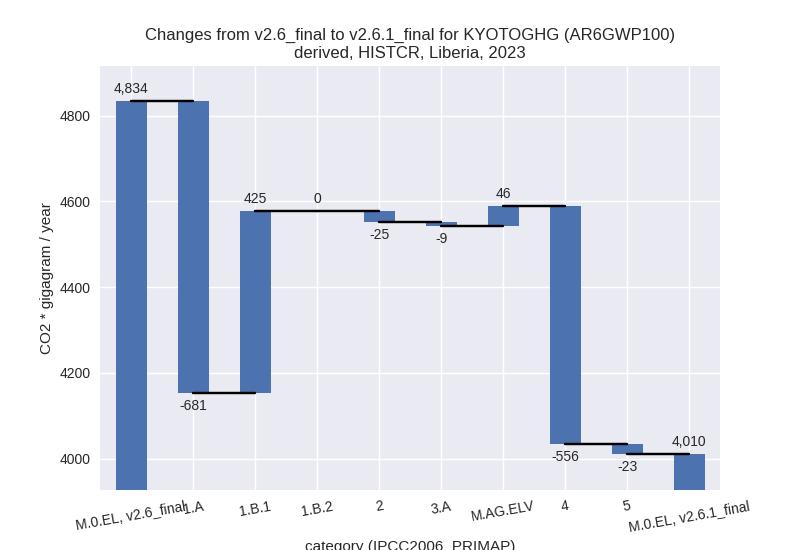
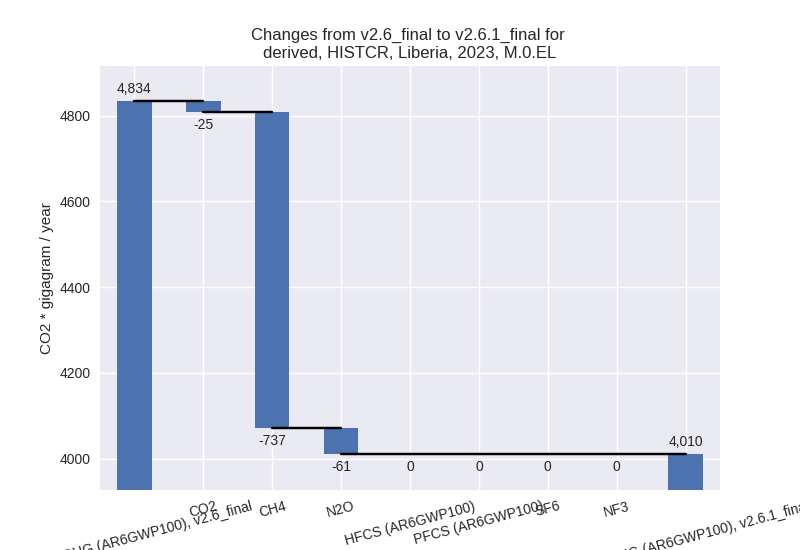
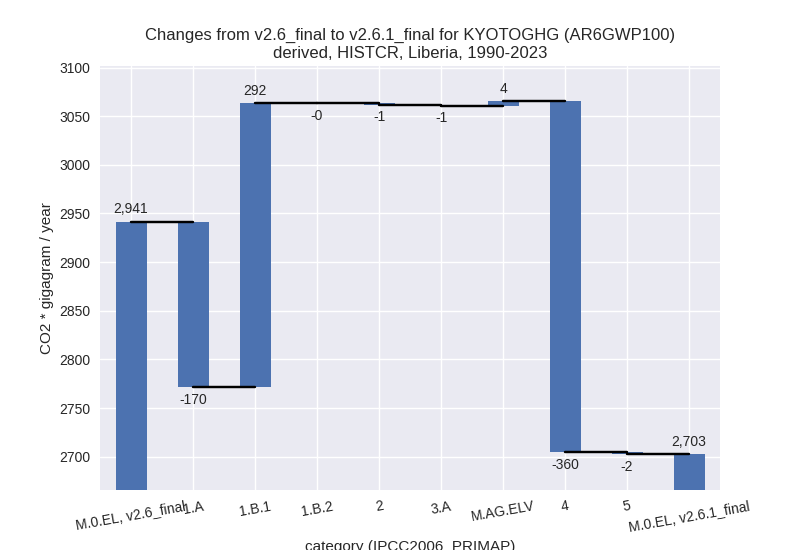
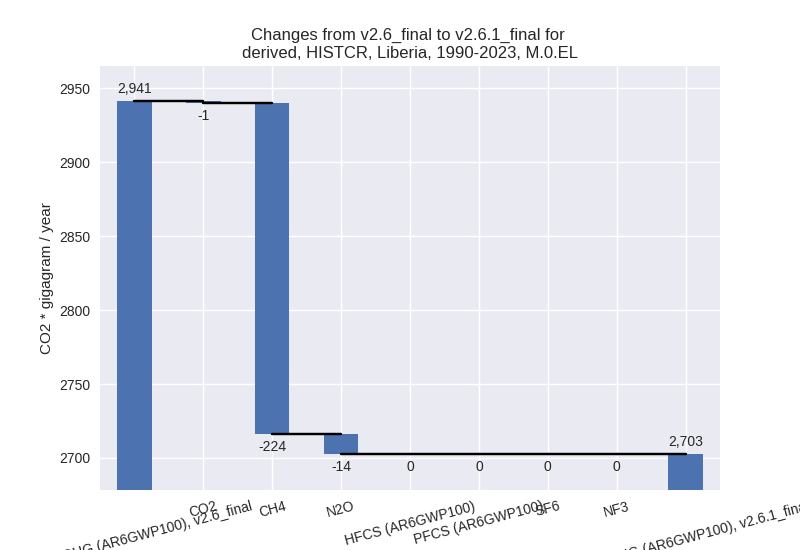
For each scenario and time frame the changes are displayed for all individual sectors and all individual gases. In the sector plot we use aggregate Kyoto GHGs in AR6GWP100. In the gas plot we usenational total emissions without LULUCF.
country reported scenario
2023
1990-2023
third party scenario
2023

1990-2023


Detailed changes for the scenarios:
country reported scenario (HISTCR):
Most important changes per time frame
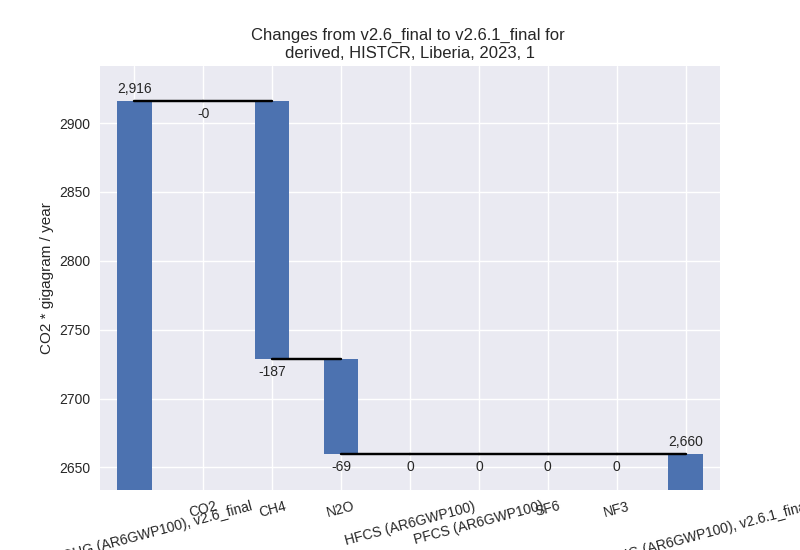
For 2023 the following sector-gas combinations have the highest absolute impact on national total KyotoGHG (AR6GWP100) emissions in 2023 (top 5):
- 1: 1.A, CH4 with -606.39 Gg CO2 / year (-41.4%)
- 2: 4, CH4 with -554.77 Gg CO2 / year (-52.4%)
- 3: 1.B.1, CH4 with 419.09 Gg CO2 / year (109.7%)
- 4: 1.A, N2O with -74.48 Gg CO2 / year (-36.8%)
- 5: M.AG.ELV, N2O with 36.83 Gg CO2 / year (20.2%)
For 1990-2023 the following sector-gas combinations have the highest absolute impact on national total KyotoGHG (AR6GWP100) emissions in 1990-2023 (top 5):
- 1: 4, CH4 with -360.30 Gg CO2 / year (-53.3%)
- 2: 1.B.1, CH4 with 287.72 Gg CO2 / year (131.1%)
- 3: 1.A, CH4 with -151.42 Gg CO2 / year (-18.8%)
- 4: 1.A, N2O with -18.25 Gg CO2 / year (-16.5%)
- 5: 1.B.1, N2O with 3.81 Gg CO2 / year (131.1%)
Changes in the main sectors for aggregate KyotoGHG (AR6GWP100) are
- 1: Total sectoral emissions in 2022 are 2686.66 Gg
CO2 / year which is 66.8% of M.0.EL emissions. 2023 Emissions have
changed by -8.8% (-256.22 Gg CO2 /
year). 1990-2023 Emissions have changed by 7.2% (121.87 Gg CO2 / year). For 2023 the
changes per gas
are:
For 1990-2023 the changes per gas are: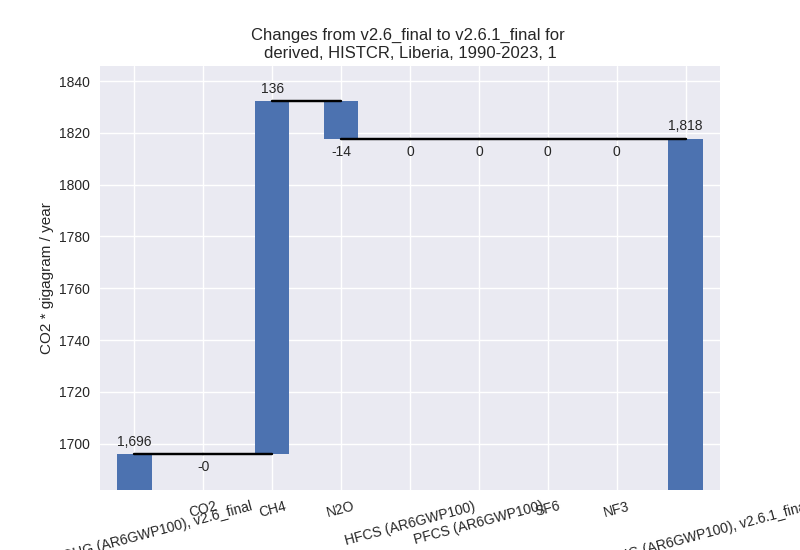
The changes come from the following subsectors:- 1.A: Total sectoral emissions in 2022 are 1874.82
Gg CO2 / year which is 69.8% of category 1 emissions. 2023 Emissions
have changed by -26.9% (-680.86 Gg
CO2 / year). 1990-2023 Emissions have changed by -11.5% (-169.66 Gg CO2 / year). For 2023
the changes per gas
are:

For 1990-2023 the changes per gas are: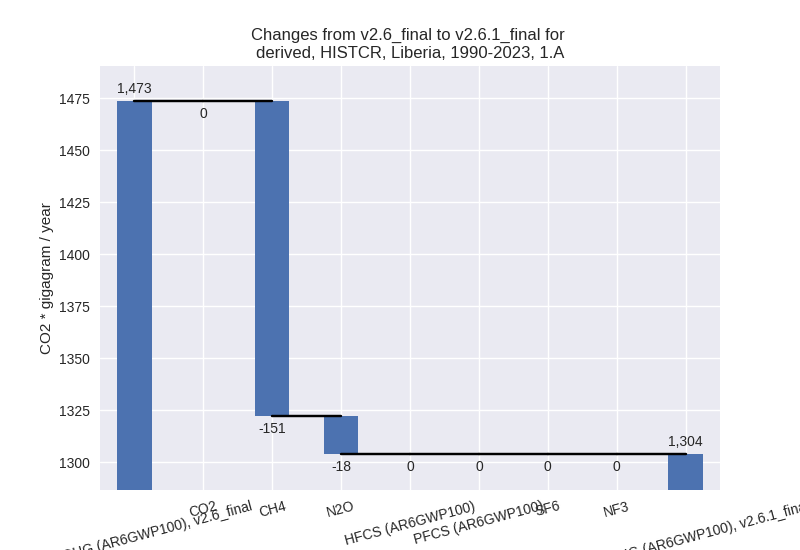
There is no subsector information available in PRIMAP-hist. - 1.B.1: Total sectoral emissions in 2022 are 811.84
Gg CO2 / year which is 30.2% of category 1 emissions. 2023 Emissions
have changed by 109.7% (424.65 Gg
CO2 / year). 1990-2023 Emissions have changed by 131.1% (291.53 Gg CO2 / year). For 2023
the changes per gas
are:

For 1990-2023 the changes per gas are:
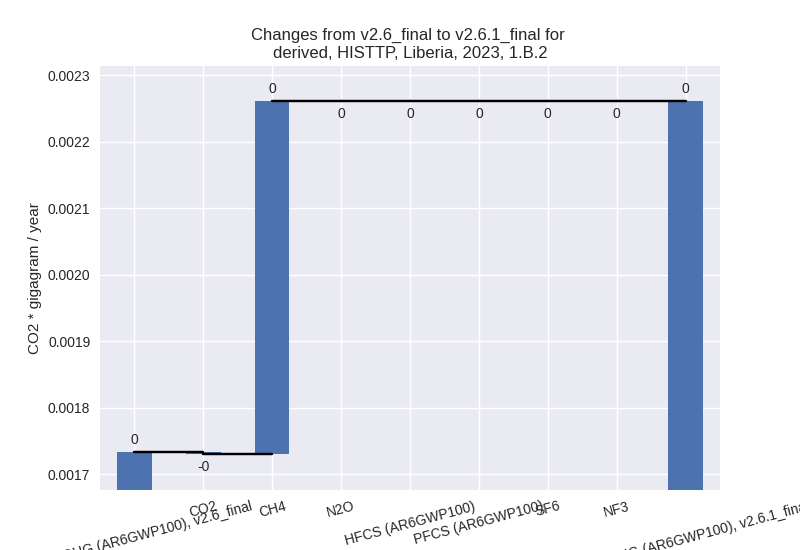
There is no subsector information available in PRIMAP-hist. - 1.B.2: Total sectoral emissions in 2022 are 0.00 Gg
CO2 / year which is 0.0% of category 1 emissions. 2023 Emissions have
changed by 30.4% (0.00 Gg CO2 /
year). 1990-2023 Emissions have changed by -1.6% (-0.00 Gg CO2 / year). For 2023 the
changes per gas
are:

There is no subsector information available in PRIMAP-hist.
- 1.A: Total sectoral emissions in 2022 are 1874.82
Gg CO2 / year which is 69.8% of category 1 emissions. 2023 Emissions
have changed by -26.9% (-680.86 Gg
CO2 / year). 1990-2023 Emissions have changed by -11.5% (-169.66 Gg CO2 / year). For 2023
the changes per gas
are:
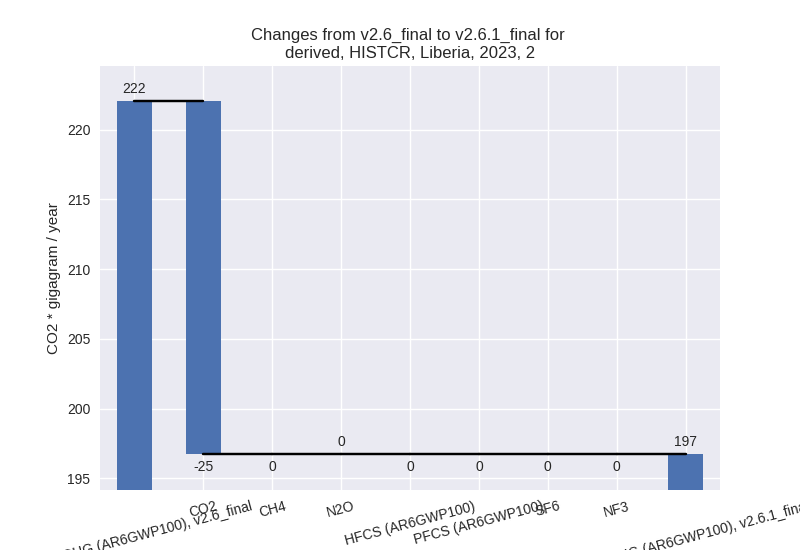
- 2: Total sectoral emissions in 2022 are 196.31 Gg
CO2 / year which is 4.9% of M.0.EL emissions. 2023 Emissions have
changed by -11.4% (-25.30 Gg CO2 /
year). 1990-2023 Emissions have changed by -1.8% (-1.24 Gg CO2 / year). For 2023 the
changes per gas
are:
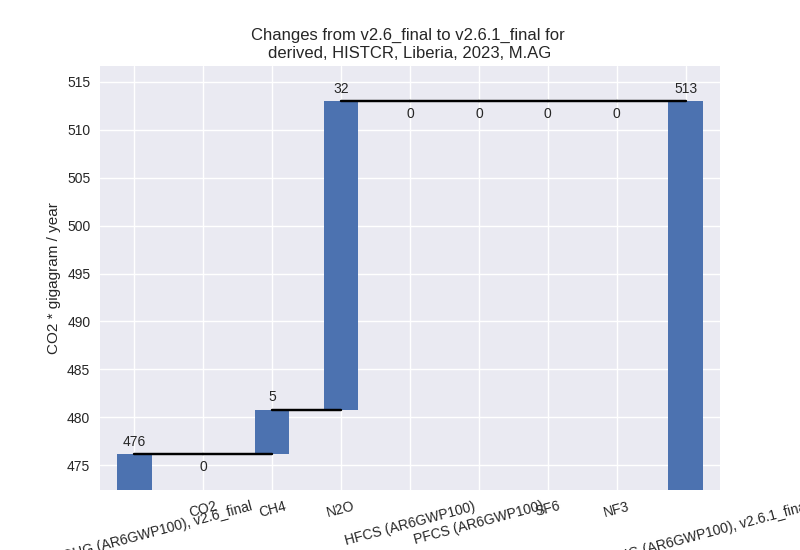
- M.AG: Total sectoral emissions in 2022 are 514.32
Gg CO2 / year which is 12.8% of M.0.EL emissions. 2023 Emissions have
changed by 7.7% (36.82 Gg CO2 /
year). 1990-2023 Emissions have changed by 0.9% (3.36 Gg CO2 / year). For 2023 the
changes per gas
are:
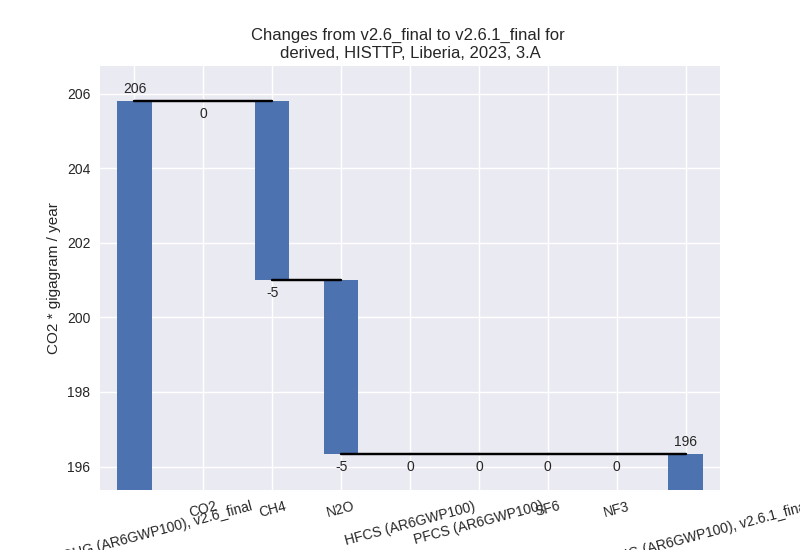
The changes come from the following subsectors:- 3.A: Total sectoral emissions in 2022 are 194.86 Gg
CO2 / year which is 37.9% of category M.AG emissions. 2023 Emissions
have changed by -4.6% (-9.46 Gg CO2
/ year). 1990-2023 Emissions have changed by -0.7% (-1.01 Gg CO2 / year). For 2023 the
changes per gas
are:

There is no subsector information available in PRIMAP-hist. - M.AG.ELV: Total sectoral emissions in 2022 are
319.46 Gg CO2 / year which is 62.1% of category M.AG emissions. 2023
Emissions have changed by 17.1%
(46.28 Gg CO2 / year). 1990-2023 Emissions have changed by 1.8% (4.37 Gg CO2 / year). For 2023 the
changes per gas
are:

There is no subsector information available in PRIMAP-hist.
- 3.A: Total sectoral emissions in 2022 are 194.86 Gg
CO2 / year which is 37.9% of category M.AG emissions. 2023 Emissions
have changed by -4.6% (-9.46 Gg CO2
/ year). 1990-2023 Emissions have changed by -0.7% (-1.01 Gg CO2 / year). For 2023 the
changes per gas
are:
- 4: Total sectoral emissions in 2022 are 528.81 Gg
CO2 / year which is 13.1% of M.0.EL emissions. 2023 Emissions have
changed by -50.7% (-555.81 Gg CO2 /
year). 1990-2023 Emissions have changed by -51.5% (-360.42 Gg CO2 / year). For 2023
the changes per gas
are:

For 1990-2023 the changes per gas are: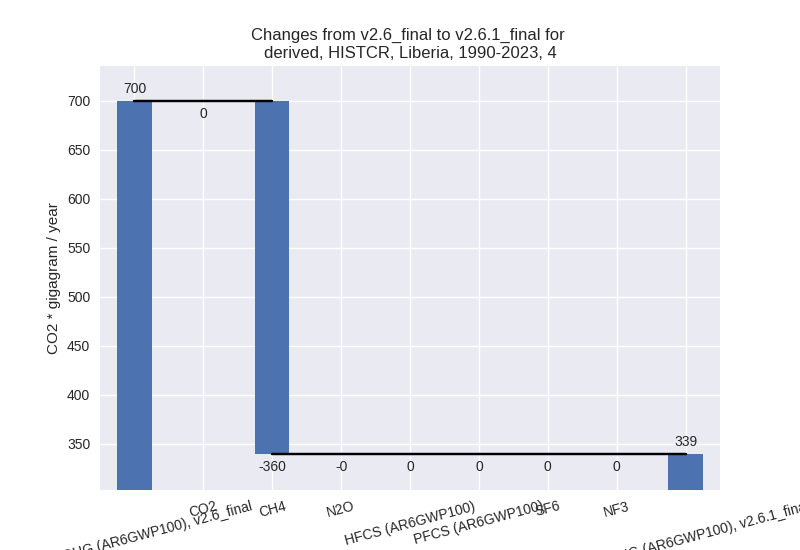
- 5: Total sectoral emissions in 2022 are 97.50 Gg
CO2 / year which is 2.4% of M.0.EL emissions. 2023 Emissions have
changed by -18.6% (-22.78 Gg CO2 /
year). 1990-2023 Emissions have changed by -2.8% (-2.32 Gg CO2 / year). For 2023 the
changes per gas
are:

For 1990-2023 the changes per gas are: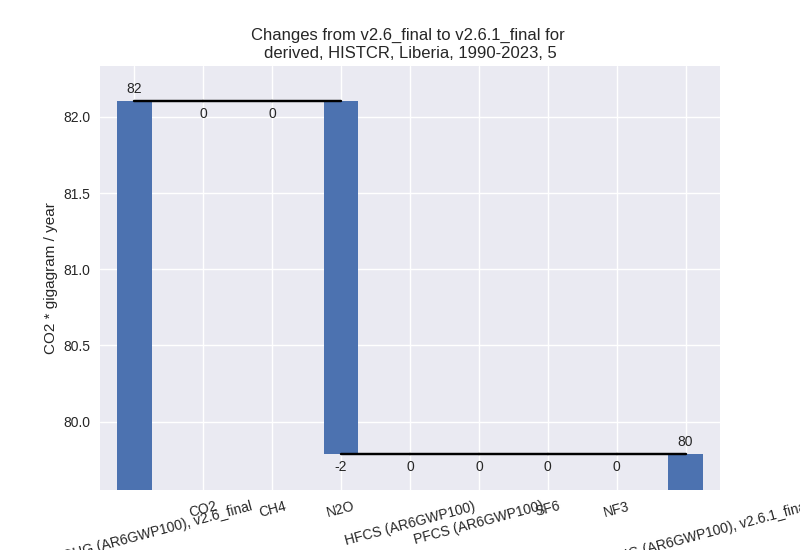
third party scenario (HISTTP):
Most important changes per time frame
For 2023 the following sector-gas combinations have the highest absolute impact on national total KyotoGHG (AR6GWP100) emissions in 2023 (top 5):
- 1: 1.A, CH4 with -606.39 Gg CO2 / year (-41.4%)
- 2: 4, CH4 with -554.77 Gg CO2 / year (-52.4%)
- 3: 1.B.1, CH4 with 419.09 Gg CO2 / year (109.7%)
- 4: 1.A, N2O with -74.48 Gg CO2 / year (-36.8%)
- 5: M.AG.ELV, N2O with 36.83 Gg CO2 / year (20.2%)
For 1990-2023 the following sector-gas combinations have the highest absolute impact on national total KyotoGHG (AR6GWP100) emissions in 1990-2023 (top 5):
- 1: 4, CH4 with -360.30 Gg CO2 / year (-53.3%)
- 2: 1.B.1, CH4 with 287.72 Gg CO2 / year (131.1%)
- 3: 1.A, CH4 with -151.42 Gg CO2 / year (-18.8%)
- 4: 1.A, N2O with -18.25 Gg CO2 / year (-16.5%)
- 5: 1.B.1, N2O with 3.81 Gg CO2 / year (131.1%)
Changes in the main sectors for aggregate KyotoGHG (AR6GWP100) are
- 1: Total sectoral emissions in 2022 are 2686.66 Gg
CO2 / year which is 66.8% of M.0.EL emissions. 2023 Emissions have
changed by -8.8% (-256.22 Gg CO2 /
year). 1990-2023 Emissions have changed by 7.2% (121.87 Gg CO2 / year). For 2023 the
changes per gas
are:

For 1990-2023 the changes per gas are:
The changes come from the following subsectors:- 1.A: Total sectoral emissions in 2022 are 1874.82
Gg CO2 / year which is 69.8% of category 1 emissions. 2023 Emissions
have changed by -26.9% (-680.86 Gg
CO2 / year). 1990-2023 Emissions have changed by -11.5% (-169.66 Gg CO2 / year). For 2023
the changes per gas
are:

For 1990-2023 the changes per gas are:
There is no subsector information available in PRIMAP-hist. - 1.B.1: Total sectoral emissions in 2022 are 811.84
Gg CO2 / year which is 30.2% of category 1 emissions. 2023 Emissions
have changed by 109.7% (424.65 Gg
CO2 / year). 1990-2023 Emissions have changed by 131.1% (291.53 Gg CO2 / year). For 2023
the changes per gas
are:

For 1990-2023 the changes per gas are: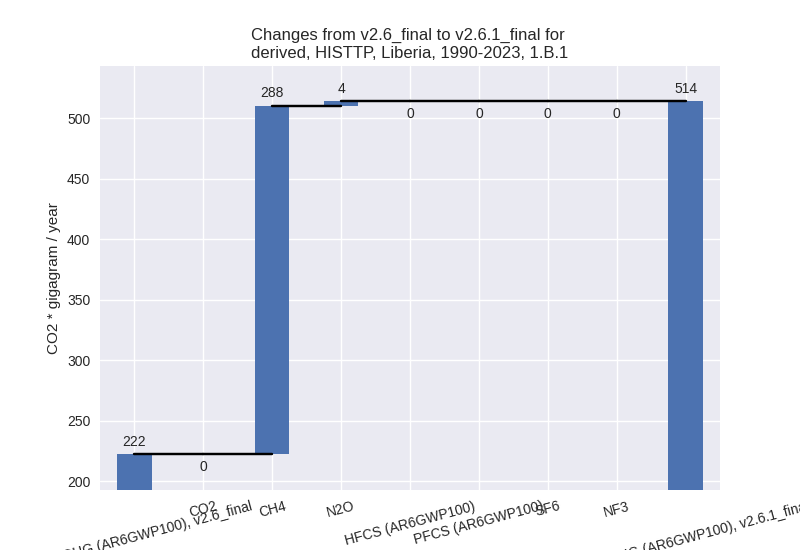
There is no subsector information available in PRIMAP-hist. - 1.B.2: Total sectoral emissions in 2022 are 0.00 Gg
CO2 / year which is 0.0% of category 1 emissions. 2023 Emissions have
changed by 30.4% (0.00 Gg CO2 /
year). 1990-2023 Emissions have changed by -1.6% (-0.00 Gg CO2 / year). For 2023 the
changes per gas
are:
There is no subsector information available in PRIMAP-hist.
- 1.A: Total sectoral emissions in 2022 are 1874.82
Gg CO2 / year which is 69.8% of category 1 emissions. 2023 Emissions
have changed by -26.9% (-680.86 Gg
CO2 / year). 1990-2023 Emissions have changed by -11.5% (-169.66 Gg CO2 / year). For 2023
the changes per gas
are:
- 2: Total sectoral emissions in 2022 are 196.31 Gg
CO2 / year which is 4.9% of M.0.EL emissions. 2023 Emissions have
changed by -11.4% (-25.30 Gg CO2 /
year). 1990-2023 Emissions have changed by -1.8% (-1.24 Gg CO2 / year). For 2023 the
changes per gas
are:

- M.AG: Total sectoral emissions in 2022 are 514.32
Gg CO2 / year which is 12.8% of M.0.EL emissions. 2023 Emissions have
changed by 7.7% (36.82 Gg CO2 /
year). 1990-2023 Emissions have changed by 0.9% (3.36 Gg CO2 / year). For 2023 the
changes per gas
are:

The changes come from the following subsectors:- 3.A: Total sectoral emissions in 2022 are 194.86 Gg
CO2 / year which is 37.9% of category M.AG emissions. 2023 Emissions
have changed by -4.6% (-9.46 Gg CO2
/ year). 1990-2023 Emissions have changed by -0.7% (-1.01 Gg CO2 / year). For 2023 the
changes per gas
are:
There is no subsector information available in PRIMAP-hist. - M.AG.ELV: Total sectoral emissions in 2022 are
319.46 Gg CO2 / year which is 62.1% of category M.AG emissions. 2023
Emissions have changed by 17.1%
(46.28 Gg CO2 / year). 1990-2023 Emissions have changed by 1.8% (4.37 Gg CO2 / year). For 2023 the
changes per gas
are:
There is no subsector information available in PRIMAP-hist.
- 3.A: Total sectoral emissions in 2022 are 194.86 Gg
CO2 / year which is 37.9% of category M.AG emissions. 2023 Emissions
have changed by -4.6% (-9.46 Gg CO2
/ year). 1990-2023 Emissions have changed by -0.7% (-1.01 Gg CO2 / year). For 2023 the
changes per gas
are:
- 4: Total sectoral emissions in 2022 are 528.81 Gg
CO2 / year which is 13.1% of M.0.EL emissions. 2023 Emissions have
changed by -50.7% (-555.81 Gg CO2 /
year). 1990-2023 Emissions have changed by -51.5% (-360.42 Gg CO2 / year). For 2023
the changes per gas
are:

For 1990-2023 the changes per gas are:
- 5: Total sectoral emissions in 2022 are 97.50 Gg
CO2 / year which is 2.4% of M.0.EL emissions. 2023 Emissions have
changed by -18.6% (-22.78 Gg CO2 /
year). 1990-2023 Emissions have changed by -2.8% (-2.32 Gg CO2 / year). For 2023 the
changes per gas
are:

For 1990-2023 the changes per gas are: