Changes in PRIMAP-hist v2.6.1_final compared to v2.6_final for Saint Lucia
2025-03-19
Johannes Gütschow
Change analysis for Saint Lucia for PRIMAP-hist v2.6.1_final compared to v2.6_final
Overview over emissions by sector and gas
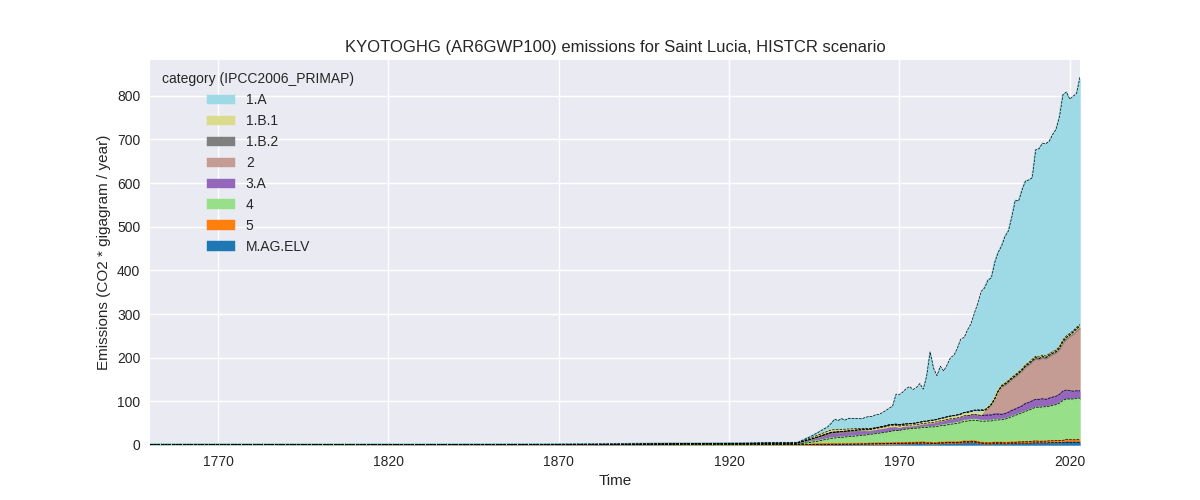
The following figures show the aggregate national total emissions excluding LULUCF AR6GWP100 for the country reported priority scenario. The dotted linesshow the v2.6_final data.

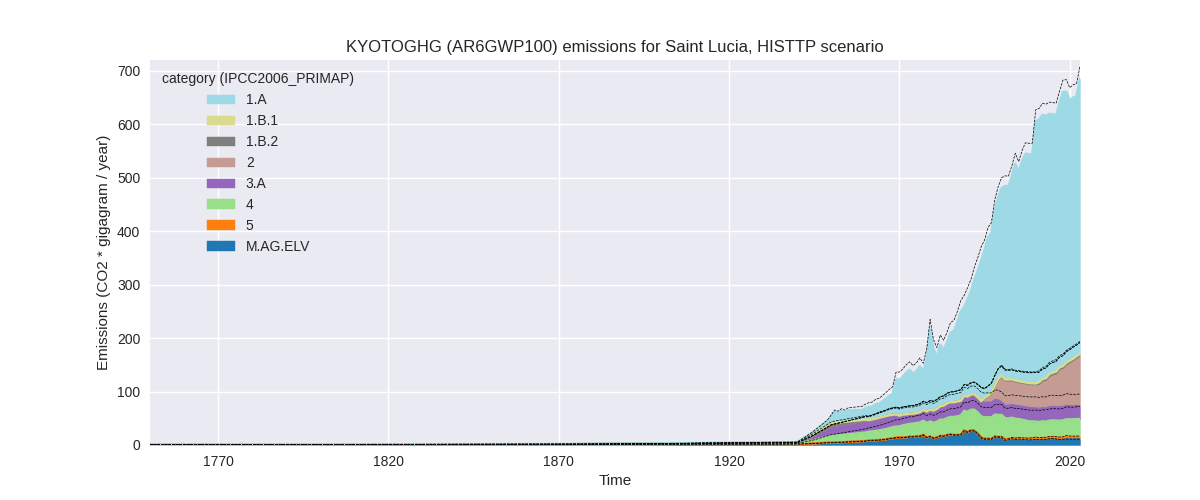
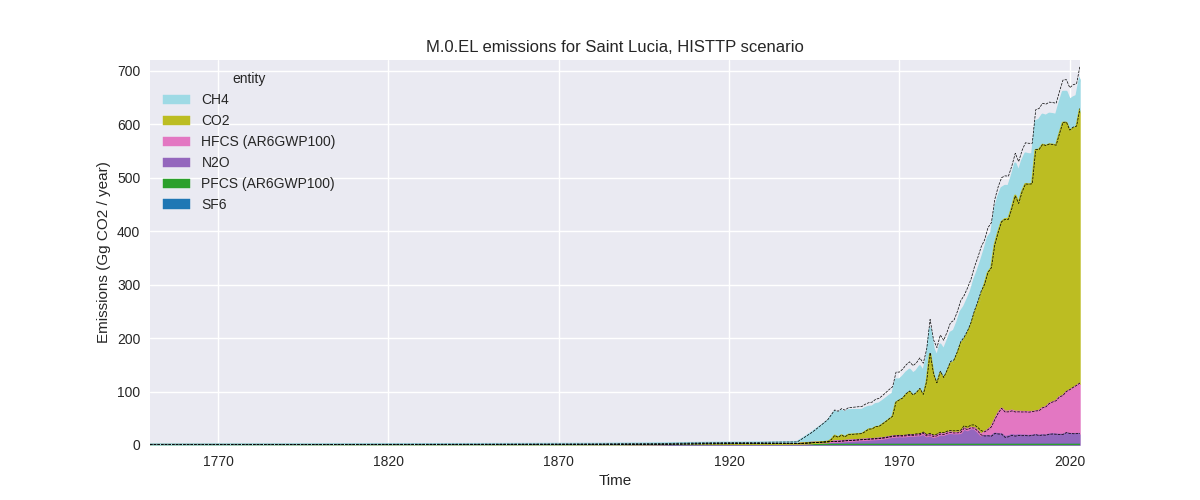
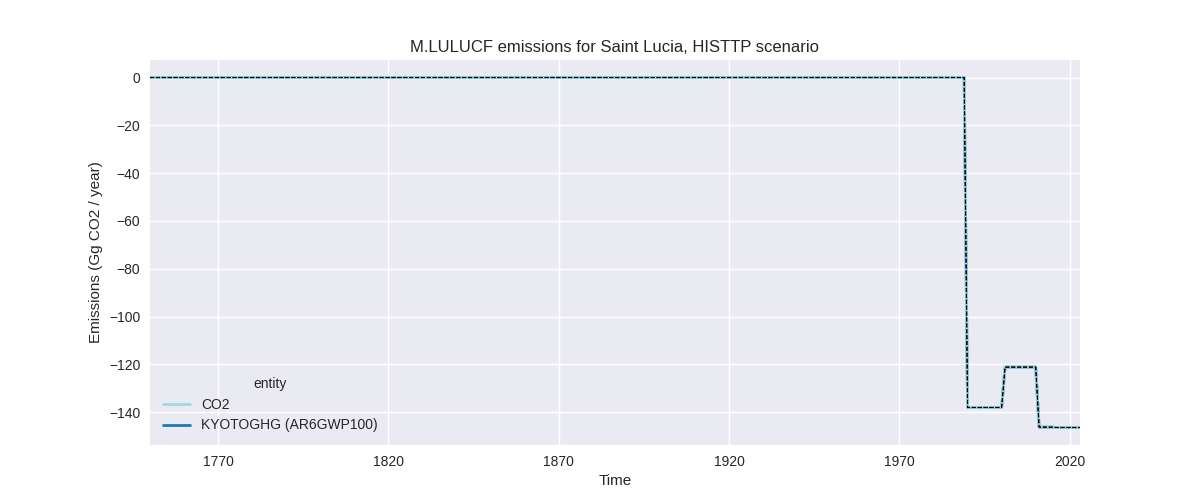
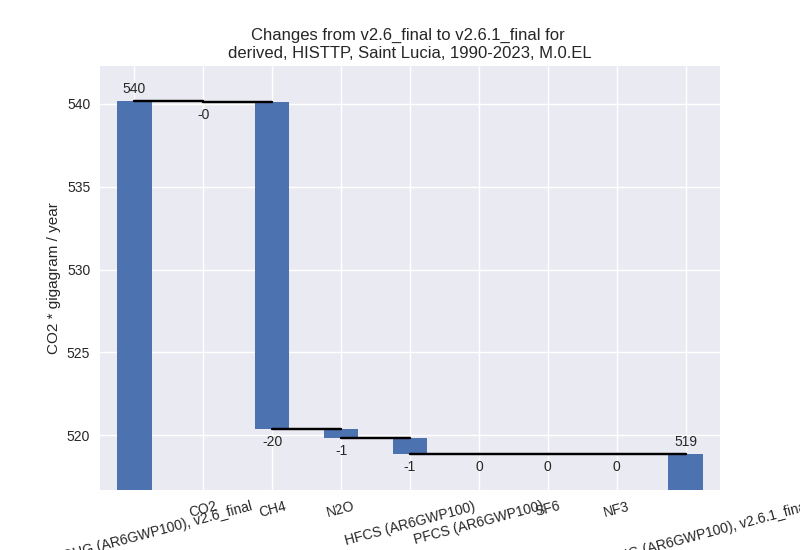
The following figures show the aggregate national total emissions excluding LULUCF AR6GWP100 for the third party priority scenario. The dotted linesshow the v2.6_final data.
Overview over changes
In the country reported priority scenario we have the following changes for aggregate Kyoto GHG and national total emissions excluding LULUCF (M.0.EL):
- Emissions in 2023 have changed by -0.4%% (-2.95 Gg CO2 / year)
- Emissions in 1990-2023 have changed by -0.4%% (-2.26 Gg CO2 / year)
In the third party priority scenario we have the following changes for aggregate Kyoto GHG and national total emissions excluding LULUCF (M.0.EL):
- Emissions in 2023 have changed by -3.3%% (-23.26 Gg CO2 / year)
- Emissions in 1990-2023 have changed by -3.9%% (-21.28 Gg CO2 / year)
Most important changes per scenario and time frame
In the country reported priority scenario the following sector-gas combinations have the highest absolute impact on national total KyotoGHG (AR6GWP100) emissions in 2023 (top 5):
- 1: 2, HFCS (AR6GWP100) with -2.73 Gg CO2 / year (-1.9%)
- 2: 5, N2O with -2.35 Gg CO2 / year (-37.5%)
- 3: 3.A, N2O with 0.94 Gg CO2 / year (18.4%)
- 4: 1.A, N2O with 0.44 Gg CO2 / year (4.2%)
- 5: 3.A, CH4 with 0.41 Gg CO2 / year (3.7%)
In the country reported priority scenario the following sector-gas combinations have the highest absolute impact on national total KyotoGHG (AR6GWP100) emissions in 1990-2023 (top 5):
- 1: 2, HFCS (AR6GWP100) with -1.38 Gg CO2 / year (-1.9%)
- 2: 5, N2O with -1.21 Gg CO2 / year (-36.5%)
- 3: 4, CH4 with 0.21 Gg CO2 / year (0.3%)
- 4: 3.A, N2O with 0.05 Gg CO2 / year (0.7%)
- 5: 1.A, N2O with 0.04 Gg CO2 / year (0.8%)
In the third party priority scenario the following sector-gas combinations have the highest absolute impact on national total KyotoGHG (AR6GWP100) emissions in 2023 (top 5):
- 1: 4, CH4 with -21.99 Gg CO2 / year (-41.4%)
- 2: 5, N2O with -2.35 Gg CO2 / year (-37.5%)
- 3: 3.A, CH4 with 0.76 Gg CO2 / year (3.4%)
- 4: 4, N2O with 0.75 Gg CO2 / year (38.4%)
- 5: 2, CO2 with -0.71 Gg CO2 / year (-40.1%)
In the third party priority scenario the following sector-gas combinations have the highest absolute impact on national total KyotoGHG (AR6GWP100) emissions in 1990-2023 (top 5):
- 1: 4, CH4 with -19.74 Gg CO2 / year (-37.4%)
- 2: 5, N2O with -1.21 Gg CO2 / year (-36.5%)
- 3: 2, HFCS (AR6GWP100) with -0.97 Gg CO2 / year (-2.1%)
- 4: 4, N2O with 0.56 Gg CO2 / year (29.7%)
- 5: 2, CO2 with -0.07 Gg CO2 / year (-7.6%)
Notes on data changes
Here we list notes explaining important emissions changes for the country.
- No new country reported data has been included. Changes in the CR time-series are small and come from updated third party data (EDGAR, FAO) which is used to extrapolate the country reported data.
- In the TP scenario the changes are for similar sectors with the addition of a high reduction of waste CH4 emissions from EDGAR data which is the dominating change for 2023 and cumulative emissions.
Changes by sector and gas
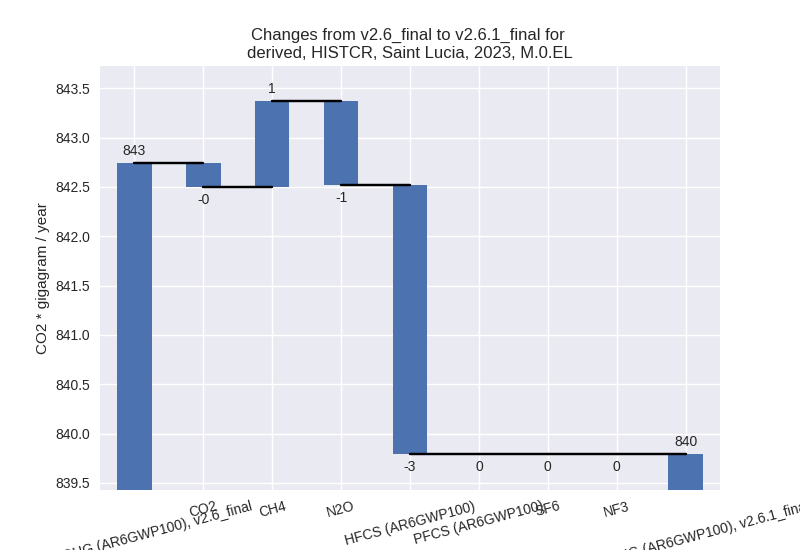
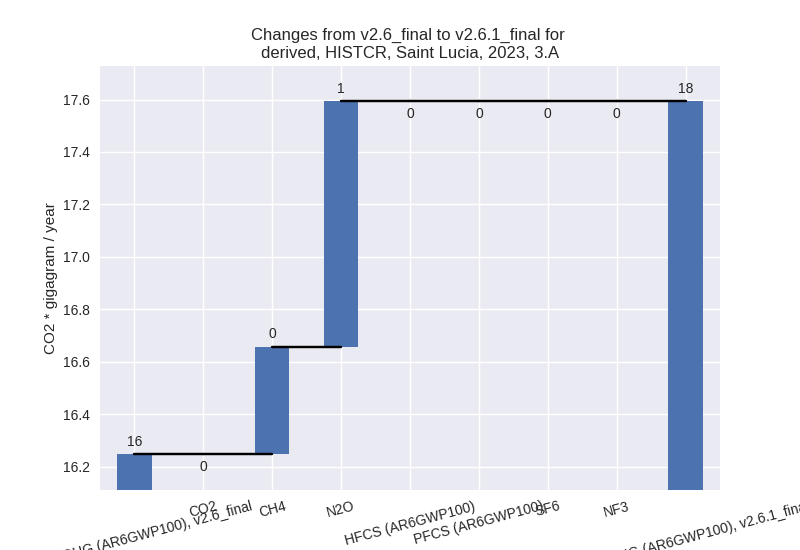
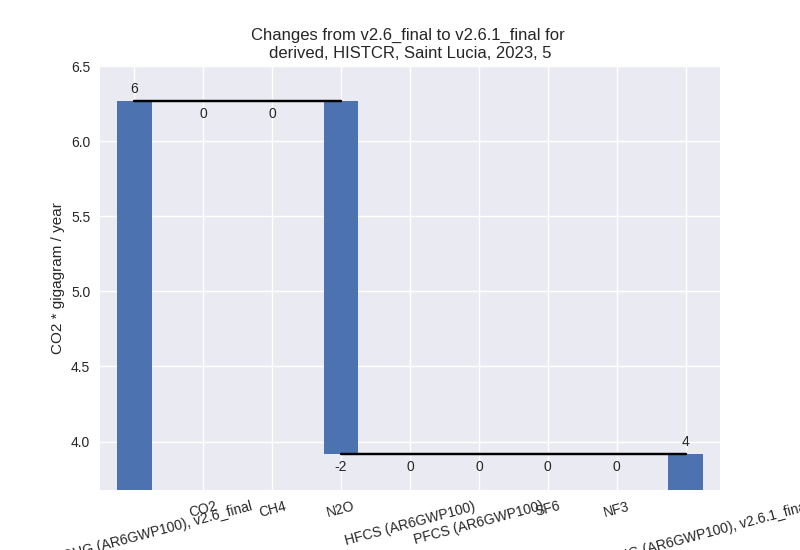
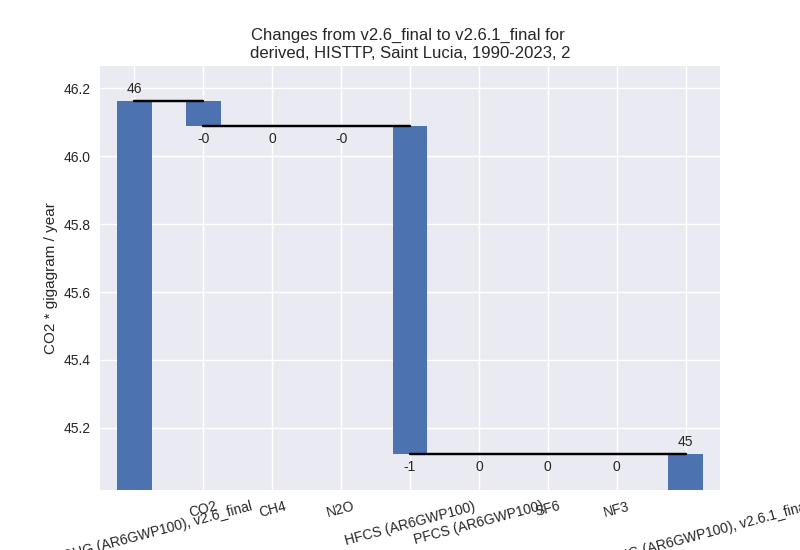
For each scenario and time frame the changes are displayed for all individual sectors and all individual gases. In the sector plot we use aggregate Kyoto GHGs in AR6GWP100. In the gas plot we usenational total emissions without LULUCF.
country reported scenario
2023
1990-2023
third party scenario
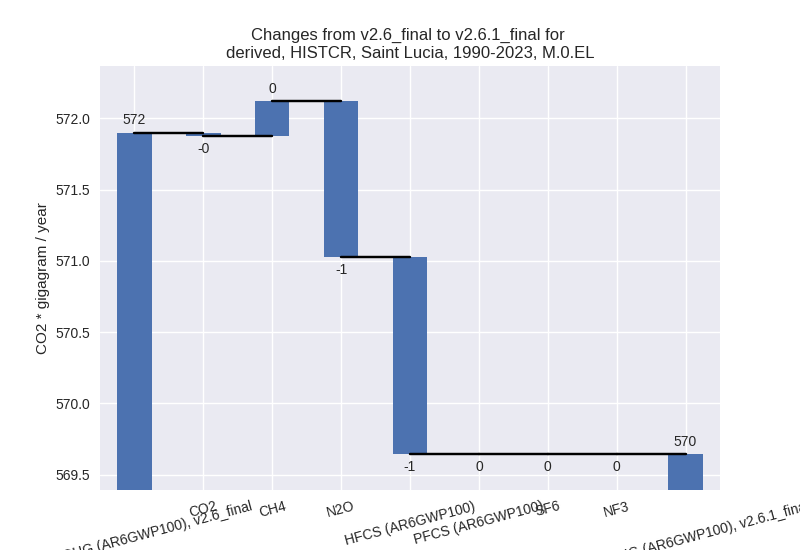
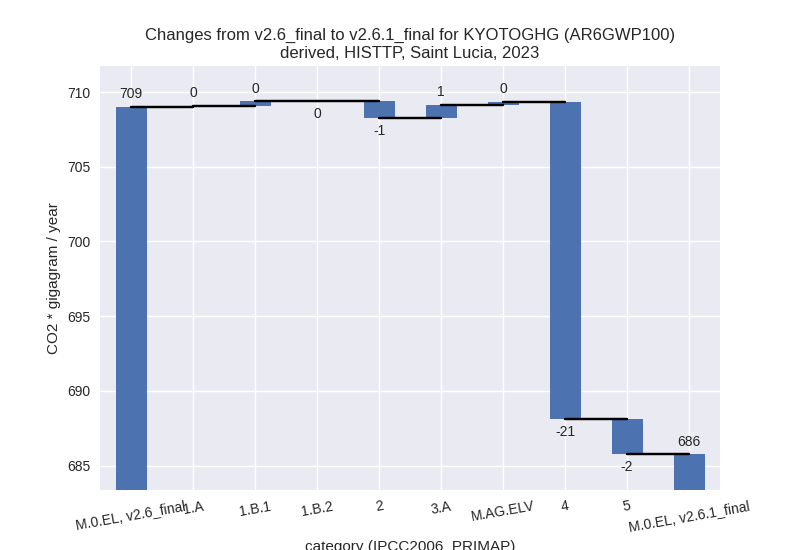
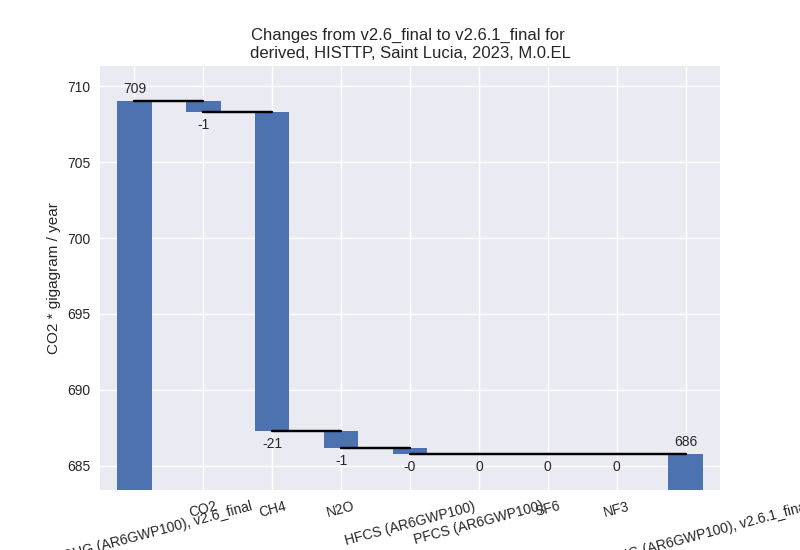
2023
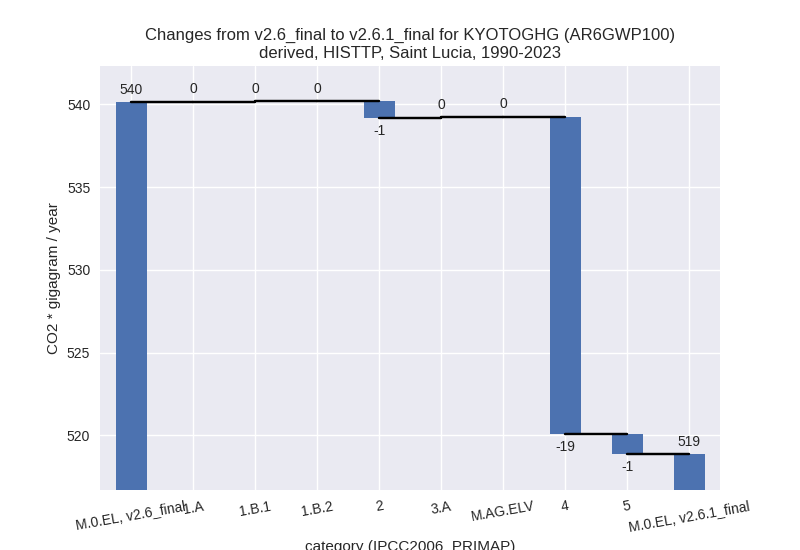
1990-2023
Detailed changes for the scenarios:
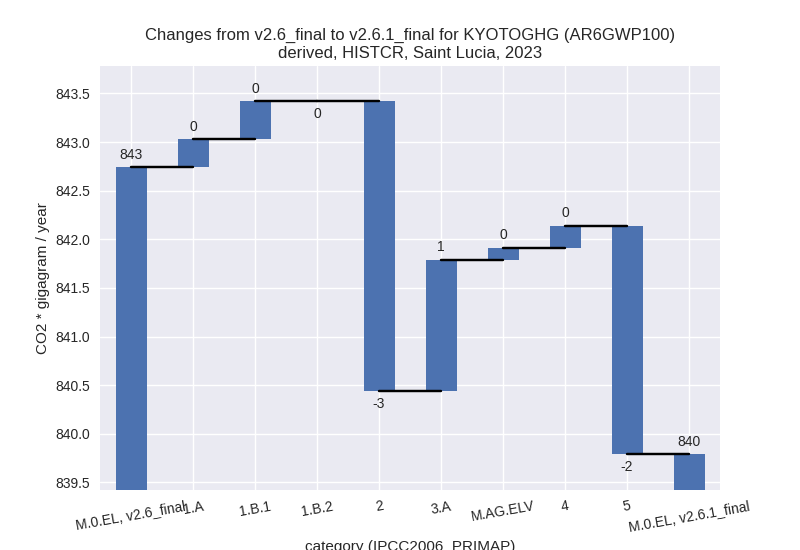
country reported scenario (HISTCR):
Most important changes per time frame
For 2023 the following sector-gas combinations have the highest absolute impact on national total KyotoGHG (AR6GWP100) emissions in 2023 (top 5):
- 1: 2, HFCS (AR6GWP100) with -2.73 Gg CO2 / year (-1.9%)
- 2: 5, N2O with -2.35 Gg CO2 / year (-37.5%)
- 3: 3.A, N2O with 0.94 Gg CO2 / year (18.4%)
- 4: 1.A, N2O with 0.44 Gg CO2 / year (4.2%)
- 5: 3.A, CH4 with 0.41 Gg CO2 / year (3.7%)
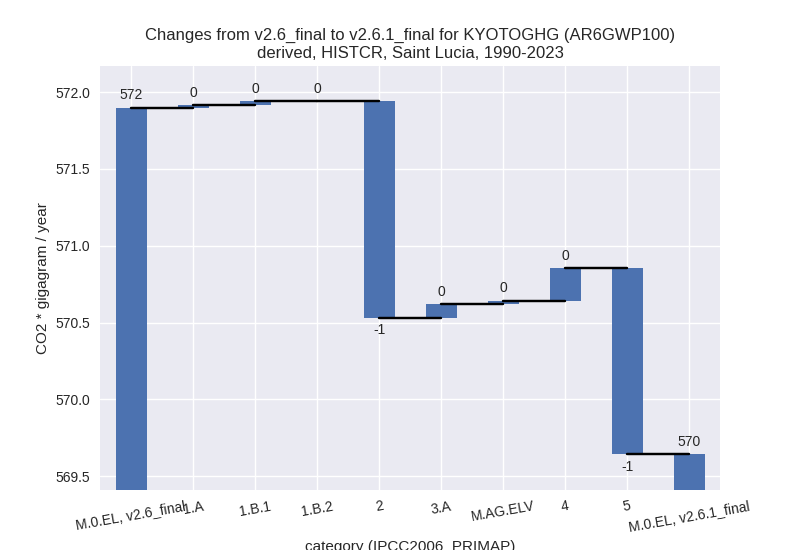
For 1990-2023 the following sector-gas combinations have the highest absolute impact on national total KyotoGHG (AR6GWP100) emissions in 1990-2023 (top 5):
- 1: 2, HFCS (AR6GWP100) with -1.38 Gg CO2 / year (-1.9%)
- 2: 5, N2O with -1.21 Gg CO2 / year (-36.5%)
- 3: 4, CH4 with 0.21 Gg CO2 / year (0.3%)
- 4: 3.A, N2O with 0.05 Gg CO2 / year (0.7%)
- 5: 1.A, N2O with 0.04 Gg CO2 / year (0.8%)
Changes in the main sectors for aggregate KyotoGHG (AR6GWP100) are
- 1: Total sectoral emissions in 2022 are 539.67 Gg CO2 / year which is 67.3% of M.0.EL emissions. 2023 Emissions have changed by 0.1% (0.68 Gg CO2 / year). 1990-2023 Emissions have changed by 0.0% (0.04 Gg CO2 / year).
- 2: Total sectoral emissions in 2022 are 139.34 Gg CO2 / year which is 17.4% of M.0.EL emissions. 2023 Emissions have changed by -2.0% (-2.98 Gg CO2 / year). 1990-2023 Emissions have changed by -1.9% (-1.41 Gg CO2 / year).
- M.AG: Total sectoral emissions in 2022 are 24.76 Gg
CO2 / year which is 3.1% of M.0.EL emissions. 2023 Emissions have
changed by 6.5% (1.47 Gg CO2 /
year). 1990-2023 Emissions have changed by 0.5% (0.11 Gg CO2 / year). For 2023 the
changes per gas
are:

The changes come from the following subsectors:- 3.A: Total sectoral emissions in 2022 are 18.35 Gg
CO2 / year which is 74.1% of category M.AG emissions. 2023 Emissions
have changed by 8.3% (1.35 Gg CO2 /
year). 1990-2023 Emissions have changed by 0.6% (0.09 Gg CO2 / year). For 2023 the
changes per gas
are:
There is no subsector information available in PRIMAP-hist. - M.AG.ELV: Total sectoral emissions in 2022 are 6.41 Gg CO2 / year which is 25.9% of category M.AG emissions. 2023 Emissions have changed by 2.0% (0.12 Gg CO2 / year). 1990-2023 Emissions have changed by 0.4% (0.02 Gg CO2 / year).
- 3.A: Total sectoral emissions in 2022 are 18.35 Gg
CO2 / year which is 74.1% of category M.AG emissions. 2023 Emissions
have changed by 8.3% (1.35 Gg CO2 /
year). 1990-2023 Emissions have changed by 0.6% (0.09 Gg CO2 / year). For 2023 the
changes per gas
are:
- 4: Total sectoral emissions in 2022 are 94.50 Gg CO2 / year which is 11.8% of M.0.EL emissions. 2023 Emissions have changed by 0.2% (0.23 Gg CO2 / year). 1990-2023 Emissions have changed by 0.3% (0.21 Gg CO2 / year).
- 5: Total sectoral emissions in 2022 are 3.73 Gg CO2
/ year which is 0.5% of M.0.EL emissions. 2023 Emissions have changed by
-37.5% (-2.35 Gg CO2 / year).
1990-2023 Emissions have changed by -36.5% (-1.21 Gg CO2 / year). For 2023 the
changes per gas
are:
For 1990-2023 the changes per gas are:
third party scenario (HISTTP):
Most important changes per time frame
For 2023 the following sector-gas combinations have the highest absolute impact on national total KyotoGHG (AR6GWP100) emissions in 2023 (top 5):
- 1: 4, CH4 with -21.99 Gg CO2 / year (-41.4%)
- 2: 5, N2O with -2.35 Gg CO2 / year (-37.5%)
- 3: 3.A, CH4 with 0.76 Gg CO2 / year (3.4%)
- 4: 4, N2O with 0.75 Gg CO2 / year (38.4%)
- 5: 2, CO2 with -0.71 Gg CO2 / year (-40.1%)
For 1990-2023 the following sector-gas combinations have the highest absolute impact on national total KyotoGHG (AR6GWP100) emissions in 1990-2023 (top 5):
- 1: 4, CH4 with -19.74 Gg CO2 / year (-37.4%)
- 2: 5, N2O with -1.21 Gg CO2 / year (-36.5%)
- 3: 2, HFCS (AR6GWP100) with -0.97 Gg CO2 / year (-2.1%)
- 4: 4, N2O with 0.56 Gg CO2 / year (29.7%)
- 5: 2, CO2 with -0.07 Gg CO2 / year (-7.6%)
Changes in the main sectors for aggregate KyotoGHG (AR6GWP100) are
- 1: Total sectoral emissions in 2022 are 489.21 Gg CO2 / year which is 75.0% of M.0.EL emissions. 2023 Emissions have changed by 0.1% (0.37 Gg CO2 / year). 1990-2023 Emissions have changed by 0.0% (0.05 Gg CO2 / year).
- 2: Total sectoral emissions in 2022 are 90.86 Gg
CO2 / year which is 13.9% of M.0.EL emissions. 2023 Emissions have
changed by -1.2% (-1.12 Gg CO2 /
year). 1990-2023 Emissions have changed by -2.3% (-1.04 Gg CO2 / year). For 1990-2023
the changes per gas
are:
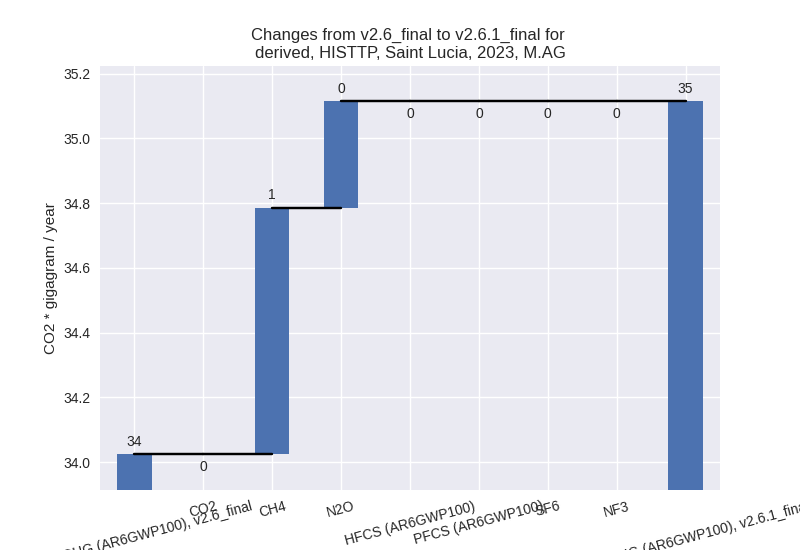
- M.AG: Total sectoral emissions in 2022 are 35.37 Gg
CO2 / year which is 5.4% of M.0.EL emissions. 2023 Emissions have
changed by 3.2% (1.09 Gg CO2 /
year). 1990-2023 Emissions have changed by 0.3% (0.10 Gg CO2 / year). For 2023 the
changes per gas
are:
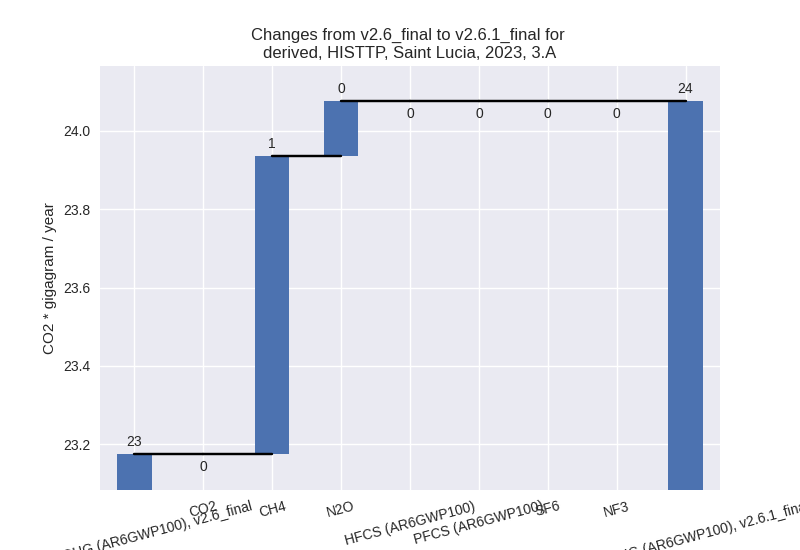
The changes come from the following subsectors:- 3.A: Total sectoral emissions in 2022 are 24.23 Gg
CO2 / year which is 68.5% of category M.AG emissions. 2023 Emissions
have changed by 3.9% (0.90 Gg CO2 /
year). 1990-2023 Emissions have changed by 0.3% (0.07 Gg CO2 / year). For 2023 the
changes per gas
are:
There is no subsector information available in PRIMAP-hist. - M.AG.ELV: Total sectoral emissions in 2022 are 11.14 Gg CO2 / year which is 31.5% of category M.AG emissions. 2023 Emissions have changed by 1.7% (0.19 Gg CO2 / year). 1990-2023 Emissions have changed by 0.2% (0.03 Gg CO2 / year).
- 3.A: Total sectoral emissions in 2022 are 24.23 Gg
CO2 / year which is 68.5% of category M.AG emissions. 2023 Emissions
have changed by 3.9% (0.90 Gg CO2 /
year). 1990-2023 Emissions have changed by 0.3% (0.07 Gg CO2 / year). For 2023 the
changes per gas
are:
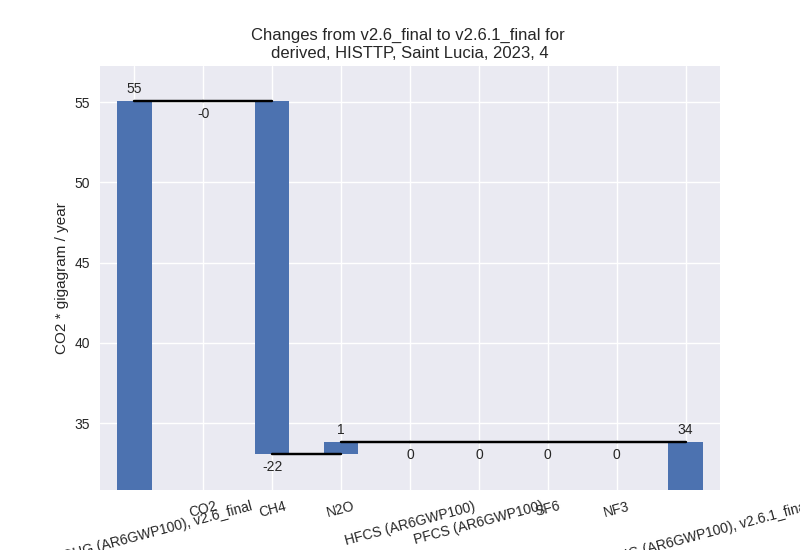
- 4: Total sectoral emissions in 2022 are 33.55 Gg
CO2 / year which is 5.1% of M.0.EL emissions. 2023 Emissions have
changed by -38.6% (-21.25 Gg CO2 /
year). 1990-2023 Emissions have changed by -35.1% (-19.18 Gg CO2 / year). For 2023
the changes per gas
are:
For 1990-2023 the changes per gas are: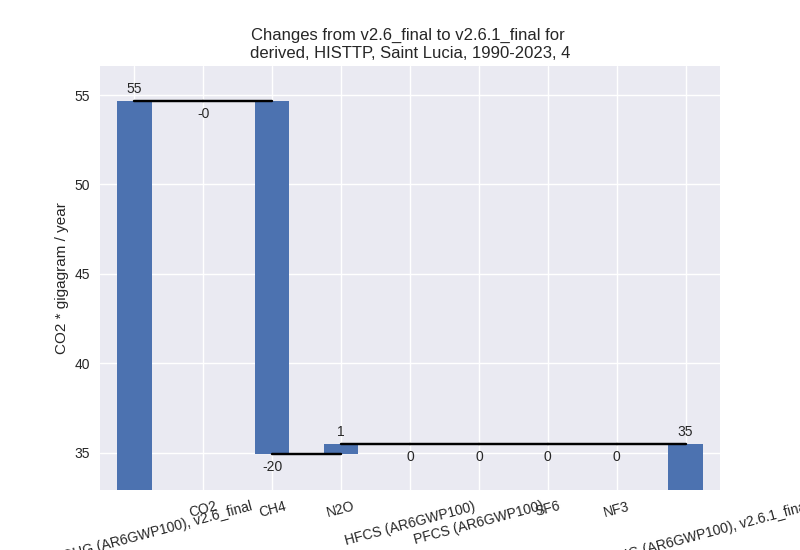
- 5: Total sectoral emissions in 2022 are 3.73 Gg CO2
/ year which is 0.6% of M.0.EL emissions. 2023 Emissions have changed by
-37.5% (-2.35 Gg CO2 / year).
1990-2023 Emissions have changed by -36.5% (-1.21 Gg CO2 / year). For 2023 the
changes per gas
are:

For 1990-2023 the changes per gas are: