Changes in PRIMAP-hist v2.6.1_final compared to v2.6_final for Liechtenstein
2025-03-19
Johannes Gütschow
Change analysis for Liechtenstein for PRIMAP-hist v2.6.1_final compared to v2.6_final
Overview over emissions by sector and gas
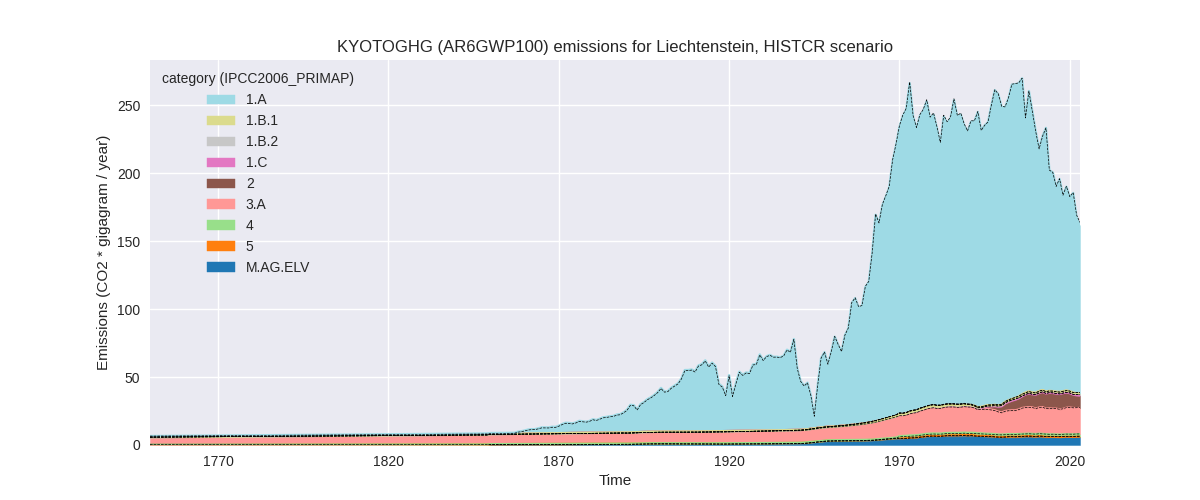
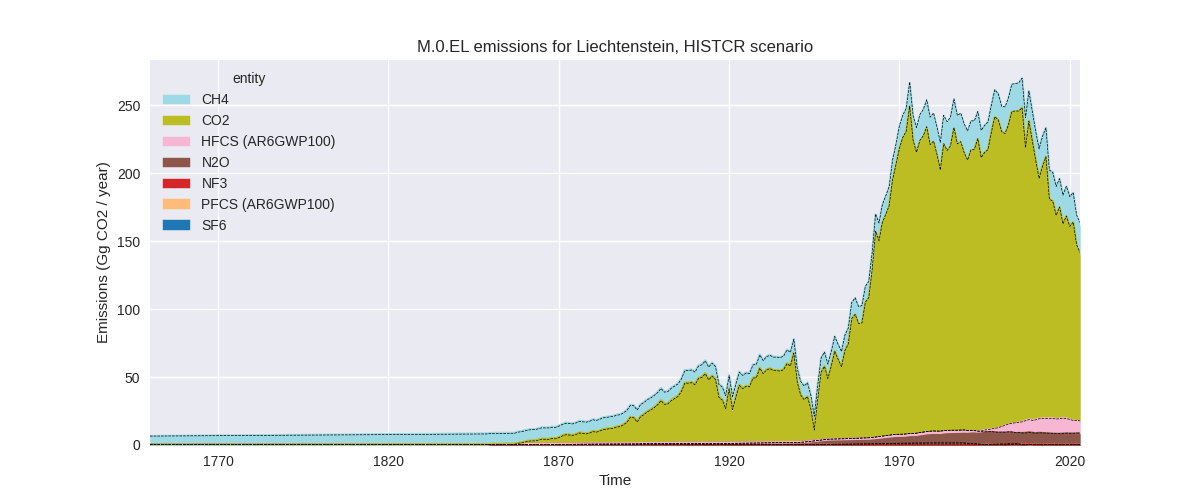
The following figures show the aggregate national total emissions excluding LULUCF AR6GWP100 for the country reported priority scenario. The dotted linesshow the v2.6_final data.
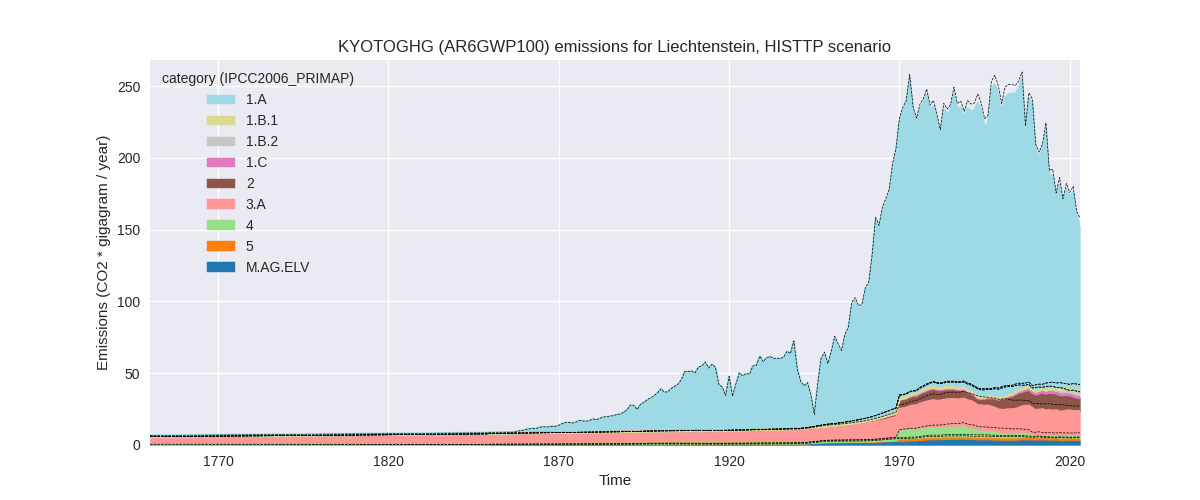
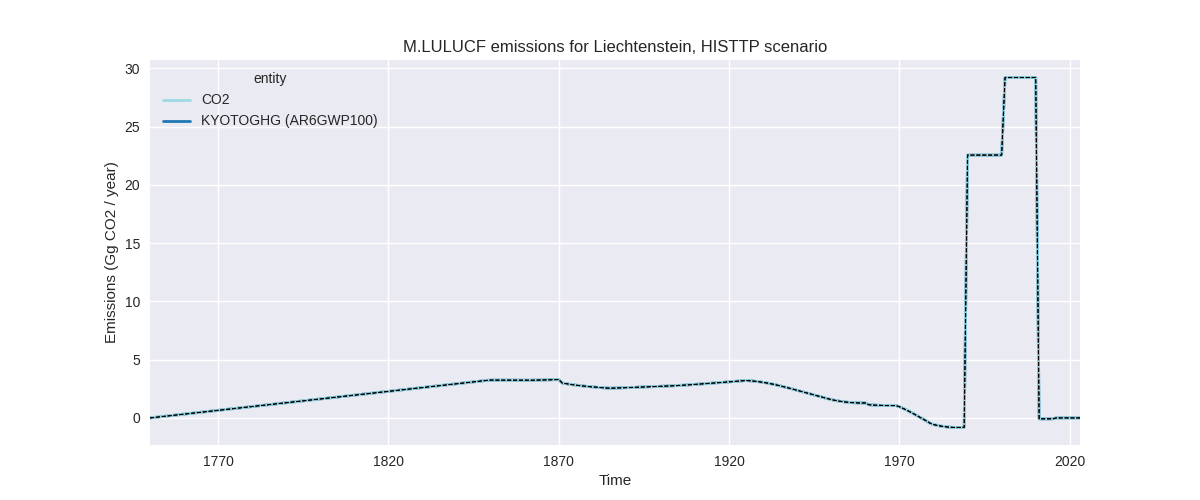
The following figures show the aggregate national total emissions excluding LULUCF AR6GWP100 for the third party priority scenario. The dotted linesshow the v2.6_final data.

Overview over changes
In the country reported priority scenario we have the following changes for aggregate Kyoto GHG and national total emissions excluding LULUCF (M.0.EL):
- Emissions in 2023 have changed by -1.6%% (-2.60 Gg CO2 / year)
- Emissions in 1990-2023 have changed by -0.2%% (-0.37 Gg CO2 / year)
In the third party priority scenario we have the following changes for aggregate Kyoto GHG and national total emissions excluding LULUCF (M.0.EL):
- Emissions in 2023 have changed by -3.8%% (-5.95 Gg CO2 / year)
- Emissions in 1990-2023 have changed by -2.3%% (-5.17 Gg CO2 / year)
Most important changes per scenario and time frame
In the country reported priority scenario the following sector-gas combinations have the highest absolute impact on national total KyotoGHG (AR6GWP100) emissions in 2023 (top 5):
- 1: 1.A, CO2 with -1.88 Gg CO2 / year (-1.5%)
- 2: M.AG.ELV, N2O with -0.52 Gg CO2 / year (-8.2%)
- 3: 3.A, CH4 with -0.41 Gg CO2 / year (-2.1%)
- 4: 5, N2O with 0.39 Gg CO2 / year (inf%)
- 5: 2, PFCS (AR6GWP100) with -0.14 Gg CO2 / year (-99.3%)
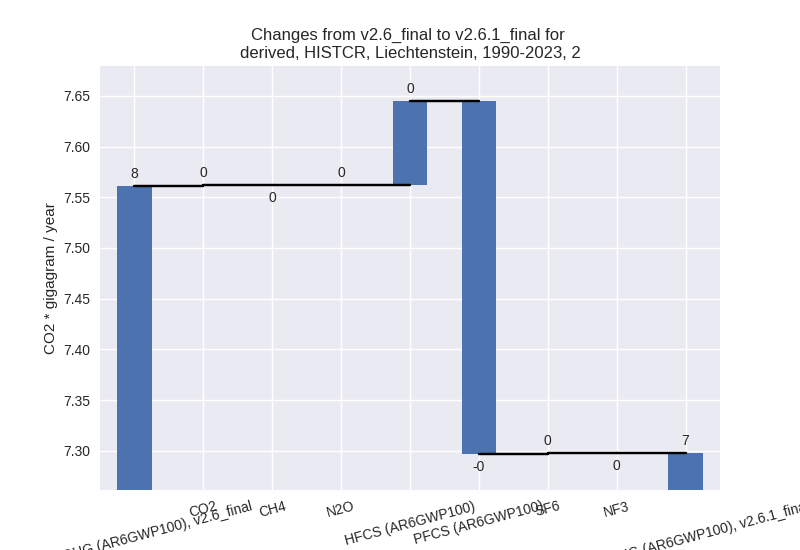
In the country reported priority scenario the following sector-gas combinations have the highest absolute impact on national total KyotoGHG (AR6GWP100) emissions in 1990-2023 (top 5):
- 1: 5, N2O with 0.68 Gg CO2 / year (inf%)
- 2: M.AG.ELV, N2O with -0.63 Gg CO2 / year (-10.1%)
- 3: 2, PFCS (AR6GWP100) with -0.35 Gg CO2 / year (-94.5%)
- 4: 1.A, CO2 with -0.14 Gg CO2 / year (-0.1%)
- 5: 2, HFCS (AR6GWP100) with 0.08 Gg CO2 / year (1.2%)
In the third party priority scenario the following sector-gas combinations have the highest absolute impact on national total KyotoGHG (AR6GWP100) emissions in 2023 (top 5):
- 1: M.AG.ELV, N2O with -1.85 Gg CO2 / year (-36.8%)
- 2: 1.A, CO2 with -1.57 Gg CO2 / year (-1.4%)
- 3: 4, CH4 with -1.07 Gg CO2 / year (-51.4%)
- 4: 2, HFCS (AR6GWP100) with -0.82 Gg CO2 / year (-12.0%)
- 5: 3.A, CH4 with -0.78 Gg CO2 / year (-4.4%)
In the third party priority scenario the following sector-gas combinations have the highest absolute impact on national total KyotoGHG (AR6GWP100) emissions in 1990-2023 (top 5):
- 1: M.AG.ELV, N2O with -2.37 Gg CO2 / year (-43.8%)
- 2: 3.A, CH4 with -1.89 Gg CO2 / year (-9.9%)
- 3: 4, CH4 with -0.99 Gg CO2 / year (-28.4%)
- 4: 2, SF6 with 0.12 Gg CO2 / year (15.0%)
- 5: 2, HFCS (AR6GWP100) with -0.12 Gg CO2 / year (-2.4%)
Notes on data changes
Here we list notes explaining important emissions changes for the country.
- CRT from BTR1 data has been included. Changes are small with the main contribution in 2023 from a 1.5% reduction in energy CO2. PFC emissions are much lower because country reported emissions are available for the first time which are much lower than the EDGAR estimates but the contribution to total emissions is very small.
- In the TP scenario changes are small in terms of total emissions as
well
- FAOSTAT data includes Liechtenstein for the first time leading to changes for all years in the agricultural sectors.
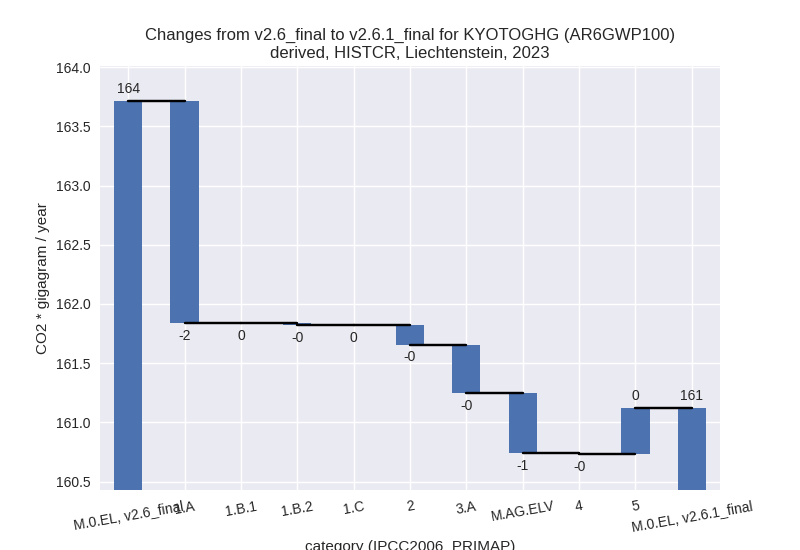
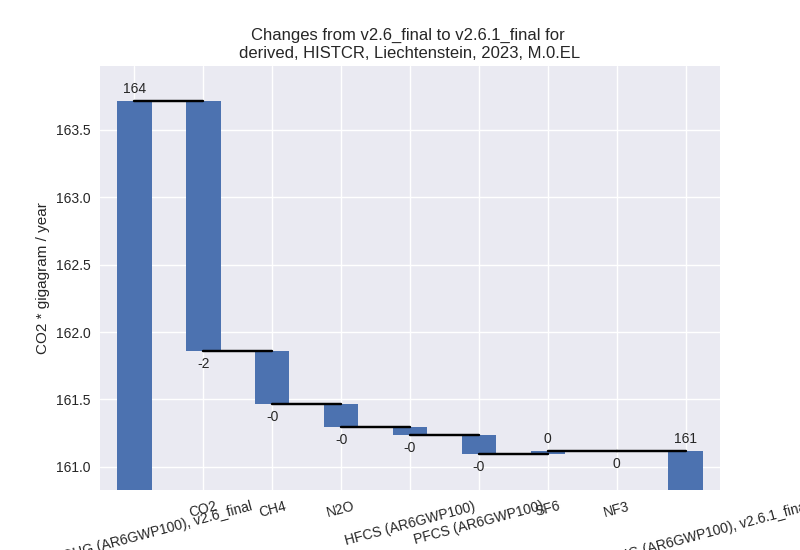
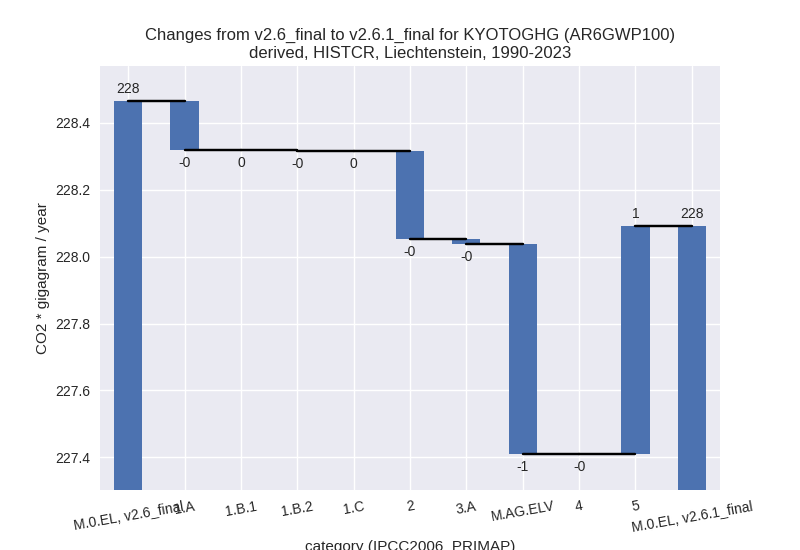
Changes by sector and gas
For each scenario and time frame the changes are displayed for all individual sectors and all individual gases. In the sector plot we use aggregate Kyoto GHGs in AR6GWP100. In the gas plot we usenational total emissions without LULUCF.
country reported scenario
2023
1990-2023

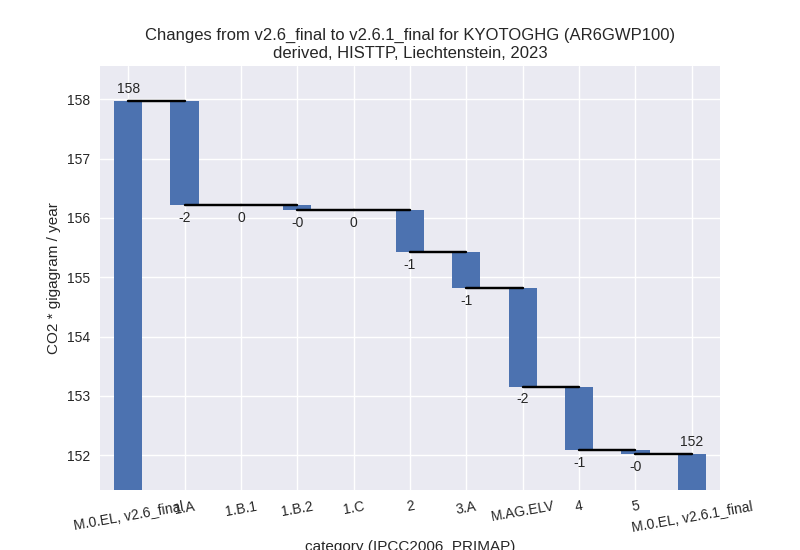
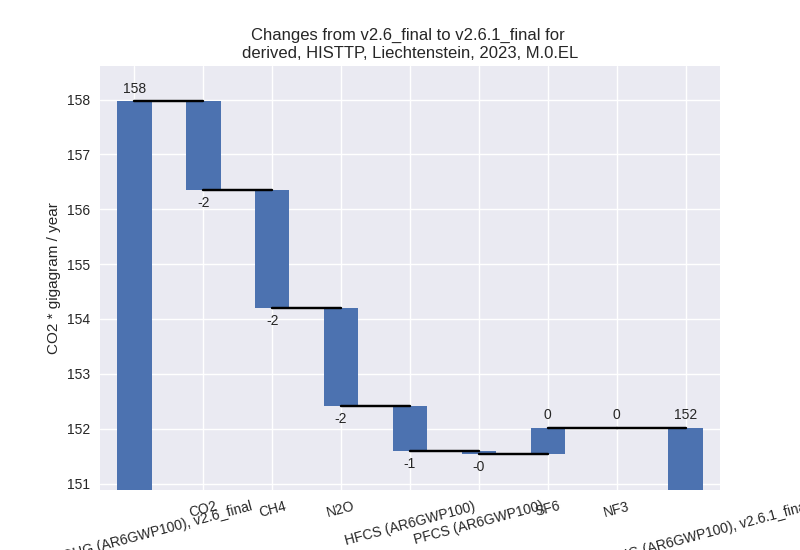
third party scenario
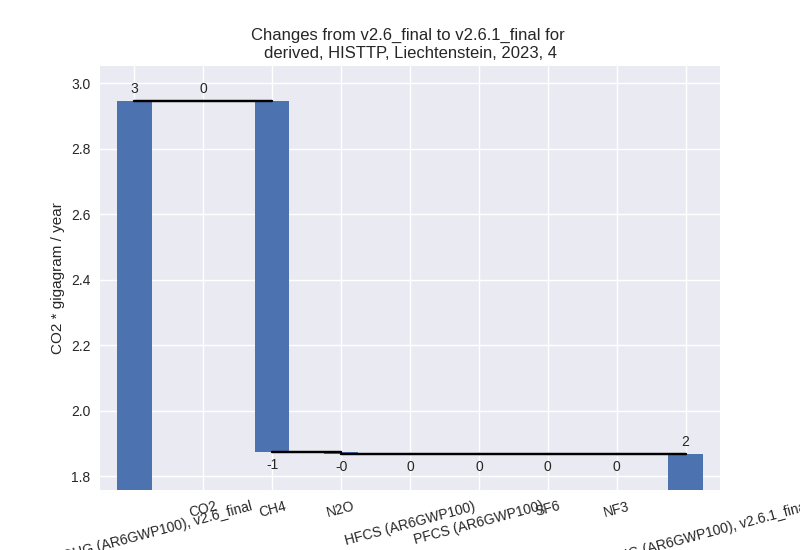
2023
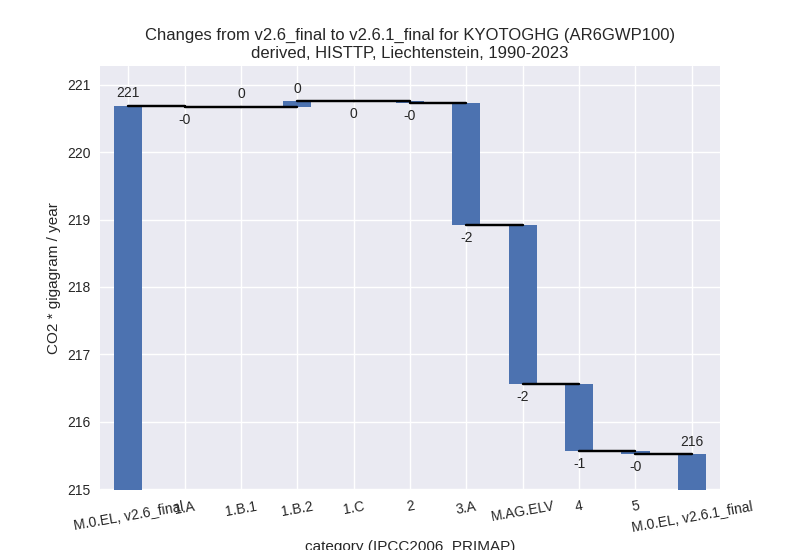
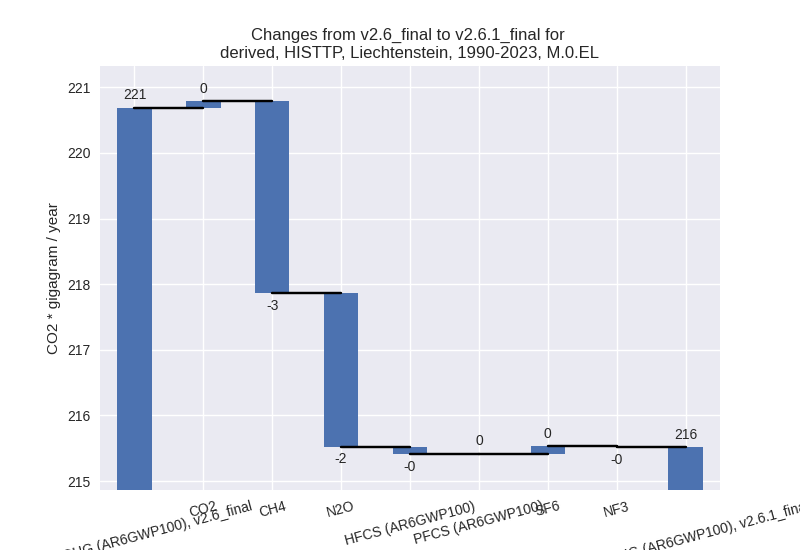
1990-2023
Detailed changes for the scenarios:
country reported scenario (HISTCR):
Most important changes per time frame
For 2023 the following sector-gas combinations have the highest absolute impact on national total KyotoGHG (AR6GWP100) emissions in 2023 (top 5):
- 1: 1.A, CO2 with -1.88 Gg CO2 / year (-1.5%)
- 2: M.AG.ELV, N2O with -0.52 Gg CO2 / year (-8.2%)
- 3: 3.A, CH4 with -0.41 Gg CO2 / year (-2.1%)
- 4: 5, N2O with 0.39 Gg CO2 / year (inf%)
- 5: 2, PFCS (AR6GWP100) with -0.14 Gg CO2 / year (-99.3%)
For 1990-2023 the following sector-gas combinations have the highest absolute impact on national total KyotoGHG (AR6GWP100) emissions in 1990-2023 (top 5):
- 1: 5, N2O with 0.68 Gg CO2 / year (inf%)
- 2: M.AG.ELV, N2O with -0.63 Gg CO2 / year (-10.1%)
- 3: 2, PFCS (AR6GWP100) with -0.35 Gg CO2 / year (-94.5%)
- 4: 1.A, CO2 with -0.14 Gg CO2 / year (-0.1%)
- 5: 2, HFCS (AR6GWP100) with 0.08 Gg CO2 / year (1.2%)
Changes in the main sectors for aggregate KyotoGHG (AR6GWP100) are
- 1: Total sectoral emissions in 2022 are 130.88 Gg CO2 / year which is 78.1% of M.0.EL emissions. 2023 Emissions have changed by -1.5% (-1.89 Gg CO2 / year). 1990-2023 Emissions have changed by -0.1% (-0.15 Gg CO2 / year).
- 2: Total sectoral emissions in 2022 are 9.58 Gg CO2
/ year which is 5.7% of M.0.EL emissions. 2023 Emissions have changed by
-1.8% (-0.17 Gg CO2 / year).
1990-2023 Emissions have changed by -3.5% (-0.26 Gg CO2 / year). For 1990-2023
the changes per gas
are:
- M.AG: Total sectoral emissions in 2022 are 24.96 Gg
CO2 / year which is 14.9% of M.0.EL emissions. 2023 Emissions have
changed by -3.5% (-0.92 Gg CO2 /
year). 1990-2023 Emissions have changed by -2.6% (-0.64 Gg CO2 / year). For 2023 the
changes per gas
are:
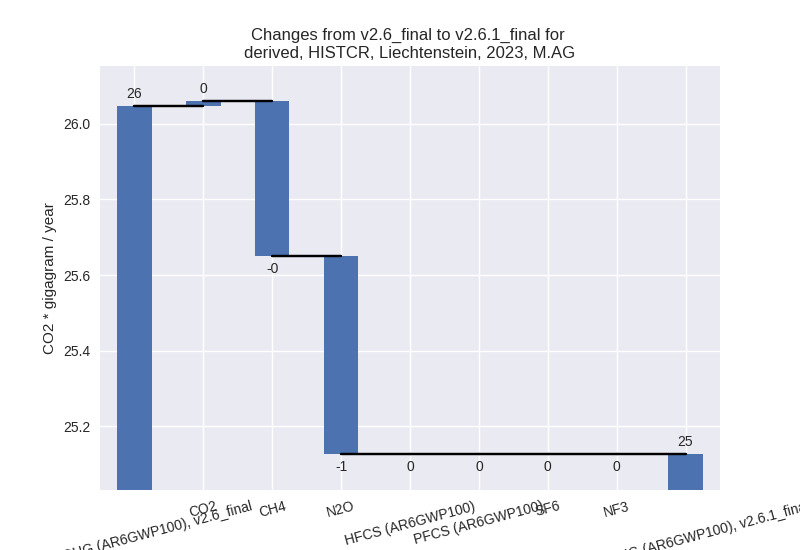
For 1990-2023 the changes per gas are:
The changes come from the following subsectors:- 3.A: Total sectoral emissions in 2022 are 19.23 Gg
CO2 / year which is 77.0% of category M.AG emissions. 2023 Emissions
have changed by -2.1% (-0.41 Gg CO2
/ year). 1990-2023 Emissions have changed by -0.1% (-0.01 Gg CO2 / year). For 2023 the
changes per gas
are:

There is no subsector information available in PRIMAP-hist. - M.AG.ELV: Total sectoral emissions in 2022 are 5.73
Gg CO2 / year which is 23.0% of category M.AG emissions. 2023 Emissions
have changed by -7.9% (-0.51 Gg CO2
/ year). 1990-2023 Emissions have changed by -10.0% (-0.63 Gg CO2 / year). For 2023 the
changes per gas
are:
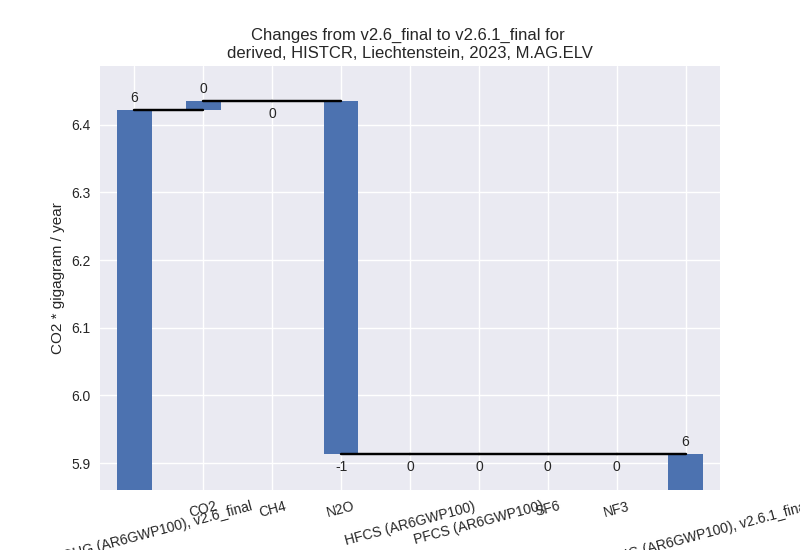
For 1990-2023 the changes per gas are:
There is no subsector information available in PRIMAP-hist.
- 3.A: Total sectoral emissions in 2022 are 19.23 Gg
CO2 / year which is 77.0% of category M.AG emissions. 2023 Emissions
have changed by -2.1% (-0.41 Gg CO2
/ year). 1990-2023 Emissions have changed by -0.1% (-0.01 Gg CO2 / year). For 2023 the
changes per gas
are:
- 4: Total sectoral emissions in 2022 are 1.69 Gg CO2 / year which is 1.0% of M.0.EL emissions. 2023 Emissions have changed by -0.5% (-0.01 Gg CO2 / year). 1990-2023 Emissions have changed by -0.0% (-0.00 Gg CO2 / year).
- 5: Total sectoral emissions in 2022 are 0.39 Gg CO2
/ year which is 0.2% of M.0.EL emissions. 2023 Emissions have changed by
inf% (0.39 Gg CO2 / year). 1990-2023
Emissions have changed by inf% (0.68
Gg CO2 / year). For 2023 the changes per gas
are:
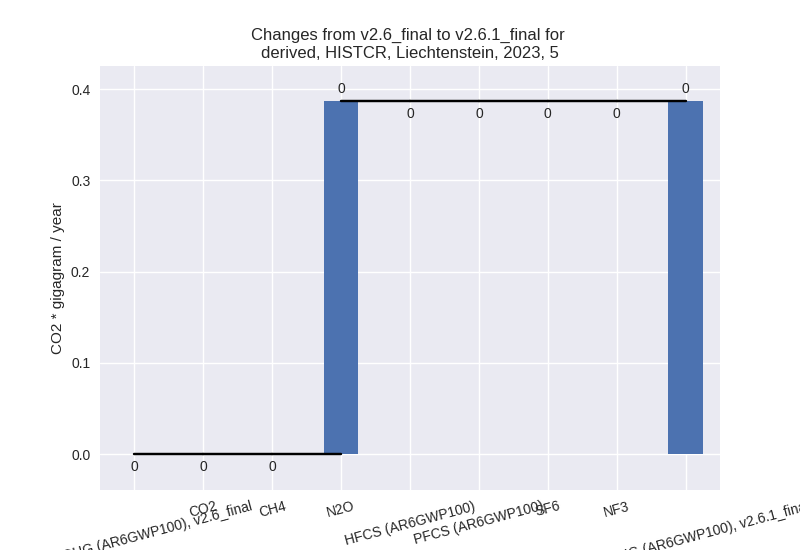
For 1990-2023 the changes per gas are: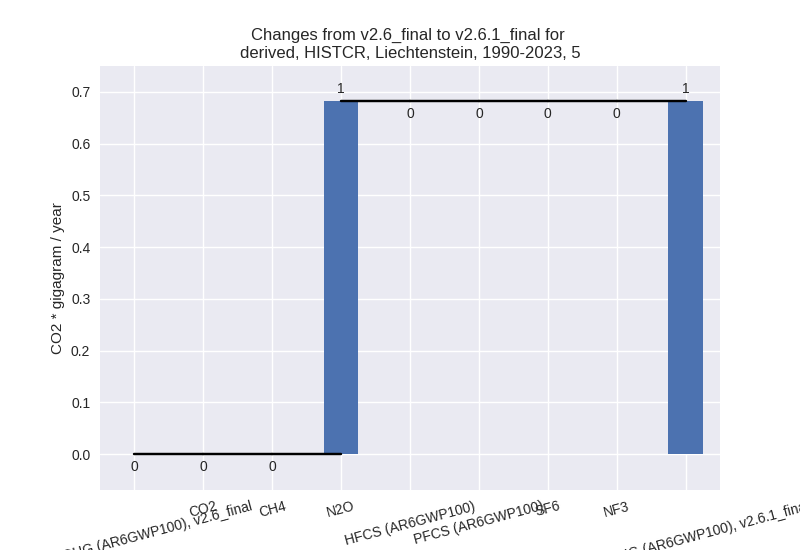
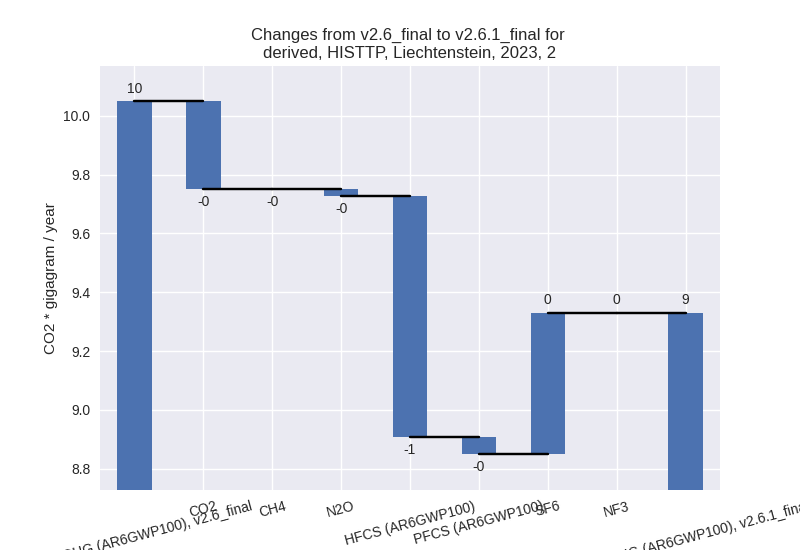
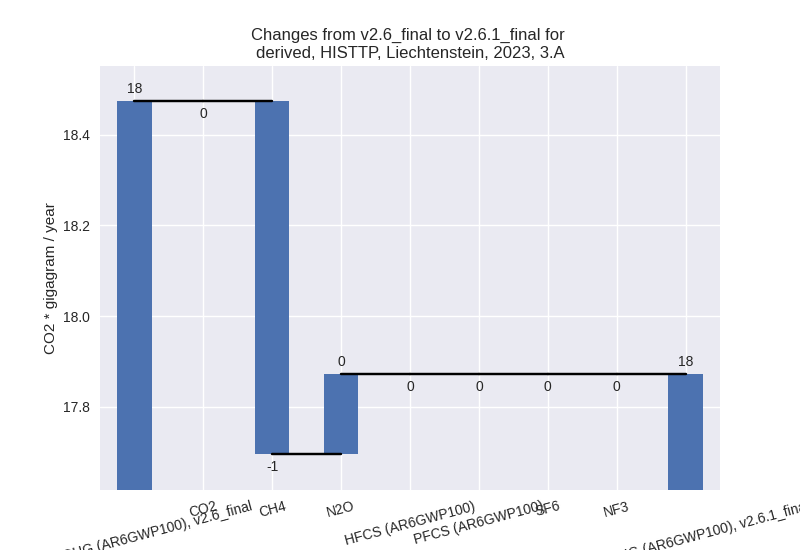
third party scenario (HISTTP):
Most important changes per time frame
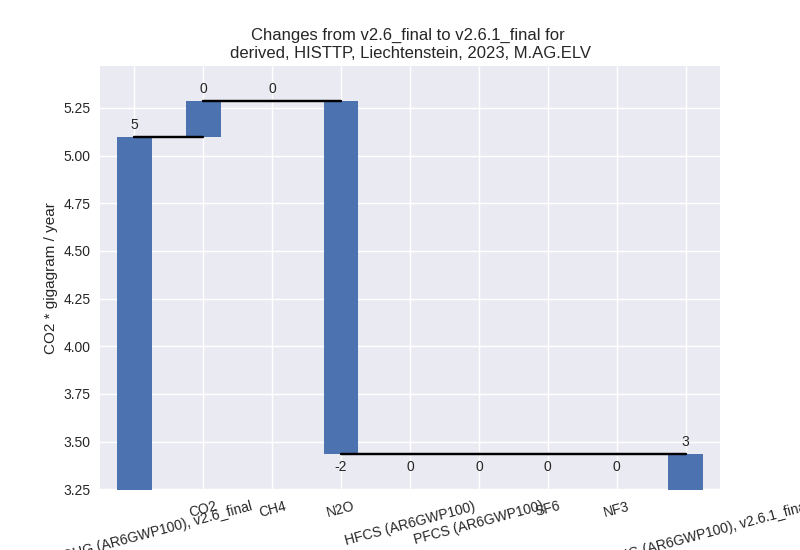
For 2023 the following sector-gas combinations have the highest absolute impact on national total KyotoGHG (AR6GWP100) emissions in 2023 (top 5):
- 1: M.AG.ELV, N2O with -1.85 Gg CO2 / year (-36.8%)
- 2: 1.A, CO2 with -1.57 Gg CO2 / year (-1.4%)
- 3: 4, CH4 with -1.07 Gg CO2 / year (-51.4%)
- 4: 2, HFCS (AR6GWP100) with -0.82 Gg CO2 / year (-12.0%)
- 5: 3.A, CH4 with -0.78 Gg CO2 / year (-4.4%)
For 1990-2023 the following sector-gas combinations have the highest absolute impact on national total KyotoGHG (AR6GWP100) emissions in 1990-2023 (top 5):
- 1: M.AG.ELV, N2O with -2.37 Gg CO2 / year (-43.8%)
- 2: 3.A, CH4 with -1.89 Gg CO2 / year (-9.9%)
- 3: 4, CH4 with -0.99 Gg CO2 / year (-28.4%)
- 4: 2, SF6 with 0.12 Gg CO2 / year (15.0%)
- 5: 2, HFCS (AR6GWP100) with -0.12 Gg CO2 / year (-2.4%)
Changes in the main sectors for aggregate KyotoGHG (AR6GWP100) are
- 1: Total sectoral emissions in 2022 are 126.20 Gg CO2 / year which is 79.2% of M.0.EL emissions. 2023 Emissions have changed by -1.5% (-1.83 Gg CO2 / year). 1990-2023 Emissions have changed by 0.0% (0.07 Gg CO2 / year).
- 2: Total sectoral emissions in 2022 are 9.72 Gg CO2
/ year which is 6.1% of M.0.EL emissions. 2023 Emissions have changed by
-7.1% (-0.72 Gg CO2 / year).
1990-2023 Emissions have changed by -0.2% (-0.02 Gg CO2 / year). For 2023 the
changes per gas
are:
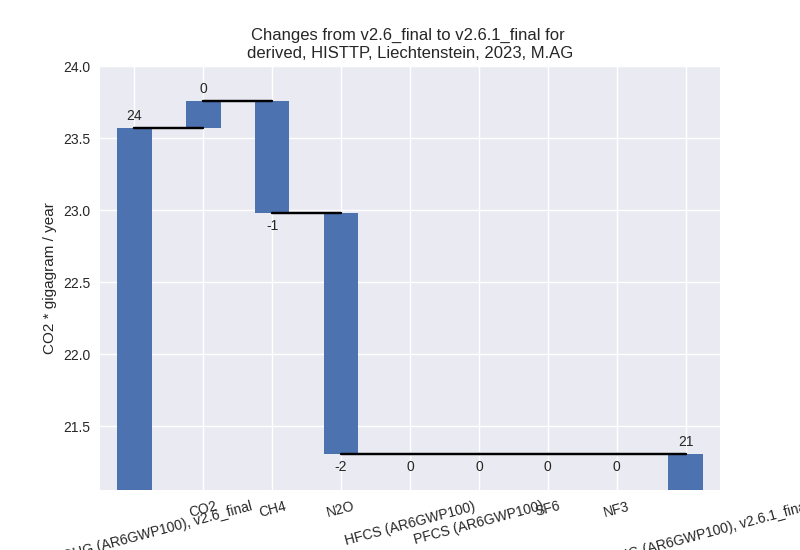
- M.AG: Total sectoral emissions in 2022 are 21.20 Gg
CO2 / year which is 13.3% of M.0.EL emissions. 2023 Emissions have
changed by -9.6% (-2.26 Gg CO2 /
year). 1990-2023 Emissions have changed by -16.2% (-4.18 Gg CO2 / year). For 2023 the
changes per gas
are:
For 1990-2023 the changes per gas are: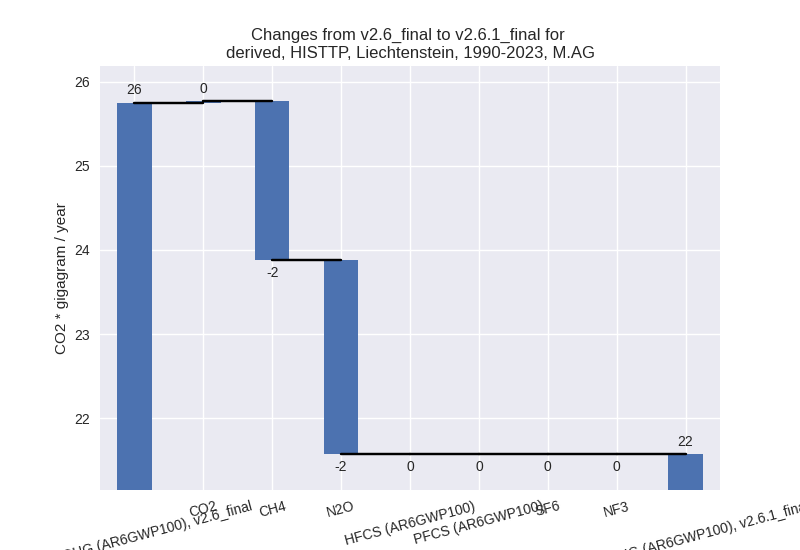
The changes come from the following subsectors:- 3.A: Total sectoral emissions in 2022 are 17.89 Gg
CO2 / year which is 84.4% of category M.AG emissions. 2023 Emissions
have changed by -3.3% (-0.60 Gg CO2
/ year). 1990-2023 Emissions have changed by -9.0% (-1.82 Gg CO2 / year). For 2023 the
changes per gas
are:
For 1990-2023 the changes per gas are: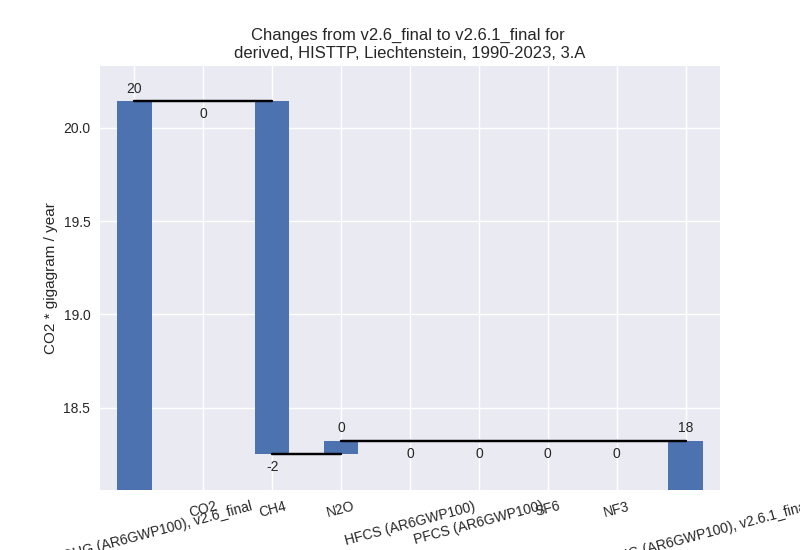
There is no subsector information available in PRIMAP-hist. - M.AG.ELV: Total sectoral emissions in 2022 are 3.31
Gg CO2 / year which is 15.6% of category M.AG emissions. 2023 Emissions
have changed by -32.6% (-1.66 Gg CO2
/ year). 1990-2023 Emissions have changed by -42.0% (-2.36 Gg CO2 / year). For 2023 the
changes per gas
are:
For 1990-2023 the changes per gas are: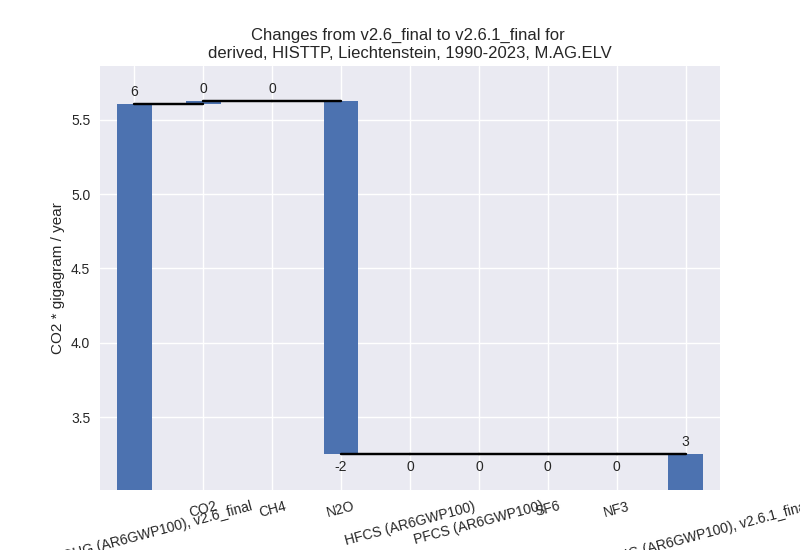
There is no subsector information available in PRIMAP-hist.
- 3.A: Total sectoral emissions in 2022 are 17.89 Gg
CO2 / year which is 84.4% of category M.AG emissions. 2023 Emissions
have changed by -3.3% (-0.60 Gg CO2
/ year). 1990-2023 Emissions have changed by -9.0% (-1.82 Gg CO2 / year). For 2023 the
changes per gas
are:
- 4: Total sectoral emissions in 2022 are 1.86 Gg CO2
/ year which is 1.2% of M.0.EL emissions. 2023 Emissions have changed by
-36.6% (-1.08 Gg CO2 / year).
1990-2023 Emissions have changed by -23.3% (-0.99 Gg CO2 / year). For 2023 the
changes per gas
are:
For 1990-2023 the changes per gas are:
- 5: Total sectoral emissions in 2022 are 0.39 Gg CO2
/ year which is 0.2% of M.0.EL emissions. 2023 Emissions have changed by
-14.2% (-0.06 Gg CO2 / year).
1990-2023 Emissions have changed by -6.4% (-0.05 Gg CO2 / year). For 2023 the
changes per gas
are:

For 1990-2023 the changes per gas are: