Changes in PRIMAP-hist v2.6.1_final compared to v2.6_final for Sri Lanka
2025-03-19
Johannes Gütschow
Change analysis for Sri Lanka for PRIMAP-hist v2.6.1_final compared to v2.6_final
Overview over emissions by sector and gas
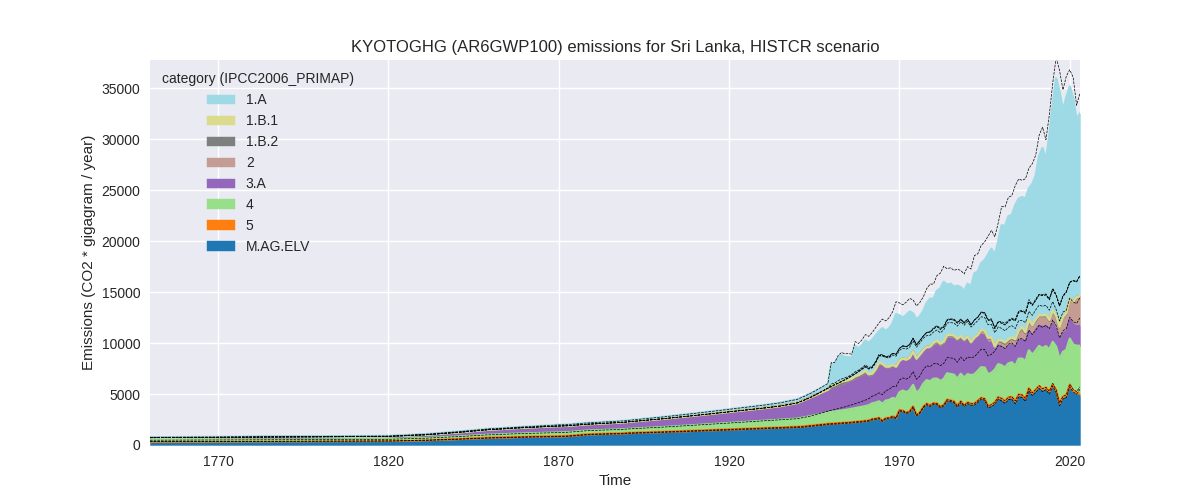
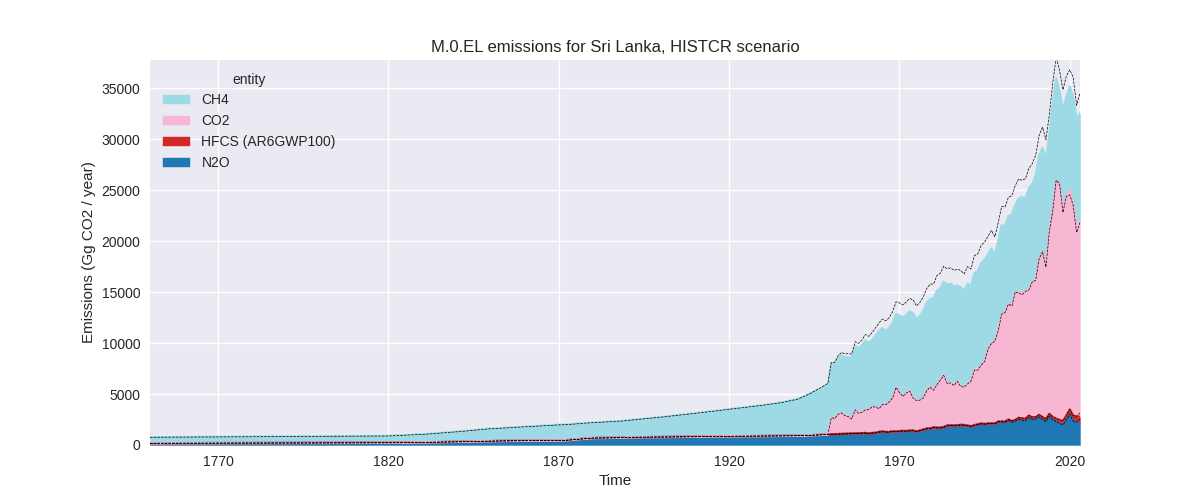
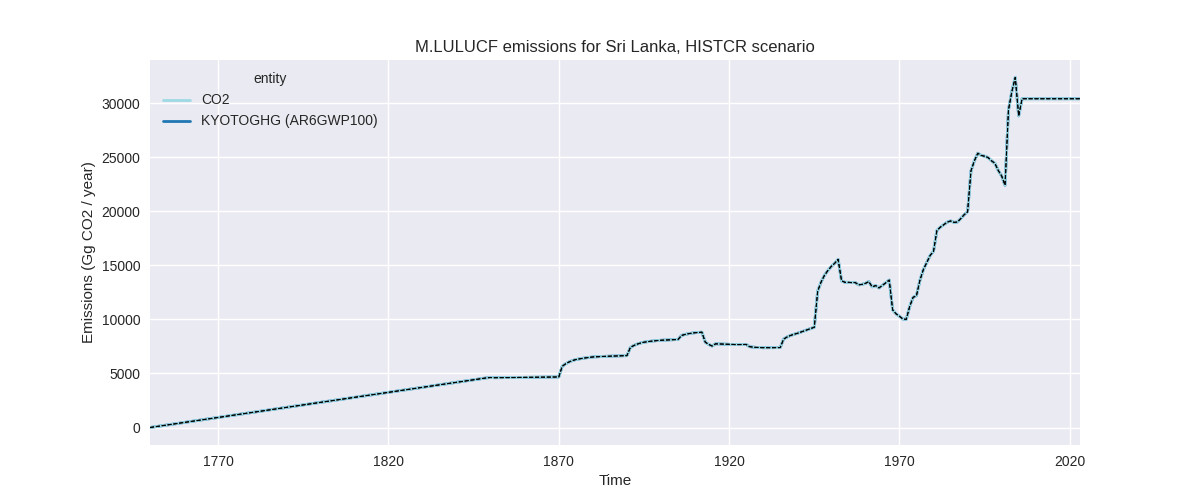
The following figures show the aggregate national total emissions excluding LULUCF AR6GWP100 for the country reported priority scenario. The dotted linesshow the v2.6_final data.
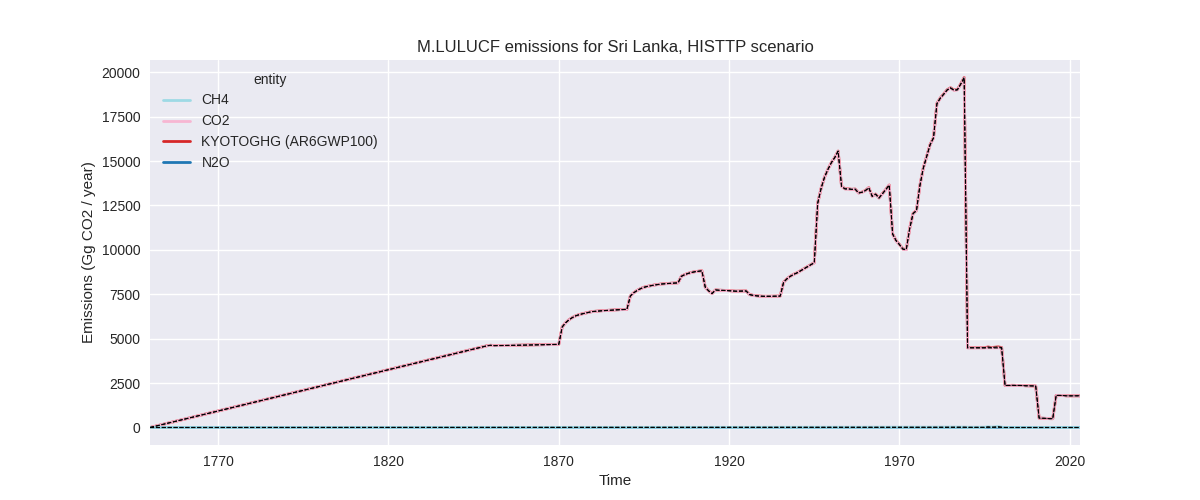
The following figures show the aggregate national total emissions excluding LULUCF AR6GWP100 for the third party priority scenario. The dotted linesshow the v2.6_final data.


Overview over changes
In the country reported priority scenario we have the following changes for aggregate Kyoto GHG and national total emissions excluding LULUCF (M.0.EL):
- Emissions in 2023 have changed by -5.8%% (-2000.07 Gg CO2 / year)
- Emissions in 1990-2023 have changed by -7.0%% (-1899.10 Gg CO2 / year)
In the third party priority scenario we have the following changes for aggregate Kyoto GHG and national total emissions excluding LULUCF (M.0.EL):
- Emissions in 2023 have changed by -5.8%% (-2000.07 Gg CO2 / year)
- Emissions in 1990-2023 have changed by -7.0%% (-1899.10 Gg CO2 / year)
Most important changes per scenario and time frame
In the country reported priority scenario the following sector-gas combinations have the highest absolute impact on national total KyotoGHG (AR6GWP100) emissions in 2023 (top 5):
- 1: 4, CH4 with -2089.94 Gg CO2 / year (-32.1%)
- 2: 2, CO2 with 740.06 Gg CO2 / year (47.6%)
- 3: M.AG.ELV, N2O with -384.27 Gg CO2 / year (-22.9%)
- 4: M.AG.ELV, CO2 with -222.24 Gg CO2 / year (-61.9%)
- 5: 1.A, N2O with 39.48 Gg CO2 / year (12.4%)
In the country reported priority scenario the following sector-gas combinations have the highest absolute impact on national total KyotoGHG (AR6GWP100) emissions in 1990-2023 (top 5):
- 1: 4, CH4 with -1924.01 Gg CO2 / year (-35.6%)
- 2: 2, CO2 with 62.24 Gg CO2 / year (8.5%)
- 3: 5, N2O with -21.83 Gg CO2 / year (-9.3%)
- 4: M.AG.ELV, CO2 with -15.94 Gg CO2 / year (-5.2%)
- 5: 1.B.2, CO2 with 12.52 Gg CO2 / year (968552.3%)
In the third party priority scenario the following sector-gas combinations have the highest absolute impact on national total KyotoGHG (AR6GWP100) emissions in 2023 (top 5):
- 1: 4, CH4 with -2089.94 Gg CO2 / year (-32.1%)
- 2: 2, CO2 with 740.06 Gg CO2 / year (47.6%)
- 3: M.AG.ELV, N2O with -384.27 Gg CO2 / year (-22.9%)
- 4: M.AG.ELV, CO2 with -222.24 Gg CO2 / year (-61.9%)
- 5: 1.A, N2O with 39.48 Gg CO2 / year (12.4%)
In the third party priority scenario the following sector-gas combinations have the highest absolute impact on national total KyotoGHG (AR6GWP100) emissions in 1990-2023 (top 5):
- 1: 4, CH4 with -1924.01 Gg CO2 / year (-35.6%)
- 2: 2, CO2 with 62.24 Gg CO2 / year (8.5%)
- 3: 5, N2O with -21.83 Gg CO2 / year (-9.3%)
- 4: M.AG.ELV, CO2 with -15.94 Gg CO2 / year (-5.2%)
- 5: 1.B.2, CO2 with 12.52 Gg CO2 / year (968552.3%)
Notes on data changes
Here we list notes explaining important emissions changes for the country.
- There is no usable country reported data for Sri Lanka, thus the CR and TP time-series are identical.
- Changes come directly from EDGAR and FAO data. The FAO data changes are only from adding data for 2022 while EDGAR data has changed for complete time-series.
Changes by sector and gas
For each scenario and time frame the changes are displayed for all individual sectors and all individual gases. In the sector plot we use aggregate Kyoto GHGs in AR6GWP100. In the gas plot we usenational total emissions without LULUCF.
country reported scenario
2023
1990-2023

third party scenario
2023


1990-2023

Detailed changes for the scenarios:
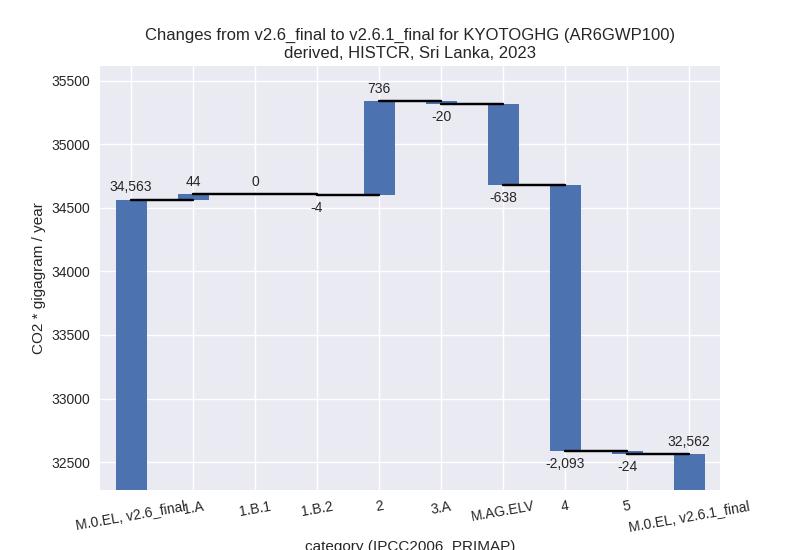
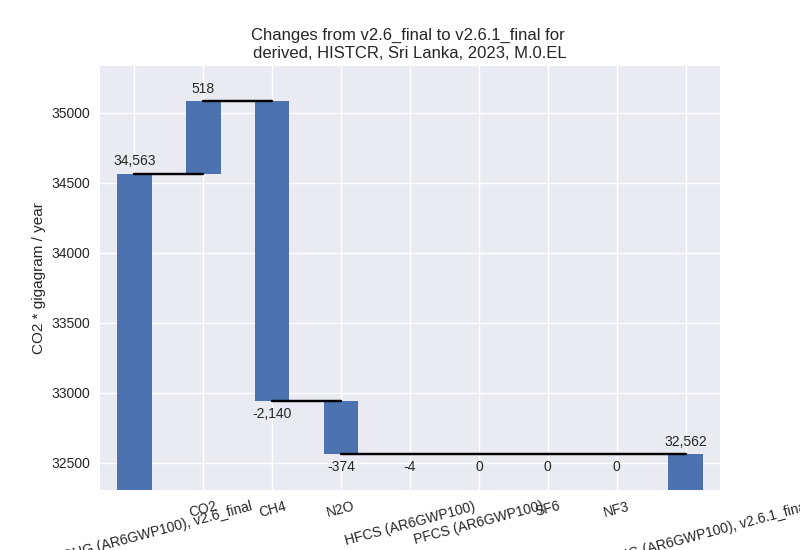
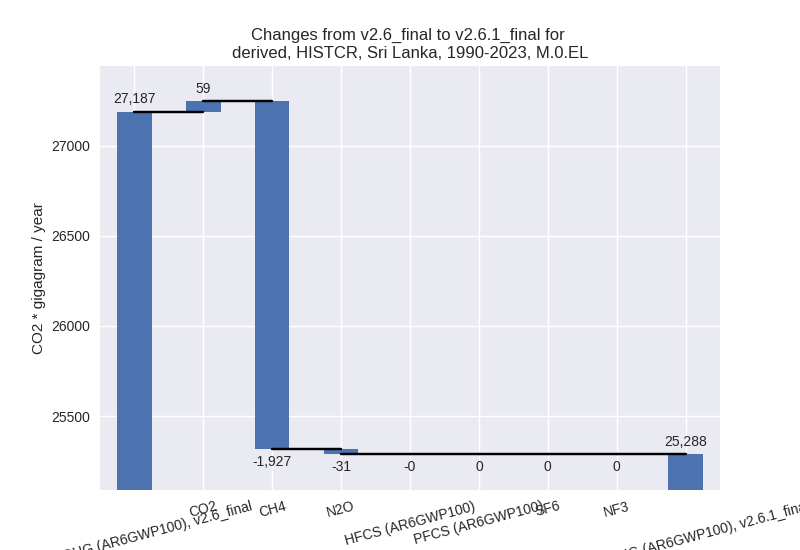
country reported scenario (HISTCR):
Most important changes per time frame
For 2023 the following sector-gas combinations have the highest absolute impact on national total KyotoGHG (AR6GWP100) emissions in 2023 (top 5):
- 1: 4, CH4 with -2089.94 Gg CO2 / year (-32.1%)
- 2: 2, CO2 with 740.06 Gg CO2 / year (47.6%)
- 3: M.AG.ELV, N2O with -384.27 Gg CO2 / year (-22.9%)
- 4: M.AG.ELV, CO2 with -222.24 Gg CO2 / year (-61.9%)
- 5: 1.A, N2O with 39.48 Gg CO2 / year (12.4%)
For 1990-2023 the following sector-gas combinations have the highest absolute impact on national total KyotoGHG (AR6GWP100) emissions in 1990-2023 (top 5):
- 1: 4, CH4 with -1924.01 Gg CO2 / year (-35.6%)
- 2: 2, CO2 with 62.24 Gg CO2 / year (8.5%)
- 3: 5, N2O with -21.83 Gg CO2 / year (-9.3%)
- 4: M.AG.ELV, CO2 with -15.94 Gg CO2 / year (-5.2%)
- 5: 1.B.2, CO2 with 12.52 Gg CO2 / year (968552.3%)
Changes in the main sectors for aggregate KyotoGHG (AR6GWP100) are
- 1: Total sectoral emissions in 2022 are 17363.67 Gg CO2 / year which is 54.5% of M.0.EL emissions. 2023 Emissions have changed by 0.2% (39.65 Gg CO2 / year). 1990-2023 Emissions have changed by 0.1% (15.59 Gg CO2 / year).
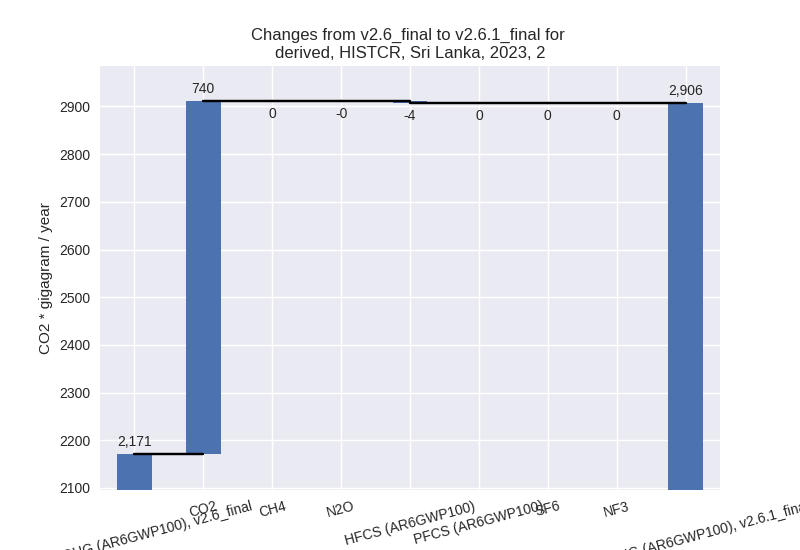
- 2: Total sectoral emissions in 2022 are 2863.40 Gg
CO2 / year which is 9.0% of M.0.EL emissions. 2023 Emissions have
changed by 33.9% (735.56 Gg CO2 /
year). 1990-2023 Emissions have changed by 6.7% (61.92 Gg CO2 / year). For 2023 the
changes per gas
are:
For 1990-2023 the changes per gas are:
- M.AG: Total sectoral emissions in 2022 are 6809.12
Gg CO2 / year which is 21.4% of M.0.EL emissions. 2023 Emissions have
changed by -8.8% (-658.14 Gg CO2 /
year). 1990-2023 Emissions have changed by -0.5% (-30.63 Gg CO2 / year). For 2023 the
changes per gas
are:
The changes come from the following subsectors:- 3.A: Total sectoral emissions in 2022 are 1906.42 Gg CO2 / year which is 28.0% of category M.AG emissions. 2023 Emissions have changed by -1.0% (-20.01 Gg CO2 / year). 1990-2023 Emissions have changed by -0.1% (-1.48 Gg CO2 / year).
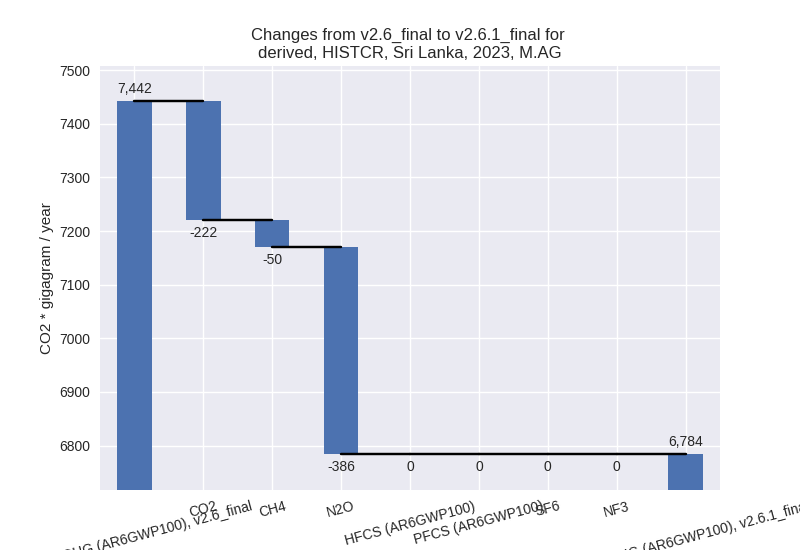
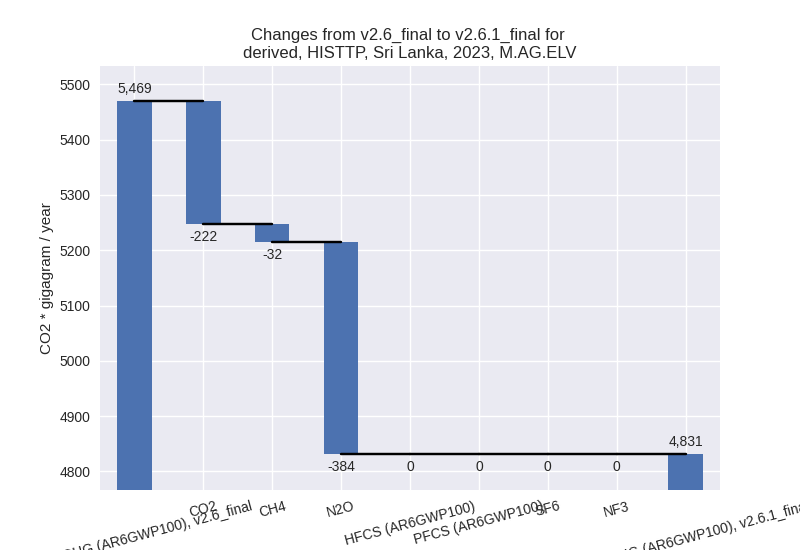
- M.AG.ELV: Total sectoral emissions in 2022 are
4902.69 Gg CO2 / year which is 72.0% of category M.AG emissions. 2023
Emissions have changed by -11.7%
(-638.13 Gg CO2 / year). 1990-2023 Emissions have changed by -0.6% (-29.15 Gg CO2 / year). For 2023 the
changes per gas
are:

There is no subsector information available in PRIMAP-hist.
- 4: Total sectoral emissions in 2022 are 4625.76 Gg
CO2 / year which is 14.5% of M.0.EL emissions. 2023 Emissions have
changed by -30.9% (-2092.78 Gg CO2 /
year). 1990-2023 Emissions have changed by -34.4% (-1924.15 Gg CO2 / year). For 2023
the changes per gas
are:

For 1990-2023 the changes per gas are:
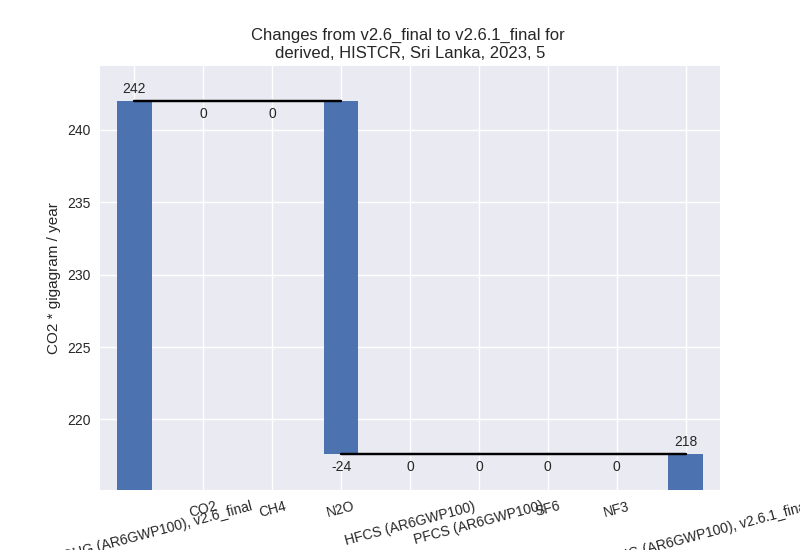
- 5: Total sectoral emissions in 2022 are 212.31 Gg
CO2 / year which is 0.7% of M.0.EL emissions. 2023 Emissions have
changed by -10.1% (-24.37 Gg CO2 /
year). 1990-2023 Emissions have changed by -9.3% (-21.83 Gg CO2 / year). For 2023 the
changes per gas
are:
For 1990-2023 the changes per gas are:
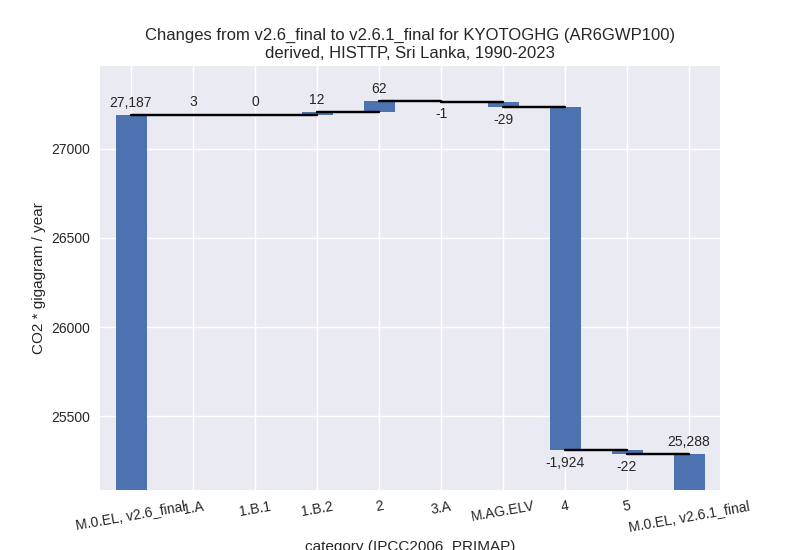
third party scenario (HISTTP):
Most important changes per time frame
For 2023 the following sector-gas combinations have the highest absolute impact on national total KyotoGHG (AR6GWP100) emissions in 2023 (top 5):
- 1: 4, CH4 with -2089.94 Gg CO2 / year (-32.1%)
- 2: 2, CO2 with 740.06 Gg CO2 / year (47.6%)
- 3: M.AG.ELV, N2O with -384.27 Gg CO2 / year (-22.9%)
- 4: M.AG.ELV, CO2 with -222.24 Gg CO2 / year (-61.9%)
- 5: 1.A, N2O with 39.48 Gg CO2 / year (12.4%)
For 1990-2023 the following sector-gas combinations have the highest absolute impact on national total KyotoGHG (AR6GWP100) emissions in 1990-2023 (top 5):
- 1: 4, CH4 with -1924.01 Gg CO2 / year (-35.6%)
- 2: 2, CO2 with 62.24 Gg CO2 / year (8.5%)
- 3: 5, N2O with -21.83 Gg CO2 / year (-9.3%)
- 4: M.AG.ELV, CO2 with -15.94 Gg CO2 / year (-5.2%)
- 5: 1.B.2, CO2 with 12.52 Gg CO2 / year (968552.3%)
Changes in the main sectors for aggregate KyotoGHG (AR6GWP100) are
- 1: Total sectoral emissions in 2022 are 17363.67 Gg CO2 / year which is 54.5% of M.0.EL emissions. 2023 Emissions have changed by 0.2% (39.65 Gg CO2 / year). 1990-2023 Emissions have changed by 0.1% (15.59 Gg CO2 / year).
- 2: Total sectoral emissions in 2022 are 2863.40 Gg
CO2 / year which is 9.0% of M.0.EL emissions. 2023 Emissions have
changed by 33.9% (735.56 Gg CO2 /
year). 1990-2023 Emissions have changed by 6.7% (61.92 Gg CO2 / year). For 2023 the
changes per gas
are:

For 1990-2023 the changes per gas are: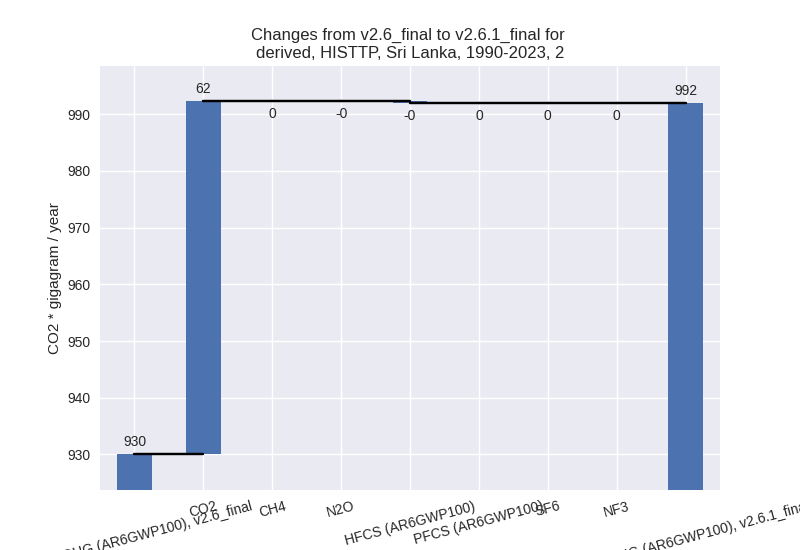
- M.AG: Total sectoral emissions in 2022 are 6809.12
Gg CO2 / year which is 21.4% of M.0.EL emissions. 2023 Emissions have
changed by -8.8% (-658.14 Gg CO2 /
year). 1990-2023 Emissions have changed by -0.5% (-30.63 Gg CO2 / year). For 2023 the
changes per gas
are:

The changes come from the following subsectors:- 3.A: Total sectoral emissions in 2022 are 1906.42 Gg CO2 / year which is 28.0% of category M.AG emissions. 2023 Emissions have changed by -1.0% (-20.01 Gg CO2 / year). 1990-2023 Emissions have changed by -0.1% (-1.48 Gg CO2 / year).
- M.AG.ELV: Total sectoral emissions in 2022 are
4902.69 Gg CO2 / year which is 72.0% of category M.AG emissions. 2023
Emissions have changed by -11.7%
(-638.13 Gg CO2 / year). 1990-2023 Emissions have changed by -0.6% (-29.15 Gg CO2 / year). For 2023 the
changes per gas
are:
There is no subsector information available in PRIMAP-hist.
- 4: Total sectoral emissions in 2022 are 4625.76 Gg
CO2 / year which is 14.5% of M.0.EL emissions. 2023 Emissions have
changed by -30.9% (-2092.78 Gg CO2 /
year). 1990-2023 Emissions have changed by -34.4% (-1924.15 Gg CO2 / year). For 2023
the changes per gas
are:

For 1990-2023 the changes per gas are: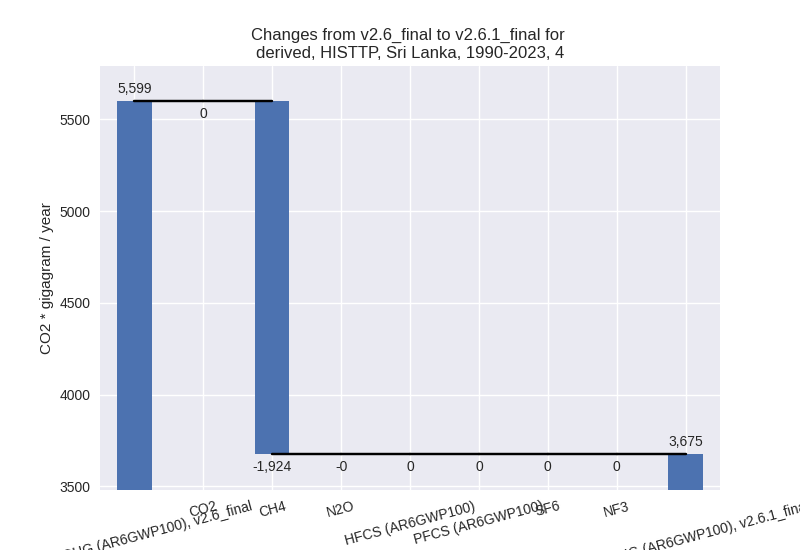
- 5: Total sectoral emissions in 2022 are 212.31 Gg
CO2 / year which is 0.7% of M.0.EL emissions. 2023 Emissions have
changed by -10.1% (-24.37 Gg CO2 /
year). 1990-2023 Emissions have changed by -9.3% (-21.83 Gg CO2 / year). For 2023 the
changes per gas
are:

For 1990-2023 the changes per gas are: