Changes in PRIMAP-hist v2.6.1_final compared to v2.6_final for Lesotho
2025-03-19
Johannes Gütschow
Change analysis for Lesotho for PRIMAP-hist v2.6.1_final compared to v2.6_final
Overview over emissions by sector and gas
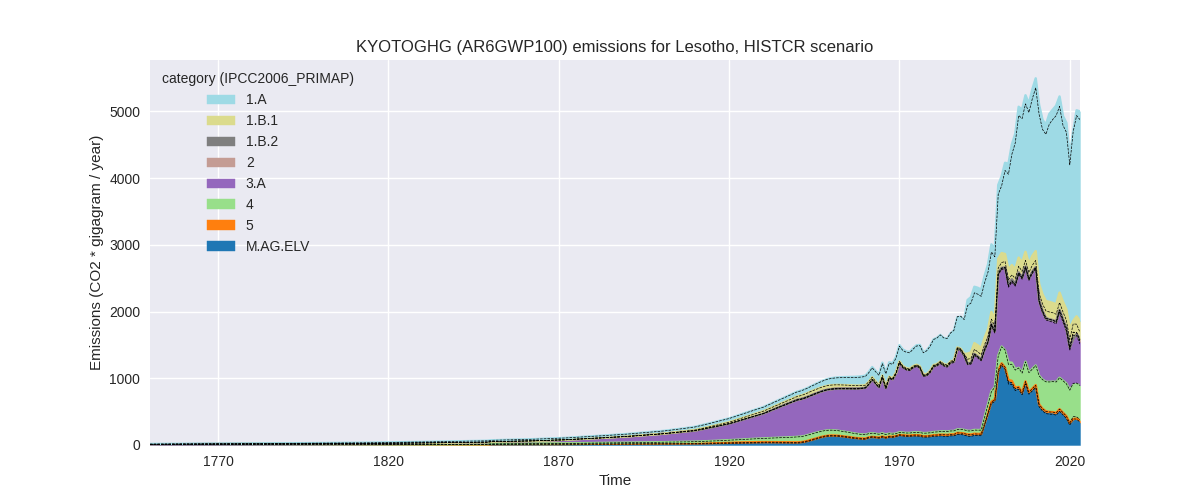
The following figures show the aggregate national total emissions excluding LULUCF AR6GWP100 for the country reported priority scenario. The dotted linesshow the v2.6_final data.
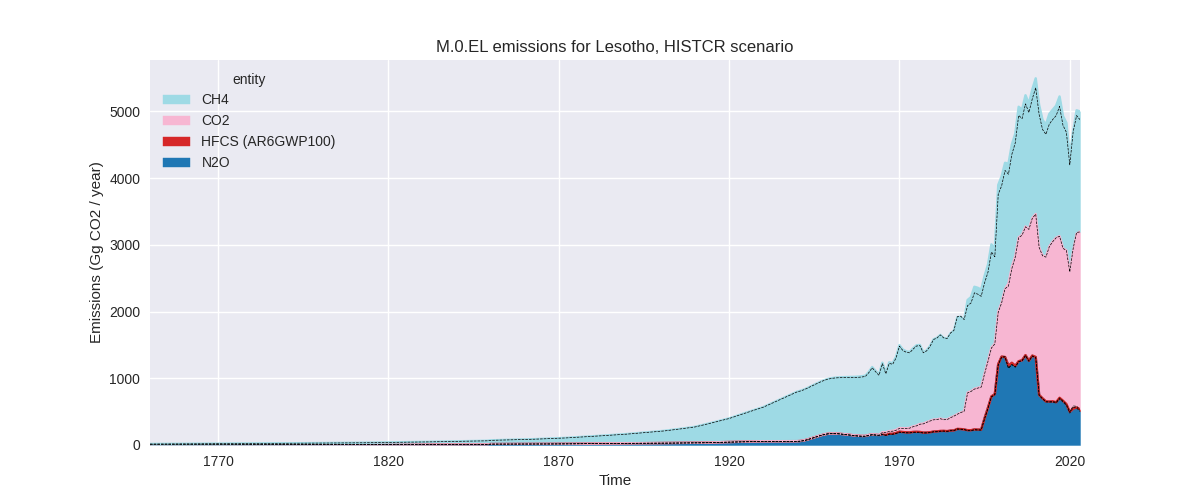
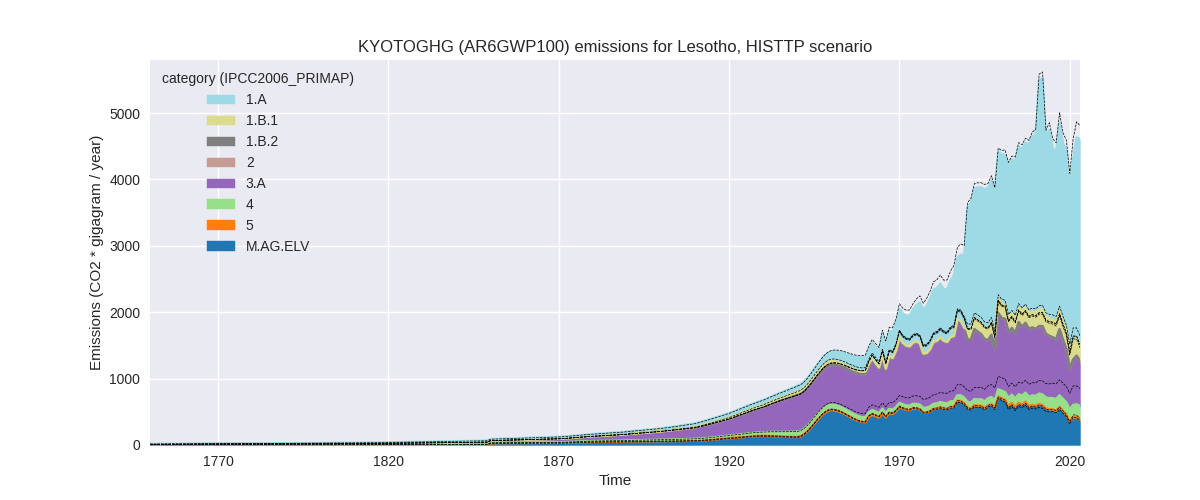
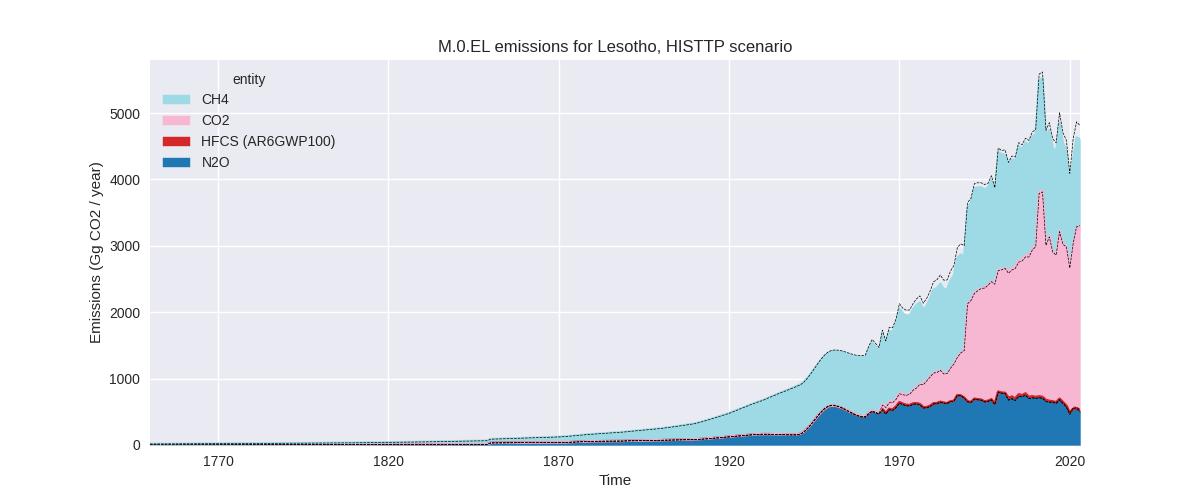
The following figures show the aggregate national total emissions excluding LULUCF AR6GWP100 for the third party priority scenario. The dotted linesshow the v2.6_final data.
Overview over changes
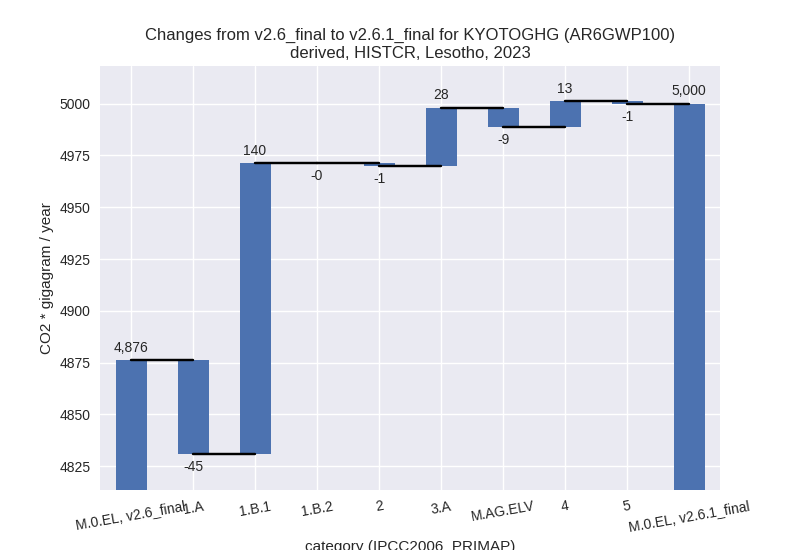
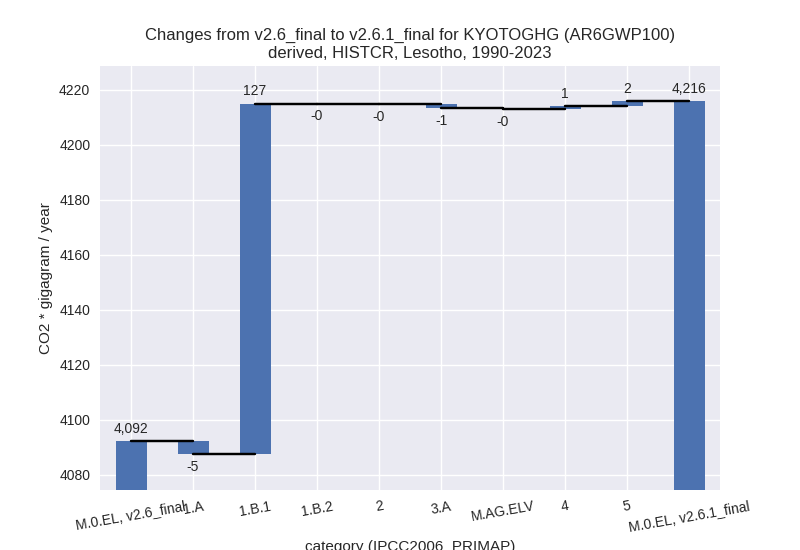
In the country reported priority scenario we have the following changes for aggregate Kyoto GHG and national total emissions excluding LULUCF (M.0.EL):
- Emissions in 2023 have changed by 2.5%% (123.64 Gg CO2 / year)
- Emissions in 1990-2023 have changed by 3.0%% (123.51 Gg CO2 / year)
In the third party priority scenario we have the following changes for aggregate Kyoto GHG and national total emissions excluding LULUCF (M.0.EL):
- Emissions in 2023 have changed by -4.2%% (-201.82 Gg CO2 / year)
- Emissions in 1990-2023 have changed by -2.3%% (-101.03 Gg CO2 / year)
Most important changes per scenario and time frame
In the country reported priority scenario the following sector-gas combinations have the highest absolute impact on national total KyotoGHG (AR6GWP100) emissions in 2023 (top 5):
- 1: 1.B.1, CH4 with 138.53 Gg CO2 / year (109.9%)
- 2: 1.A, CH4 with -44.07 Gg CO2 / year (-9.1%)
- 3: 4, CH4 with 15.31 Gg CO2 / year (3.3%)
- 4: 3.A, CH4 with 14.39 Gg CO2 / year (2.4%)
- 5: 3.A, N2O with 13.72 Gg CO2 / year (47.0%)
In the country reported priority scenario the following sector-gas combinations have the highest absolute impact on national total KyotoGHG (AR6GWP100) emissions in 1990-2023 (top 5):
- 1: 1.B.1, CH4 with 125.75 Gg CO2 / year (131.9%)
- 2: 1.A, CH4 with -4.74 Gg CO2 / year (-1.3%)
- 3: 3.A, CH4 with -1.86 Gg CO2 / year (-0.2%)
- 4: 5, N2O with 1.73 Gg CO2 / year (5.8%)
- 5: 1.B.1, N2O with 1.67 Gg CO2 / year (131.9%)
In the third party priority scenario the following sector-gas combinations have the highest absolute impact on national total KyotoGHG (AR6GWP100) emissions in 2023 (top 5):
- 1: 4, CH4 with -250.16 Gg CO2 / year (-59.9%)
- 2: 1.B.1, CH4 with 138.53 Gg CO2 / year (109.9%)
- 3: 1.A, CH4 with -100.51 Gg CO2 / year (-30.2%)
- 4: 3.A, CH4 with 14.88 Gg CO2 / year (2.4%)
- 5: 1.A, N2O with 6.92 Gg CO2 / year (9.9%)
In the third party priority scenario the following sector-gas combinations have the highest absolute impact on national total KyotoGHG (AR6GWP100) emissions in 1990-2023 (top 5):
- 1: 4, CH4 with -209.76 Gg CO2 / year (-64.7%)
- 2: 1.B.1, CH4 with 125.75 Gg CO2 / year (131.9%)
- 3: 1.A, CH4 with -25.53 Gg CO2 / year (-8.2%)
- 4: M.AG.ELV, N2O with 4.89 Gg CO2 / year (1.0%)
- 5: 1.A, N2O with 2.94 Gg CO2 / year (3.5%)
Notes on data changes
Here we list notes explaining important emissions changes for the country.
- No new country reported data has been included. As country reported
data only covers 1994 - 2017 changes in third party data have a high
influence on the CR time-series.
- The higher CH4 emissions in 1.B.1 come directly from EDGAR as there are no country reported emissions. The lower CH4 emissions in 1.A are due to a decrease in EDGAR emissions growth rates after 2018 (which are used to extrapolate country reported data). Slightly higher 2023 emissions in 3.A come a change post 2020 emissions in FAOSTAT data and an additional year that replaces extrapolated data.
- In the TP scenario the changes are for similar sectors with the addition of a high reduction of waste CH4 emissions.
Changes by sector and gas
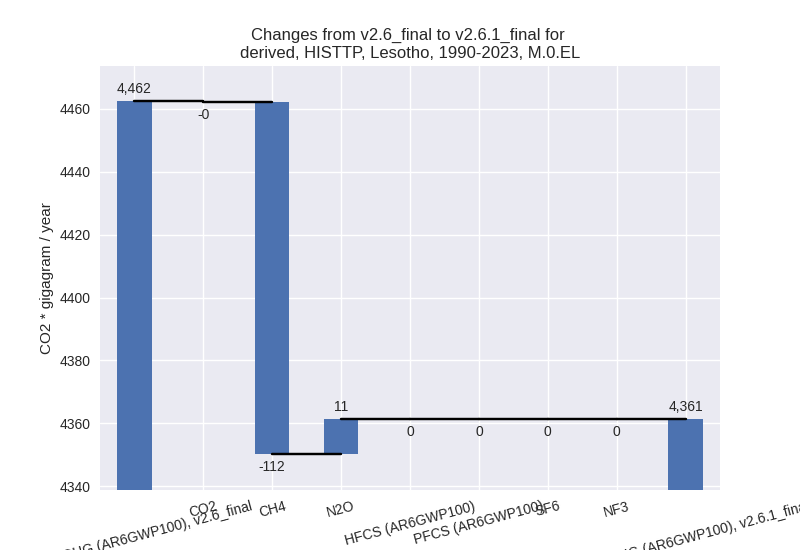
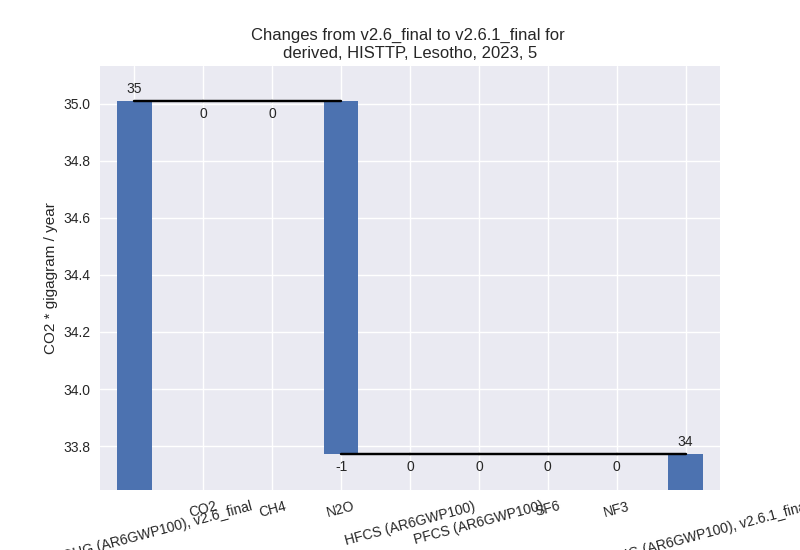
For each scenario and time frame the changes are displayed for all individual sectors and all individual gases. In the sector plot we use aggregate Kyoto GHGs in AR6GWP100. In the gas plot we usenational total emissions without LULUCF.
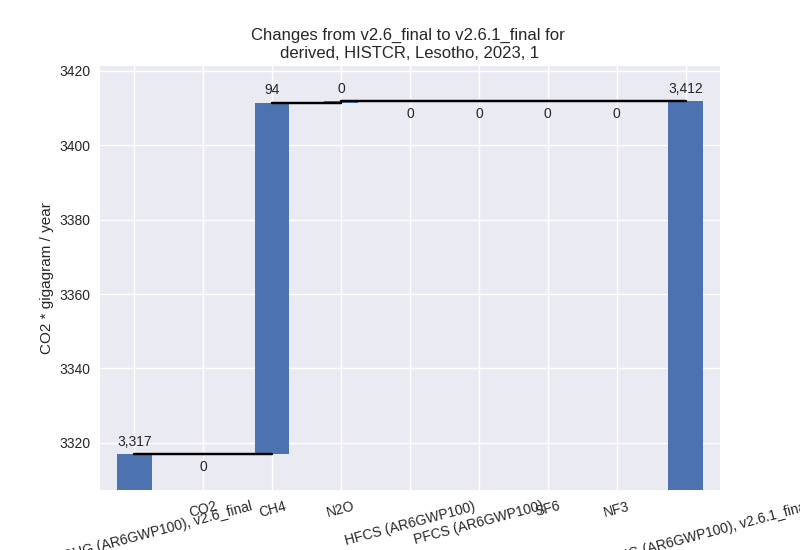
country reported scenario
2023

1990-2023

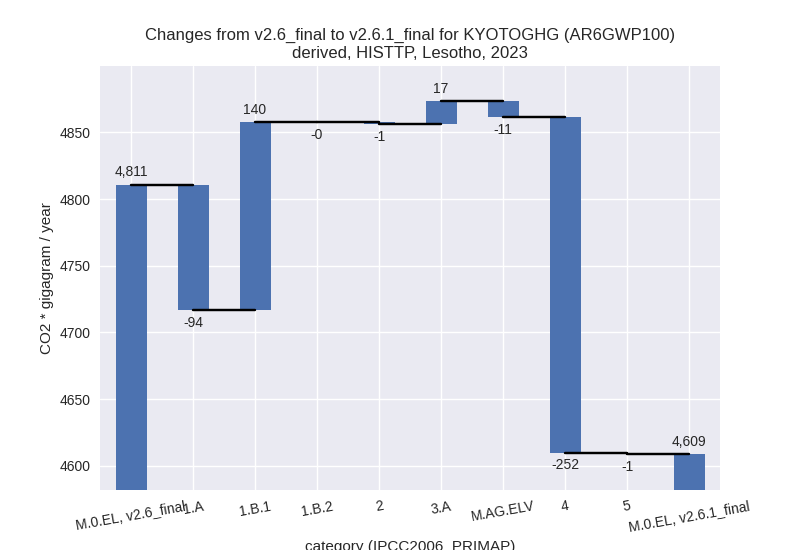
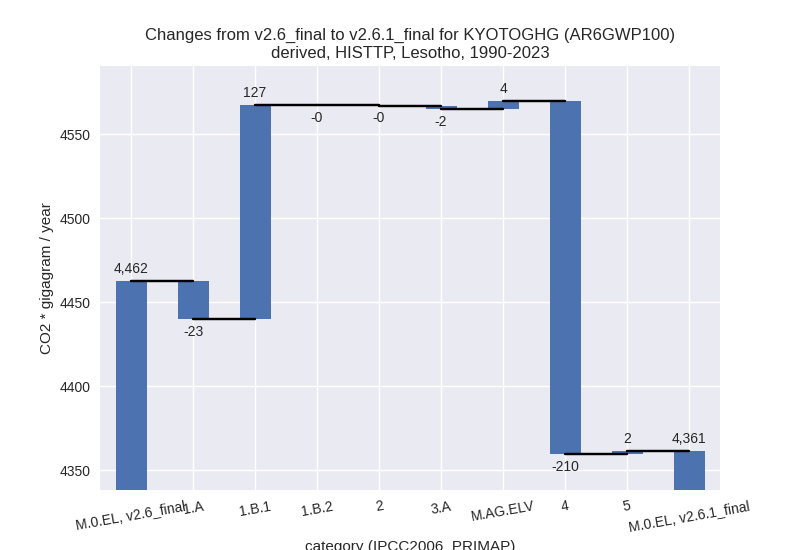
third party scenario
2023

1990-2023
Detailed changes for the scenarios:
country reported scenario (HISTCR):
Most important changes per time frame
For 2023 the following sector-gas combinations have the highest absolute impact on national total KyotoGHG (AR6GWP100) emissions in 2023 (top 5):
- 1: 1.B.1, CH4 with 138.53 Gg CO2 / year (109.9%)
- 2: 1.A, CH4 with -44.07 Gg CO2 / year (-9.1%)
- 3: 4, CH4 with 15.31 Gg CO2 / year (3.3%)
- 4: 3.A, CH4 with 14.39 Gg CO2 / year (2.4%)
- 5: 3.A, N2O with 13.72 Gg CO2 / year (47.0%)
For 1990-2023 the following sector-gas combinations have the highest absolute impact on national total KyotoGHG (AR6GWP100) emissions in 1990-2023 (top 5):
- 1: 1.B.1, CH4 with 125.75 Gg CO2 / year (131.9%)
- 2: 1.A, CH4 with -4.74 Gg CO2 / year (-1.3%)
- 3: 3.A, CH4 with -1.86 Gg CO2 / year (-0.2%)
- 4: 5, N2O with 1.73 Gg CO2 / year (5.8%)
- 5: 1.B.1, N2O with 1.67 Gg CO2 / year (131.9%)
Changes in the main sectors for aggregate KyotoGHG (AR6GWP100) are
- 1: Total sectoral emissions in 2022 are 3356.96 Gg
CO2 / year which is 66.9% of M.0.EL emissions. 2023 Emissions have
changed by 2.9% (94.87 Gg CO2 /
year). 1990-2023 Emissions have changed by 5.8% (122.70 Gg CO2 / year). For 2023 the
changes per gas
are:
For 1990-2023 the changes per gas are: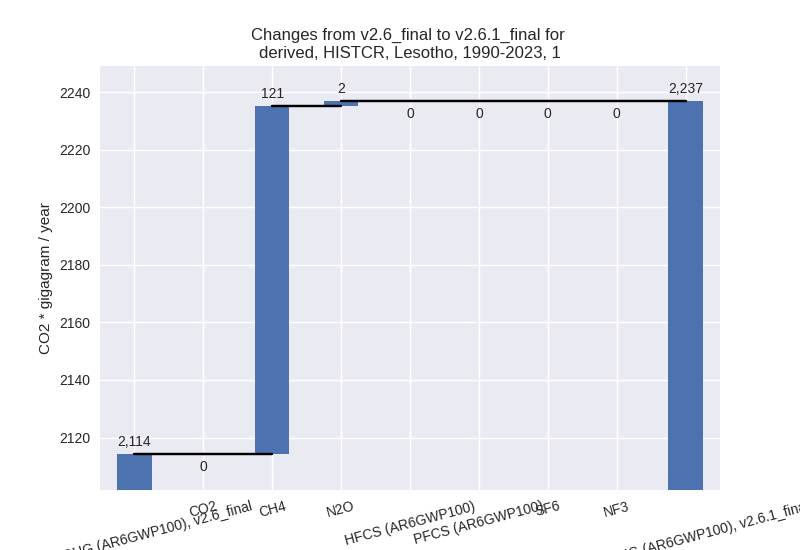
The changes come from the following subsectors:- 1.A: Total sectoral emissions in 2022 are 3088.84 Gg CO2 / year which is 92.0% of category 1 emissions. 2023 Emissions have changed by -1.4% (-45.49 Gg CO2 / year). 1990-2023 Emissions have changed by -0.2% (-4.72 Gg CO2 / year).
- 1.B.1: Total sectoral emissions in 2022 are 268.12
Gg CO2 / year which is 8.0% of category 1 emissions. 2023 Emissions have
changed by 109.9% (140.36 Gg CO2 /
year). 1990-2023 Emissions have changed by 131.9% (127.41 Gg CO2 / year). For 2023
the changes per gas
are:

For 1990-2023 the changes per gas are:
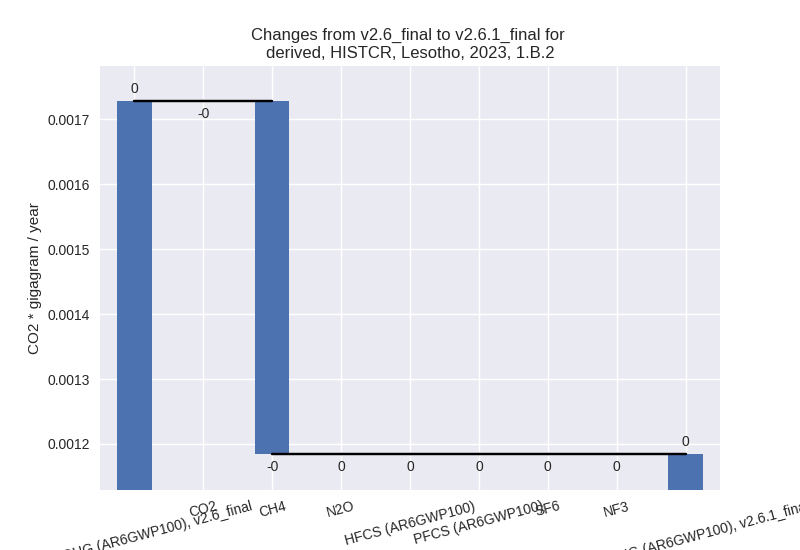
There is no subsector information available in PRIMAP-hist. - 1.B.2: Total sectoral emissions in 2022 are 0.00 Gg
CO2 / year which is 0.0% of category 1 emissions. 2023 Emissions have
changed by -31.5% (-0.00 Gg CO2 /
year). 1990-2023 Emissions have changed by -40.7% (-0.00 Gg CO2 / year). For 2023 the
changes per gas
are:
For 1990-2023 the changes per gas are:
There is no subsector information available in PRIMAP-hist.
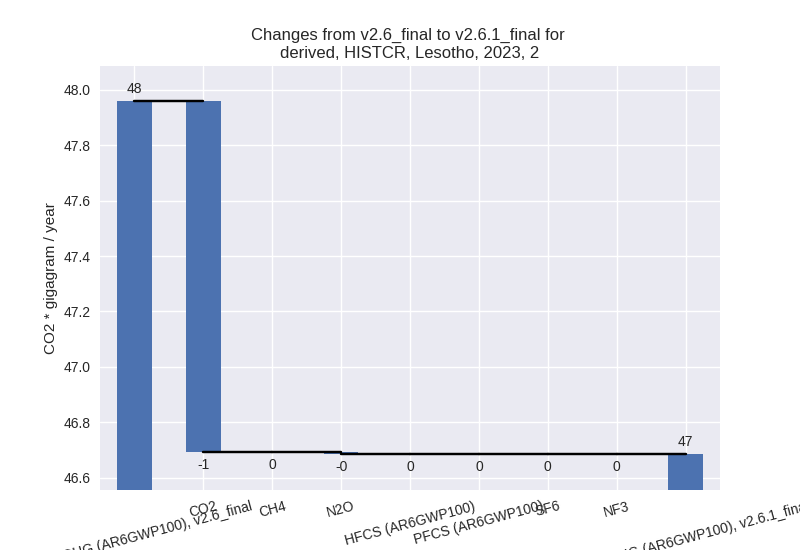
- 2: Total sectoral emissions in 2022 are 44.30 Gg
CO2 / year which is 0.9% of M.0.EL emissions. 2023 Emissions have
changed by -2.7% (-1.27 Gg CO2 /
year). 1990-2023 Emissions have changed by -0.5% (-0.14 Gg CO2 / year). For 2023 the
changes per gas
are:
- M.AG: Total sectoral emissions in 2022 are 1066.23 Gg CO2 / year which is 21.3% of M.0.EL emissions. 2023 Emissions have changed by 1.9% (18.68 Gg CO2 / year). 1990-2023 Emissions have changed by -0.1% (-1.83 Gg CO2 / year).
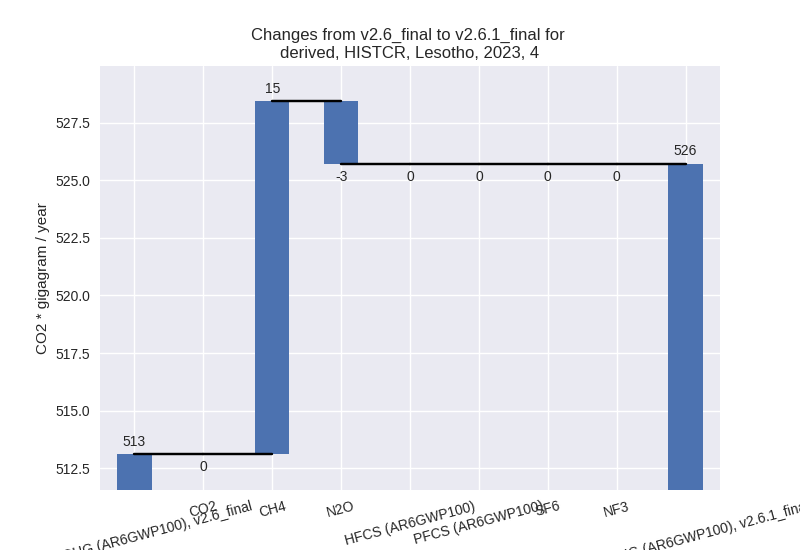
- 4: Total sectoral emissions in 2022 are 516.28 Gg
CO2 / year which is 10.3% of M.0.EL emissions. 2023 Emissions have
changed by 2.5% (12.60 Gg CO2 /
year). 1990-2023 Emissions have changed by 0.3% (1.06 Gg CO2 / year). For 2023 the
changes per gas
are:
- 5: Total sectoral emissions in 2022 are 33.31 Gg
CO2 / year which is 0.7% of M.0.EL emissions. 2023 Emissions have
changed by -3.5% (-1.24 Gg CO2 /
year). 1990-2023 Emissions have changed by 5.8% (1.73 Gg CO2 / year). For 2023 the
changes per gas
are:

For 1990-2023 the changes per gas are: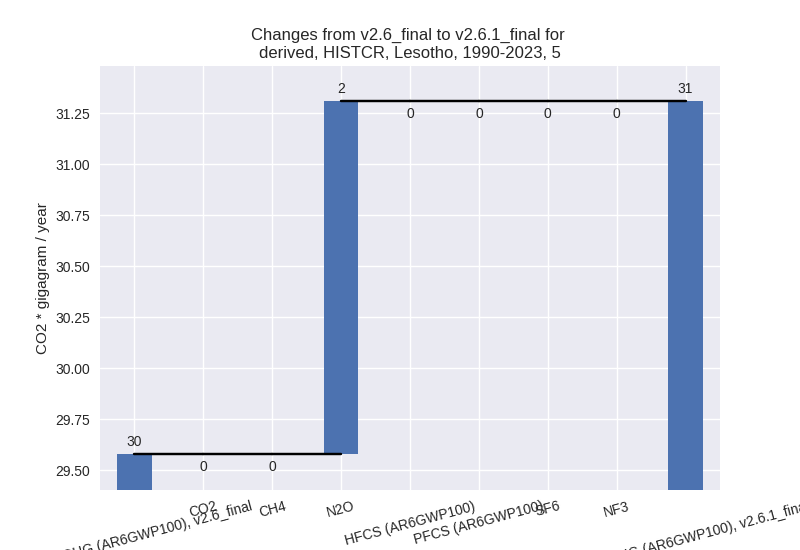
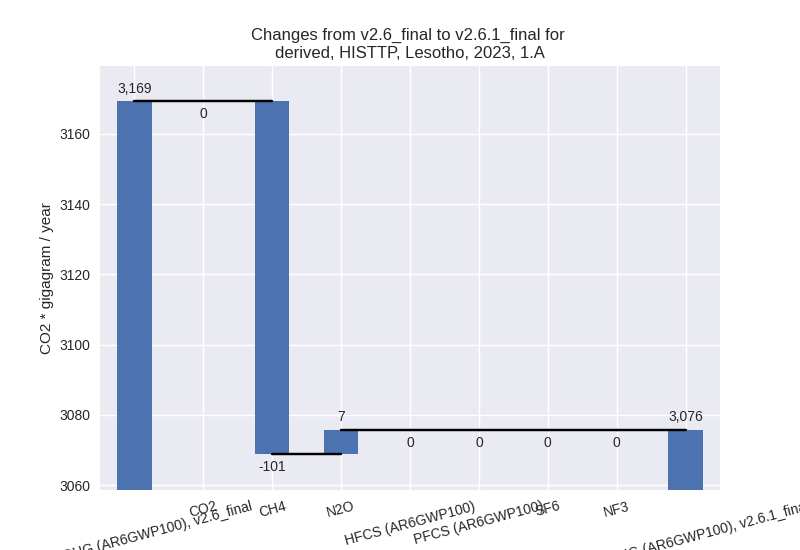
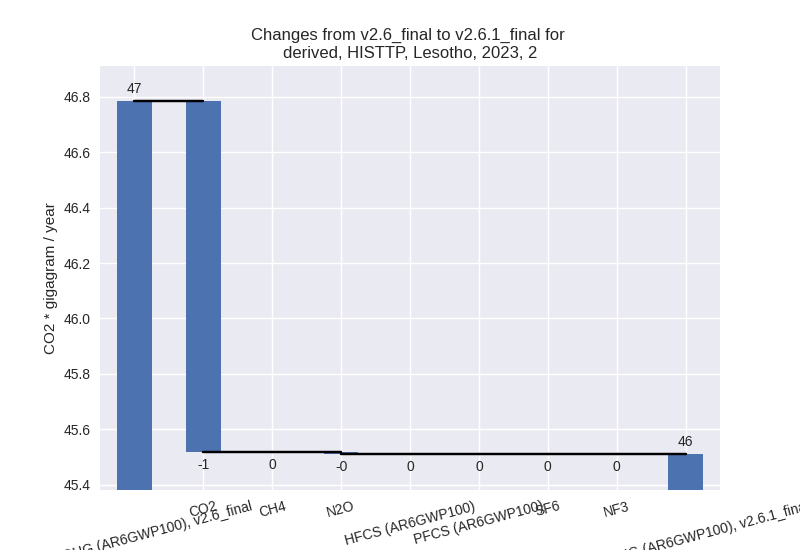
third party scenario (HISTTP):
Most important changes per time frame
For 2023 the following sector-gas combinations have the highest absolute impact on national total KyotoGHG (AR6GWP100) emissions in 2023 (top 5):
- 1: 4, CH4 with -250.16 Gg CO2 / year (-59.9%)
- 2: 1.B.1, CH4 with 138.53 Gg CO2 / year (109.9%)
- 3: 1.A, CH4 with -100.51 Gg CO2 / year (-30.2%)
- 4: 3.A, CH4 with 14.88 Gg CO2 / year (2.4%)
- 5: 1.A, N2O with 6.92 Gg CO2 / year (9.9%)
For 1990-2023 the following sector-gas combinations have the highest absolute impact on national total KyotoGHG (AR6GWP100) emissions in 1990-2023 (top 5):
- 1: 4, CH4 with -209.76 Gg CO2 / year (-64.7%)
- 2: 1.B.1, CH4 with 125.75 Gg CO2 / year (131.9%)
- 3: 1.A, CH4 with -25.53 Gg CO2 / year (-8.2%)
- 4: M.AG.ELV, N2O with 4.89 Gg CO2 / year (1.0%)
- 5: 1.A, N2O with 2.94 Gg CO2 / year (3.5%)
Changes in the main sectors for aggregate KyotoGHG (AR6GWP100) are
- 1: Total sectoral emissions in 2022 are 3285.74 Gg
CO2 / year which is 71.0% of M.0.EL emissions. 2023 Emissions have
changed by 1.4% (46.78 Gg CO2 /
year). 1990-2023 Emissions have changed by 4.0% (104.82 Gg CO2 / year). For 1990-2023
the changes per gas
are:

The changes come from the following subsectors:- 1.A: Total sectoral emissions in 2022 are 3017.62
Gg CO2 / year which is 91.8% of category 1 emissions. 2023 Emissions
have changed by -3.0% (-93.58 Gg CO2
/ year). 1990-2023 Emissions have changed by -0.9% (-22.59 Gg CO2 / year). For 2023 the
changes per gas
are:
There is no subsector information available in PRIMAP-hist. - 1.B.1: Total sectoral emissions in 2022 are 268.12
Gg CO2 / year which is 8.2% of category 1 emissions. 2023 Emissions have
changed by 109.9% (140.36 Gg CO2 /
year). 1990-2023 Emissions have changed by 131.9% (127.41 Gg CO2 / year). For 2023
the changes per gas
are:

For 1990-2023 the changes per gas are:
There is no subsector information available in PRIMAP-hist. - 1.B.2: Total sectoral emissions in 2022 are 0.00 Gg
CO2 / year which is 0.0% of category 1 emissions. 2023 Emissions have
changed by -31.5% (-0.00 Gg CO2 /
year). 1990-2023 Emissions have changed by -40.7% (-0.00 Gg CO2 / year). For 2023 the
changes per gas
are:

For 1990-2023 the changes per gas are:
There is no subsector information available in PRIMAP-hist.
- 1.A: Total sectoral emissions in 2022 are 3017.62
Gg CO2 / year which is 91.8% of category 1 emissions. 2023 Emissions
have changed by -3.0% (-93.58 Gg CO2
/ year). 1990-2023 Emissions have changed by -0.9% (-22.59 Gg CO2 / year). For 2023 the
changes per gas
are:
- 2: Total sectoral emissions in 2022 are 43.14 Gg
CO2 / year which is 0.9% of M.0.EL emissions. 2023 Emissions have
changed by -2.7% (-1.27 Gg CO2 /
year). 1990-2023 Emissions have changed by -0.6% (-0.14 Gg CO2 / year). For 2023 the
changes per gas
are:
- M.AG: Total sectoral emissions in 2022 are 1075.75 Gg CO2 / year which is 23.2% of M.0.EL emissions. 2023 Emissions have changed by 0.6% (5.64 Gg CO2 / year). 1990-2023 Emissions have changed by 0.2% (2.51 Gg CO2 / year).
- 4: Total sectoral emissions in 2022 are 192.98 Gg
CO2 / year which is 4.2% of M.0.EL emissions. 2023 Emissions have
changed by -56.2% (-251.72 Gg CO2 /
year). 1990-2023 Emissions have changed by -60.1% (-209.95 Gg CO2 / year). For 2023
the changes per gas
are:
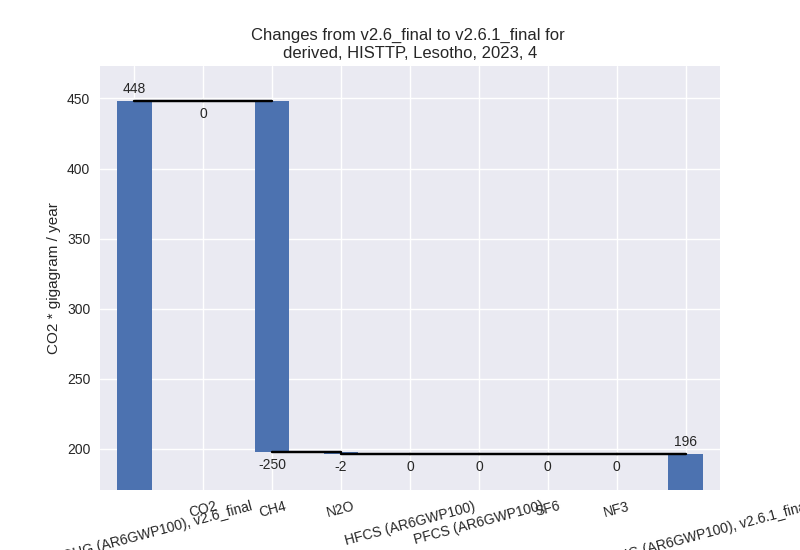
For 1990-2023 the changes per gas are:
- 5: Total sectoral emissions in 2022 are 33.31 Gg
CO2 / year which is 0.7% of M.0.EL emissions. 2023 Emissions have
changed by -3.5% (-1.24 Gg CO2 /
year). 1990-2023 Emissions have changed by 5.8% (1.73 Gg CO2 / year). For 2023 the
changes per gas
are:
For 1990-2023 the changes per gas are: