Changes in PRIMAP-hist v2.6.1_final compared to v2.6_final for Lithuania
2025-03-19
Johannes Gütschow
Change analysis for Lithuania for PRIMAP-hist v2.6.1_final compared to v2.6_final
Overview over emissions by sector and gas
The following figures show the aggregate national total emissions excluding LULUCF AR6GWP100 for the country reported priority scenario. The dotted linesshow the v2.6_final data.
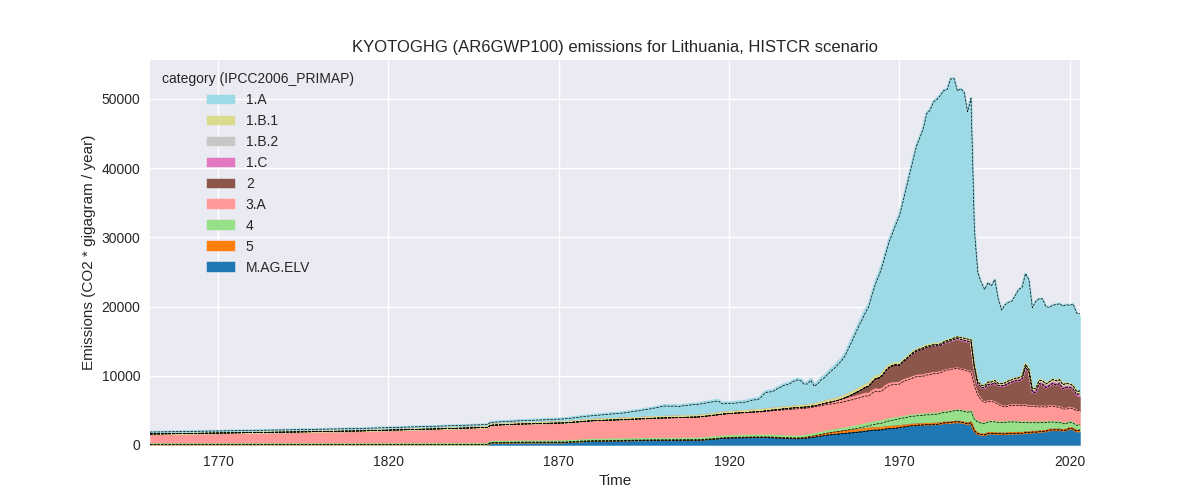
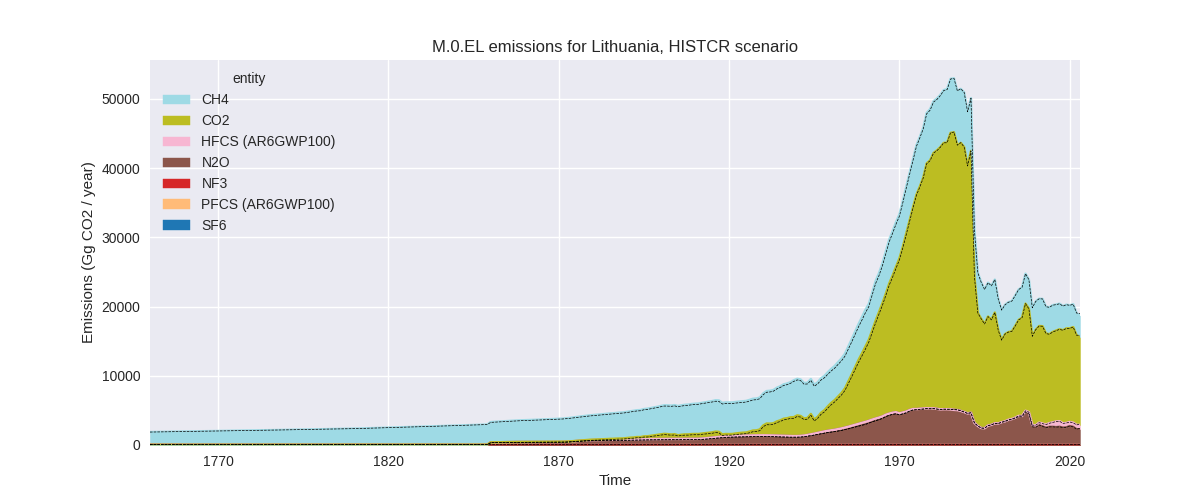
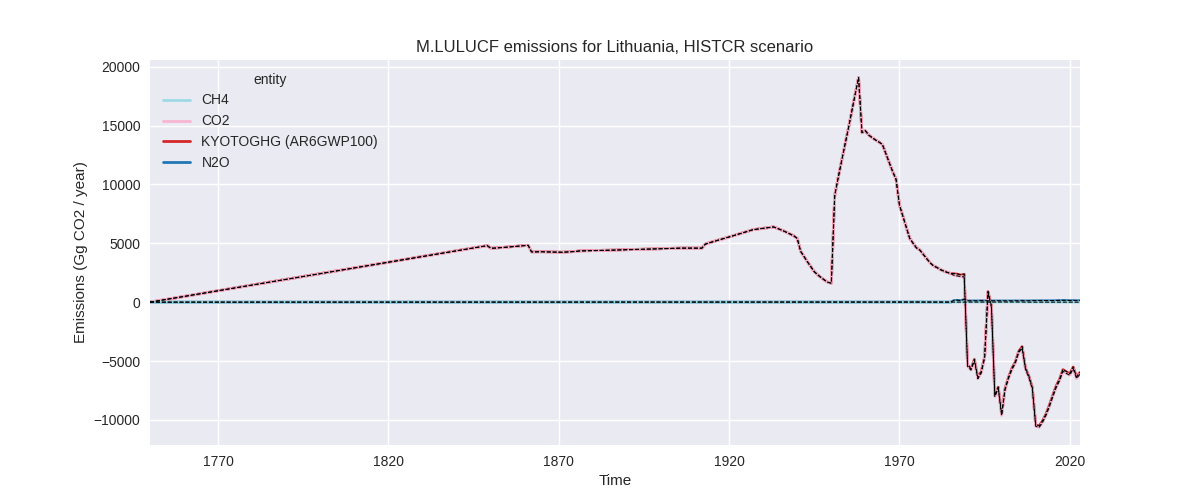
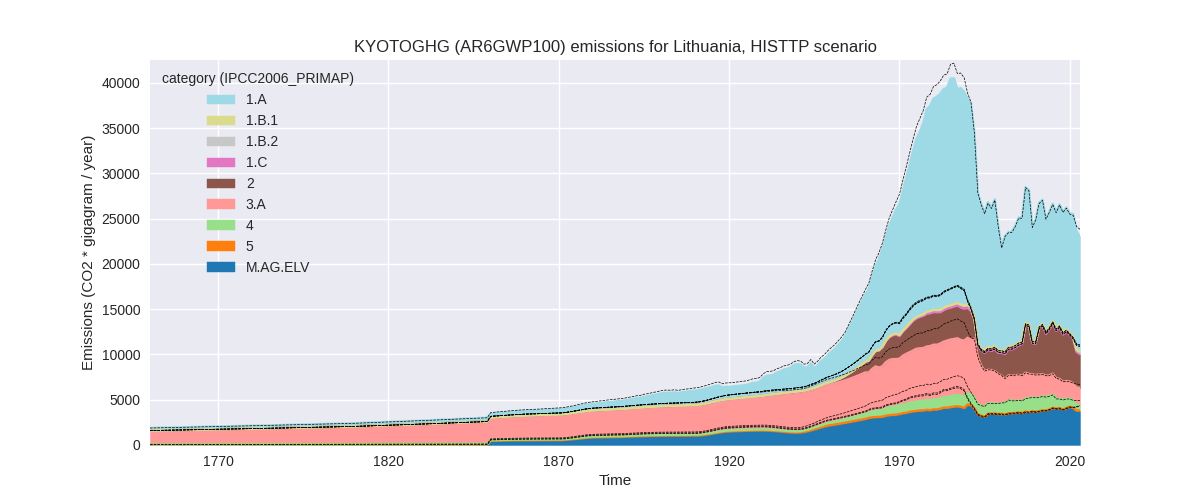
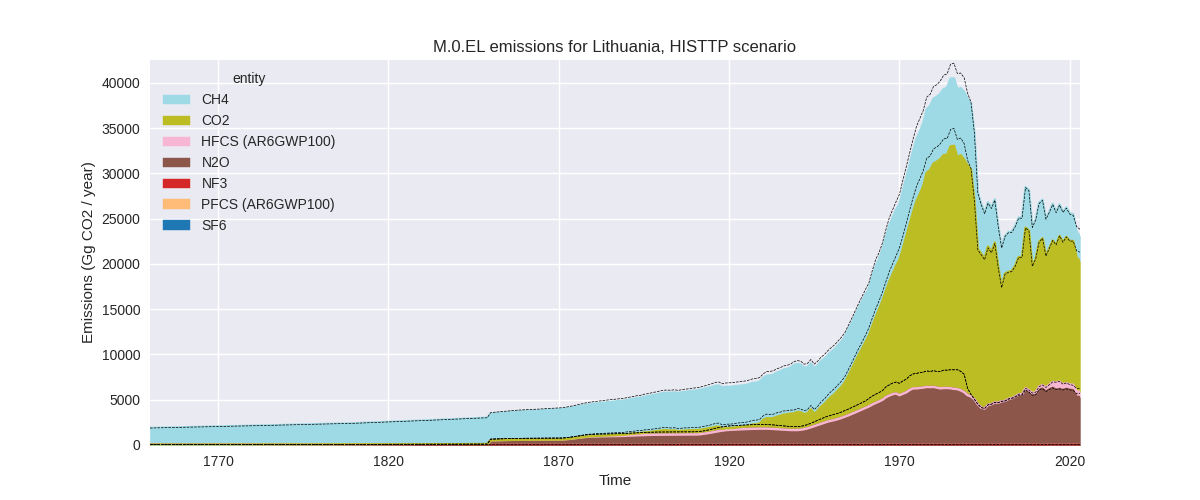
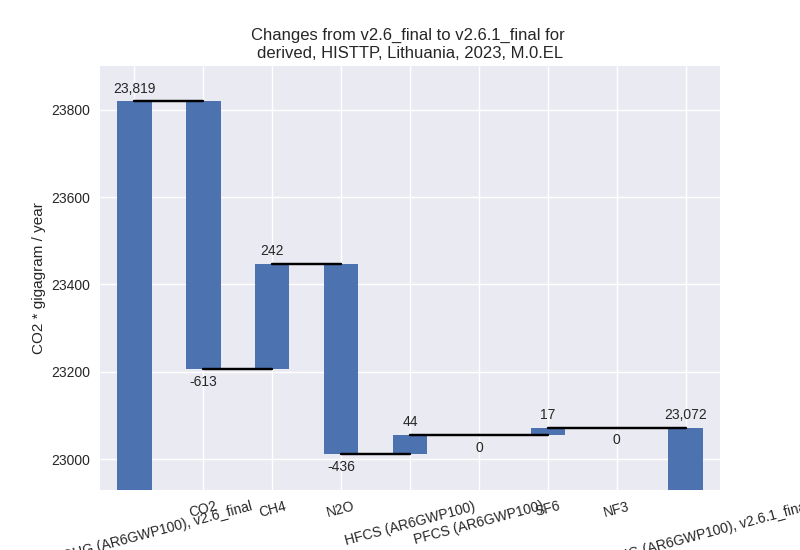
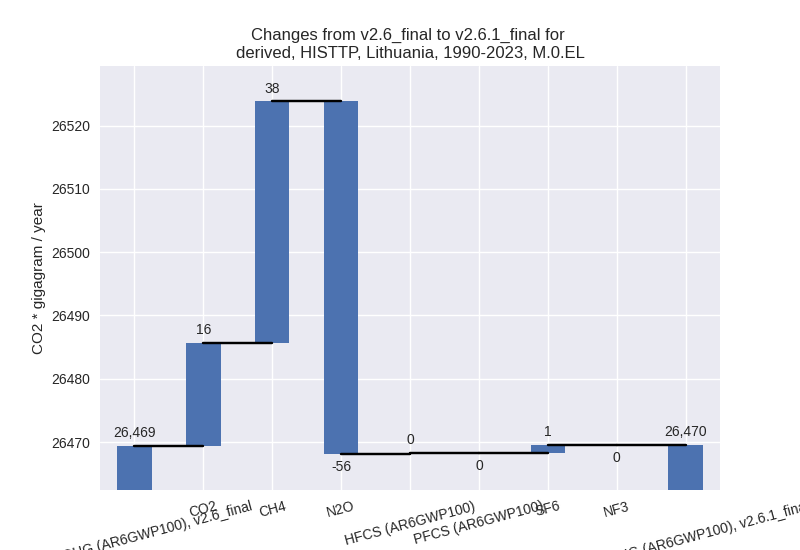
The following figures show the aggregate national total emissions excluding LULUCF AR6GWP100 for the third party priority scenario. The dotted linesshow the v2.6_final data.
Overview over changes
In the country reported priority scenario we have the following changes for aggregate Kyoto GHG and national total emissions excluding LULUCF (M.0.EL):
- Emissions in 2023 have changed by -1.8%% (-337.94 Gg CO2 / year)
- Emissions in 1990-2023 have changed by -0.0%% (-8.24 Gg CO2 / year)
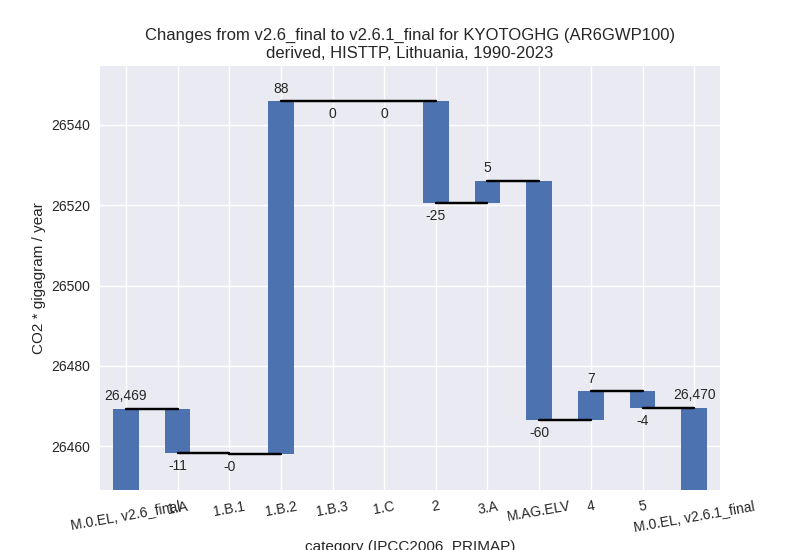
In the third party priority scenario we have the following changes for aggregate Kyoto GHG and national total emissions excluding LULUCF (M.0.EL):
- Emissions in 2023 have changed by -3.1%% (-746.69 Gg CO2 / year)
- Emissions in 1990-2023 have changed by 0.0%% (0.18 Gg CO2 / year)
Most important changes per scenario and time frame
In the country reported priority scenario the following sector-gas combinations have the highest absolute impact on national total KyotoGHG (AR6GWP100) emissions in 2023 (top 5):
- 1: 2, CO2 with -202.47 Gg CO2 / year (-12.1%)
- 2: M.AG.ELV, N2O with -129.43 Gg CO2 / year (-6.3%)
- 3: 4, CH4 with -49.35 Gg CO2 / year (-6.5%)
- 4: 1.B.2, CO2 with 45.11 Gg CO2 / year (21.4%)
- 5: M.AG.ELV, CO2 with -35.28 Gg CO2 / year (-26.7%)
In the country reported priority scenario the following sector-gas combinations have the highest absolute impact on national total KyotoGHG (AR6GWP100) emissions in 1990-2023 (top 5):
- 1: 2, CO2 with -5.95 Gg CO2 / year (-0.3%)
- 2: M.AG.ELV, N2O with -3.81 Gg CO2 / year (-0.2%)
- 3: 2, HFCS (AR6GWP100) with 3.48 Gg CO2 / year (1.3%)
- 4: 2, CH4 with -1.54 Gg CO2 / year (-53.1%)
- 5: 4, CH4 with -1.45 Gg CO2 / year (-0.1%)
In the third party priority scenario the following sector-gas combinations have the highest absolute impact on national total KyotoGHG (AR6GWP100) emissions in 2023 (top 5):
- 1: 2, CO2 with -535.51 Gg CO2 / year (-25.0%)
- 2: M.AG.ELV, N2O with -458.13 Gg CO2 / year (-12.2%)
- 3: 3.A, CH4 with 101.20 Gg CO2 / year (6.1%)
- 4: 1.B.2, CH4 with 94.72 Gg CO2 / year (65.8%)
- 5: M.AG.ELV, CO2 with -83.09 Gg CO2 / year (-16.7%)
In the third party priority scenario the following sector-gas combinations have the highest absolute impact on national total KyotoGHG (AR6GWP100) emissions in 1990-2023 (top 5):
- 1: M.AG.ELV, N2O with -53.09 Gg CO2 / year (-1.6%)
- 2: 1.B.2, CO2 with 49.01 Gg CO2 / year (625.1%)
- 3: 1.B.2, CH4 with 38.76 Gg CO2 / year (24.0%)
- 4: 2, CO2 with -26.52 Gg CO2 / year (-1.4%)
- 5: 1.A, CH4 with -11.77 Gg CO2 / year (-4.5%)
Notes on data changes
Here we list notes explaining important emissions changes for the country.
- CRT data has been included but replaces official data reported to
the EU which does not show noteworthy differences. Changes in the CR
time-series are small and come from updated third party data (EDGAR,
FAO) which is used to extrapolate the country reported data.
- CH4 from chemical industry is 0 post 2008 now because it is reported as NO (not occurring) in BTR1 while it was missing in the EU inventory data used in PRIMAP-hist v2.6 and thus filled from EDGAR.
- The most important change in the TP scenario is that FAO emissions
in M.AG.ELV pre 1990 are much lower than in the last FAOSTAT data
release. They have changed, because the downscaling of the data for the
former USSR has changed due to the different sectoral resolution used in
the processing of the new FAO data.
- The main influences on total 2023 emissions changes in the TP scenario are N2O in M.AG.ELV (from FAO) and CO2 in 2.B (emissions drop in 2022 in EDGAR data)
- Changes in cumulative emissions in the TP scenario are small and due to N2O in M.AG.LEV (from FAO) and fugitive emissions (from EDGAR)
Changes by sector and gas
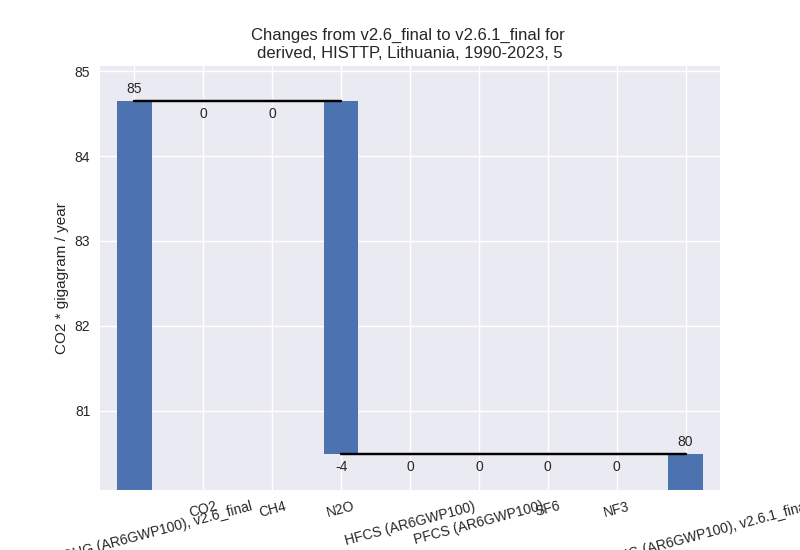
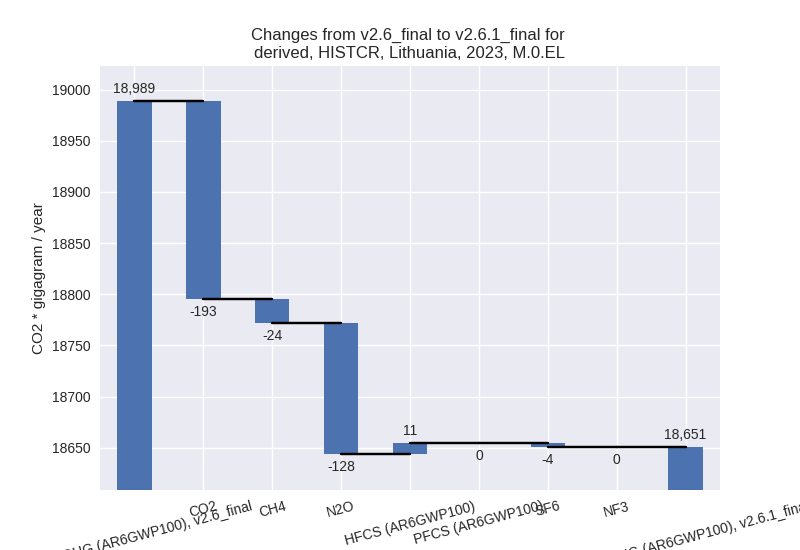
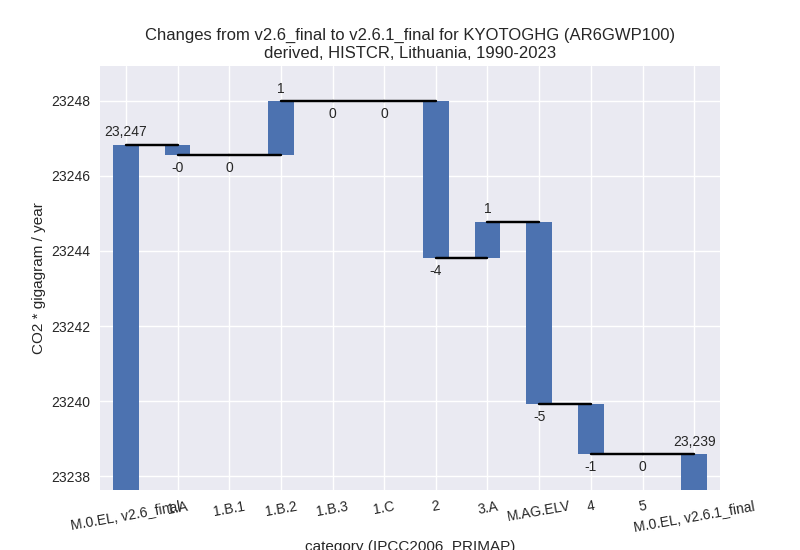
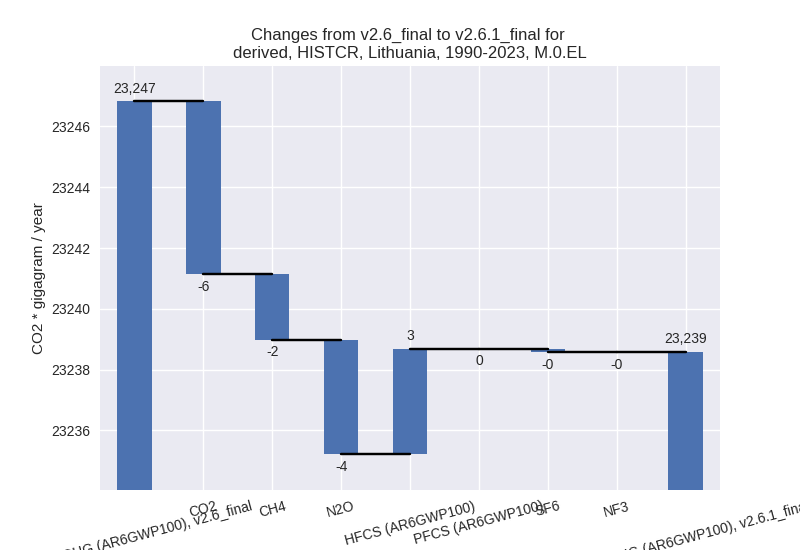
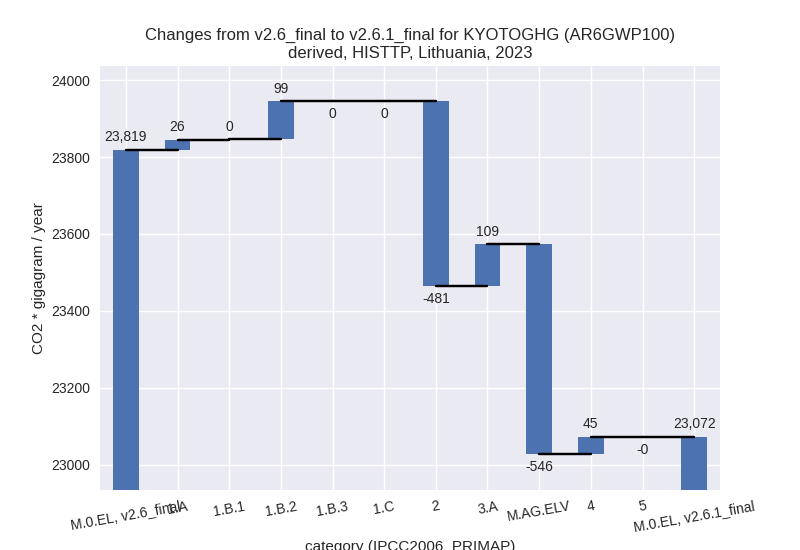
For each scenario and time frame the changes are displayed for all individual sectors and all individual gases. In the sector plot we use aggregate Kyoto GHGs in AR6GWP100. In the gas plot we usenational total emissions without LULUCF.
country reported scenario
2023
1990-2023
third party scenario
2023
1990-2023
Detailed changes for the scenarios:
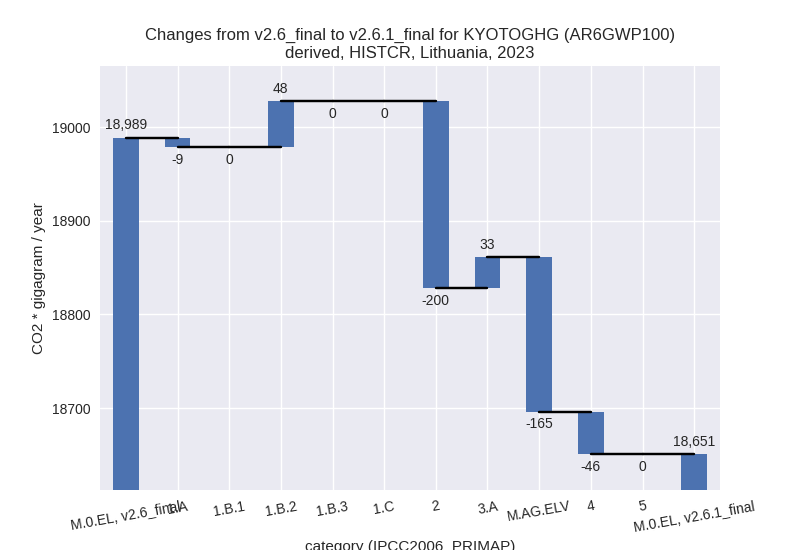
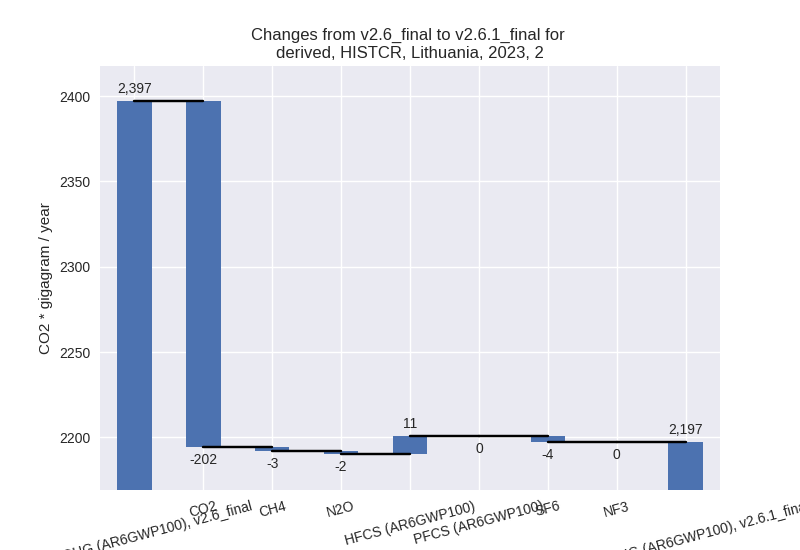
country reported scenario (HISTCR):
Most important changes per time frame
For 2023 the following sector-gas combinations have the highest absolute impact on national total KyotoGHG (AR6GWP100) emissions in 2023 (top 5):
- 1: 2, CO2 with -202.47 Gg CO2 / year (-12.1%)
- 2: M.AG.ELV, N2O with -129.43 Gg CO2 / year (-6.3%)
- 3: 4, CH4 with -49.35 Gg CO2 / year (-6.5%)
- 4: 1.B.2, CO2 with 45.11 Gg CO2 / year (21.4%)
- 5: M.AG.ELV, CO2 with -35.28 Gg CO2 / year (-26.7%)
For 1990-2023 the following sector-gas combinations have the highest absolute impact on national total KyotoGHG (AR6GWP100) emissions in 1990-2023 (top 5):
- 1: 2, CO2 with -5.95 Gg CO2 / year (-0.3%)
- 2: M.AG.ELV, N2O with -3.81 Gg CO2 / year (-0.2%)
- 3: 2, HFCS (AR6GWP100) with 3.48 Gg CO2 / year (1.3%)
- 4: 2, CH4 with -1.54 Gg CO2 / year (-53.1%)
- 5: 4, CH4 with -1.45 Gg CO2 / year (-0.1%)
Changes in the main sectors for aggregate KyotoGHG (AR6GWP100) are
- 1: Total sectoral emissions in 2022 are 11745.45 Gg CO2 / year which is 61.6% of M.0.EL emissions. 2023 Emissions have changed by 0.3% (39.16 Gg CO2 / year). 1990-2023 Emissions have changed by 0.0% (1.15 Gg CO2 / year).
- 2: Total sectoral emissions in 2022 are 2380.23 Gg
CO2 / year which is 12.5% of M.0.EL emissions. 2023 Emissions have
changed by -8.3% (-199.68 Gg CO2 /
year). 1990-2023 Emissions have changed by -0.1% (-4.17 Gg CO2 / year). For 2023 the
changes per gas
are:
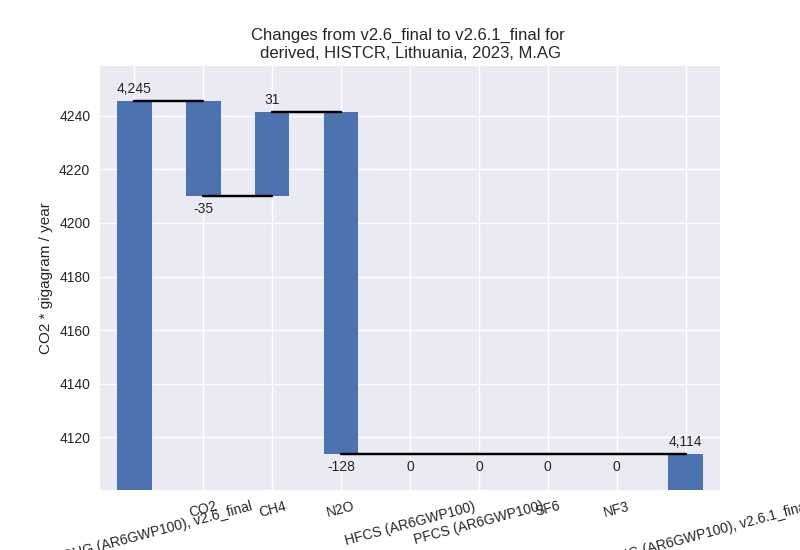
- M.AG: Total sectoral emissions in 2022 are 4109.89
Gg CO2 / year which is 21.6% of M.0.EL emissions. 2023 Emissions have
changed by -3.1% (-131.80 Gg CO2 /
year). 1990-2023 Emissions have changed by -0.1% (-3.88 Gg CO2 / year). For 2023 the
changes per gas
are:
The changes come from the following subsectors:- 3.A: Total sectoral emissions in 2022 are 2109.85 Gg CO2 / year which is 51.3% of category M.AG emissions. 2023 Emissions have changed by 1.6% (32.91 Gg CO2 / year). 1990-2023 Emissions have changed by 0.0% (0.97 Gg CO2 / year).
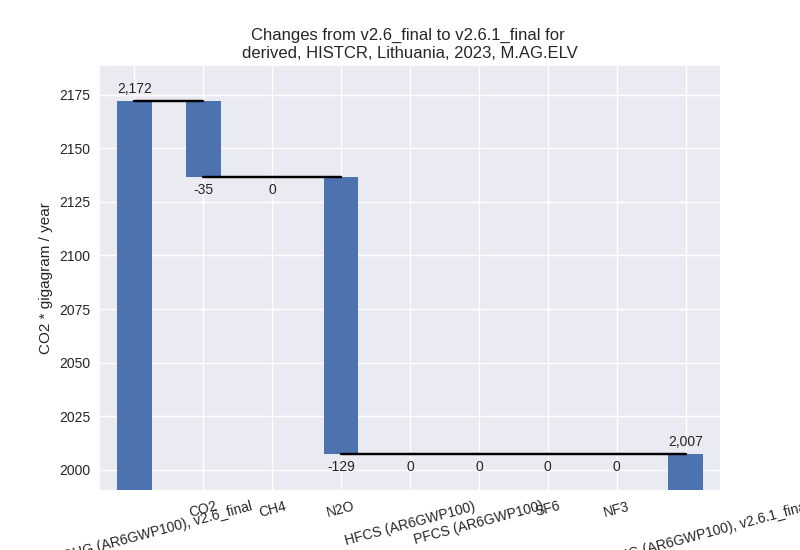
- M.AG.ELV: Total sectoral emissions in 2022 are
2000.04 Gg CO2 / year which is 48.7% of category M.AG emissions. 2023
Emissions have changed by -7.6%
(-164.71 Gg CO2 / year). 1990-2023 Emissions have changed by -0.2% (-4.84 Gg CO2 / year). For 2023 the
changes per gas
are:
There is no subsector information available in PRIMAP-hist.
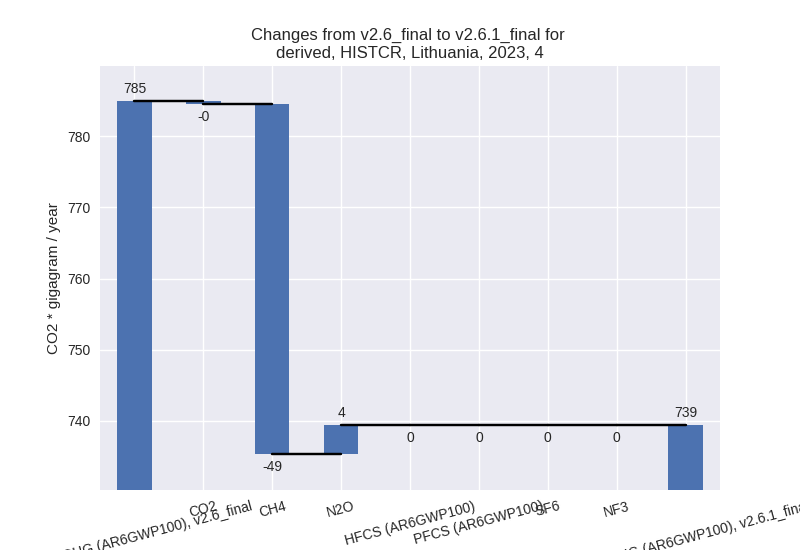
- 4: Total sectoral emissions in 2022 are 818.82 Gg
CO2 / year which is 4.3% of M.0.EL emissions. 2023 Emissions have
changed by -5.8% (-45.62 Gg CO2 /
year). 1990-2023 Emissions have changed by -0.1% (-1.34 Gg CO2 / year). For 2023 the
changes per gas
are:
- 5: No data
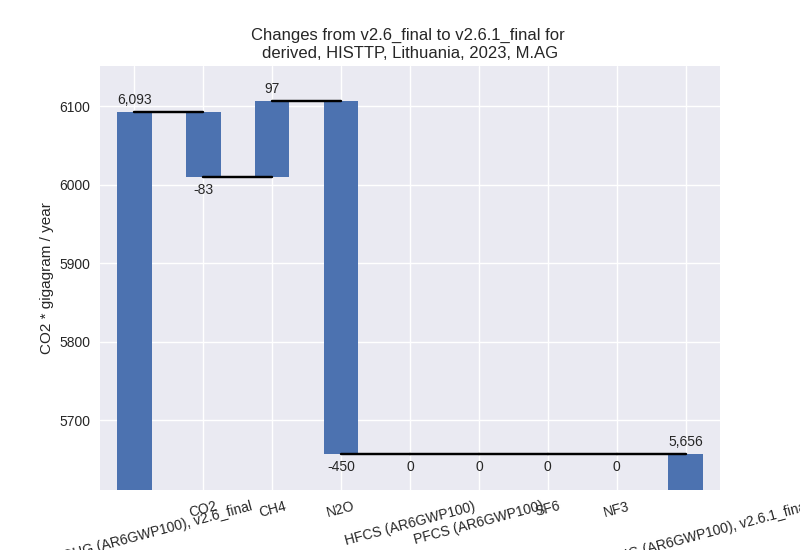
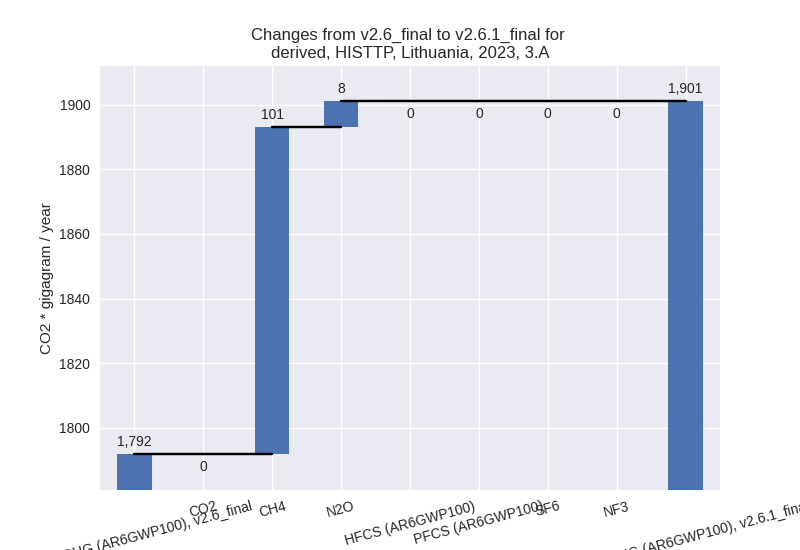
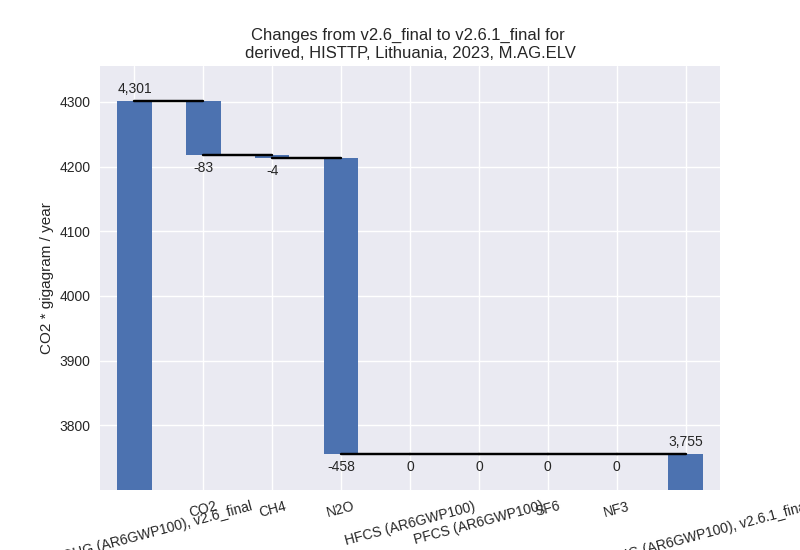
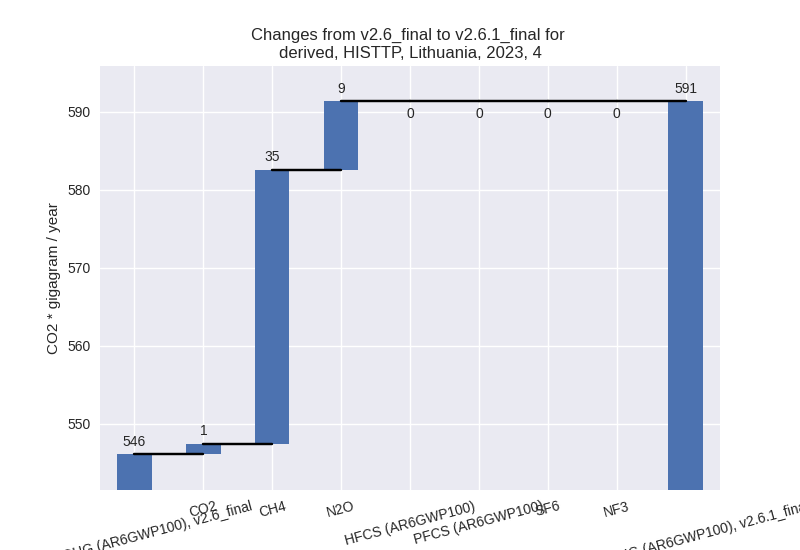
third party scenario (HISTTP):
Most important changes per time frame
For 2023 the following sector-gas combinations have the highest absolute impact on national total KyotoGHG (AR6GWP100) emissions in 2023 (top 5):
- 1: 2, CO2 with -535.51 Gg CO2 / year (-25.0%)
- 2: M.AG.ELV, N2O with -458.13 Gg CO2 / year (-12.2%)
- 3: 3.A, CH4 with 101.20 Gg CO2 / year (6.1%)
- 4: 1.B.2, CH4 with 94.72 Gg CO2 / year (65.8%)
- 5: M.AG.ELV, CO2 with -83.09 Gg CO2 / year (-16.7%)
For 1990-2023 the following sector-gas combinations have the highest absolute impact on national total KyotoGHG (AR6GWP100) emissions in 1990-2023 (top 5):
- 1: M.AG.ELV, N2O with -53.09 Gg CO2 / year (-1.6%)
- 2: 1.B.2, CO2 with 49.01 Gg CO2 / year (625.1%)
- 3: 1.B.2, CH4 with 38.76 Gg CO2 / year (24.0%)
- 4: 2, CO2 with -26.52 Gg CO2 / year (-1.4%)
- 5: 1.A, CH4 with -11.77 Gg CO2 / year (-4.5%)
Changes in the main sectors for aggregate KyotoGHG (AR6GWP100) are
- 1: Total sectoral emissions in 2022 are 13237.30 Gg CO2 / year which is 56.3% of M.0.EL emissions. 2023 Emissions have changed by 1.0% (125.78 Gg CO2 / year). 1990-2023 Emissions have changed by 0.5% (76.43 Gg CO2 / year).
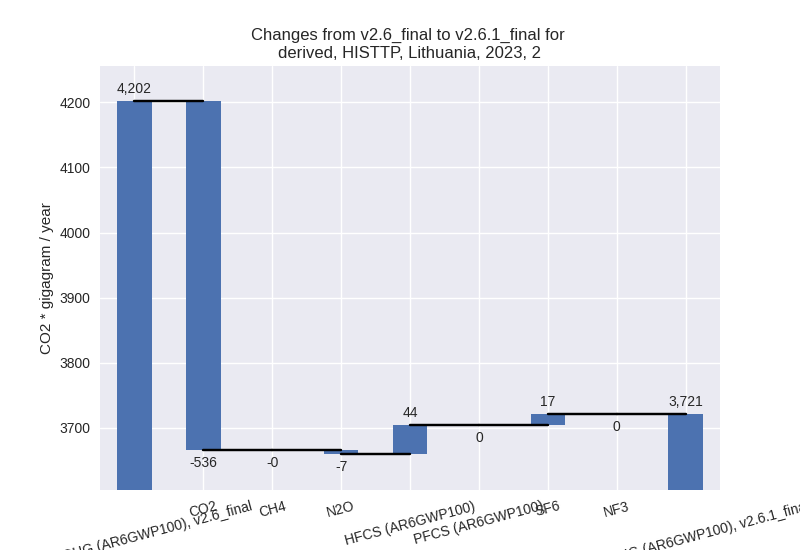
- 2: Total sectoral emissions in 2022 are 3922.76 Gg
CO2 / year which is 16.7% of M.0.EL emissions. 2023 Emissions have
changed by -11.4% (-481.08 Gg CO2 /
year). 1990-2023 Emissions have changed by -0.7% (-25.22 Gg CO2 / year). For 2023 the
changes per gas
are:
- M.AG: Total sectoral emissions in 2022 are 5646.01
Gg CO2 / year which is 24.0% of M.0.EL emissions. 2023 Emissions have
changed by -7.2% (-436.33 Gg CO2 /
year). 1990-2023 Emissions have changed by -0.8% (-54.10 Gg CO2 / year). For 2023 the
changes per gas
are:
The changes come from the following subsectors:- 3.A: Total sectoral emissions in 2022 are 1904.11
Gg CO2 / year which is 33.7% of category M.AG emissions. 2023 Emissions
have changed by 6.1% (109.25 Gg CO2
/ year). 1990-2023 Emissions have changed by 0.2% (5.46 Gg CO2 / year). For 2023 the
changes per gas
are:
There is no subsector information available in PRIMAP-hist. - M.AG.ELV: Total sectoral emissions in 2022 are
3741.89 Gg CO2 / year which is 66.3% of category M.AG emissions. 2023
Emissions have changed by -12.7%
(-545.58 Gg CO2 / year). 1990-2023 Emissions have changed by -1.6% (-59.56 Gg CO2 / year). For 2023 the
changes per gas
are:
There is no subsector information available in PRIMAP-hist.
- 3.A: Total sectoral emissions in 2022 are 1904.11
Gg CO2 / year which is 33.7% of category M.AG emissions. 2023 Emissions
have changed by 6.1% (109.25 Gg CO2
/ year). 1990-2023 Emissions have changed by 0.2% (5.46 Gg CO2 / year). For 2023 the
changes per gas
are:
- 4: Total sectoral emissions in 2022 are 641.64 Gg
CO2 / year which is 2.7% of M.0.EL emissions. 2023 Emissions have
changed by 8.3% (45.30 Gg CO2 /
year). 1990-2023 Emissions have changed by 0.6% (7.22 Gg CO2 / year). For 2023 the
changes per gas
are:
- 5: Total sectoral emissions in 2022 are 56.20 Gg
CO2 / year which is 0.2% of M.0.EL emissions. 2023 Emissions have
changed by -0.7% (-0.36 Gg CO2 /
year). 1990-2023 Emissions have changed by -4.9% (-4.16 Gg CO2 / year). For 1990-2023
the changes per gas
are: