Changes in PRIMAP-hist v2.6.1_final compared to v2.6_final for Latvia
2025-03-19
Johannes Gütschow
Change analysis for Latvia for PRIMAP-hist v2.6.1_final compared to v2.6_final
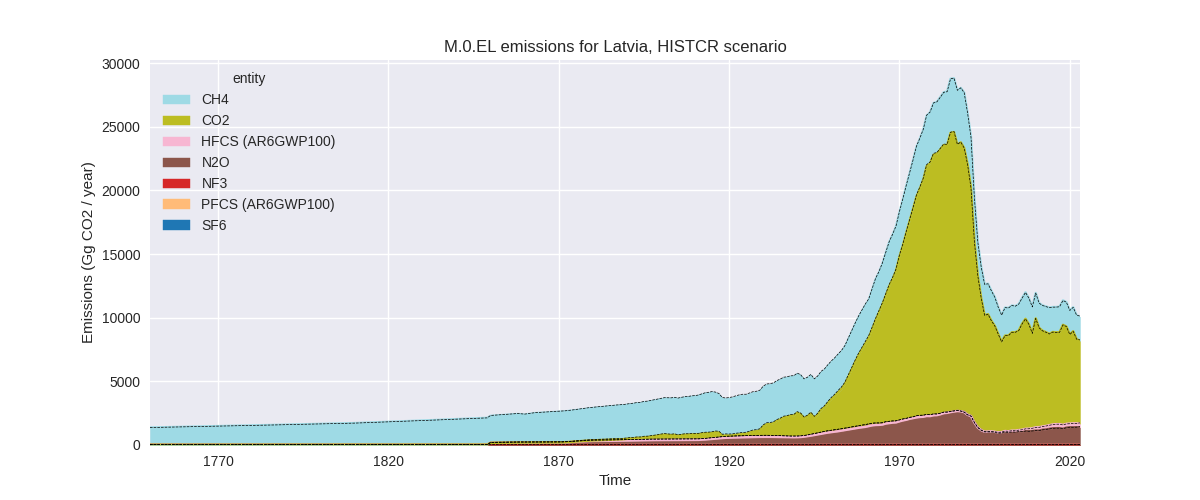
Overview over emissions by sector and gas
The following figures show the aggregate national total emissions excluding LULUCF AR6GWP100 for the country reported priority scenario. The dotted linesshow the v2.6_final data.
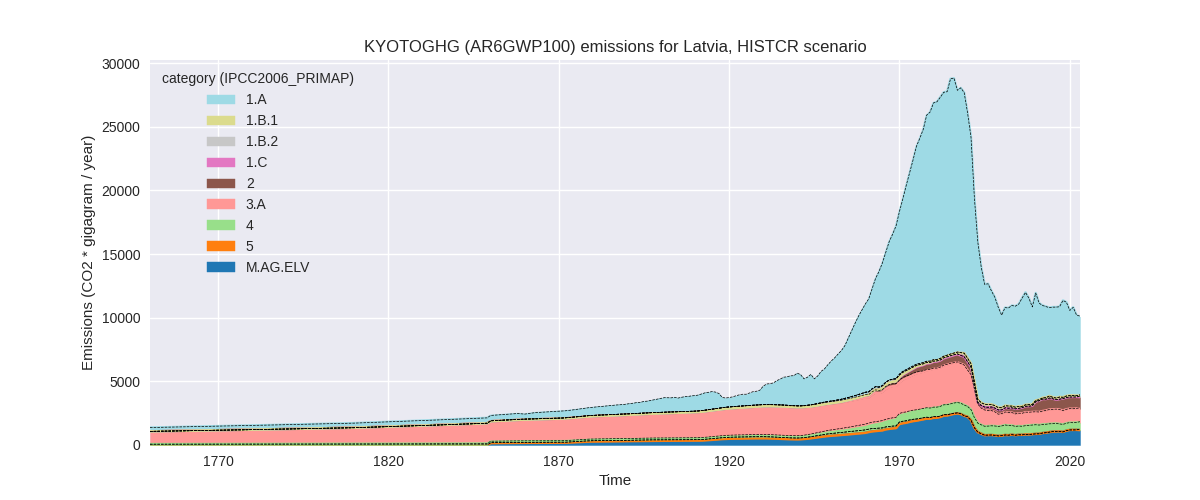
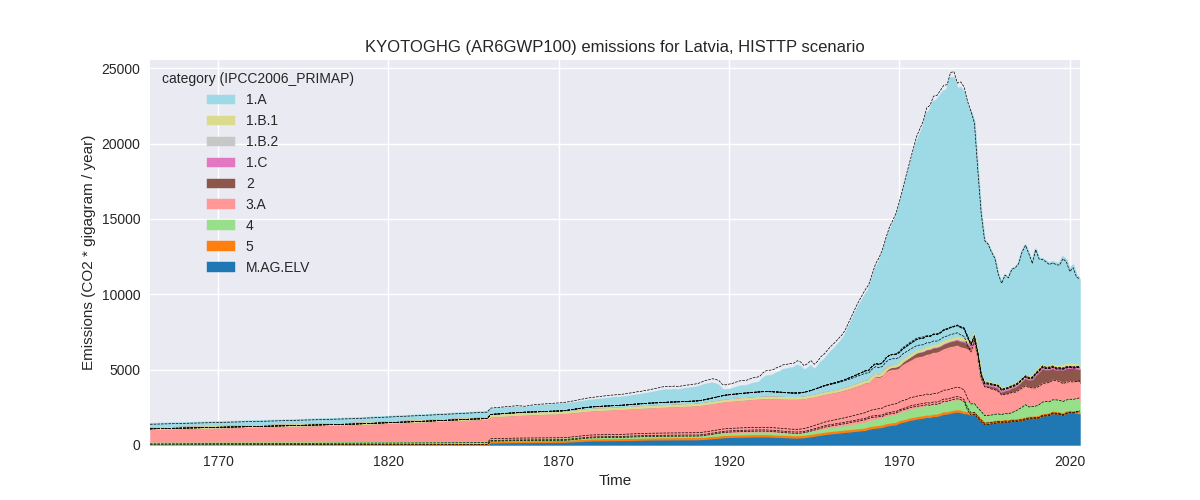
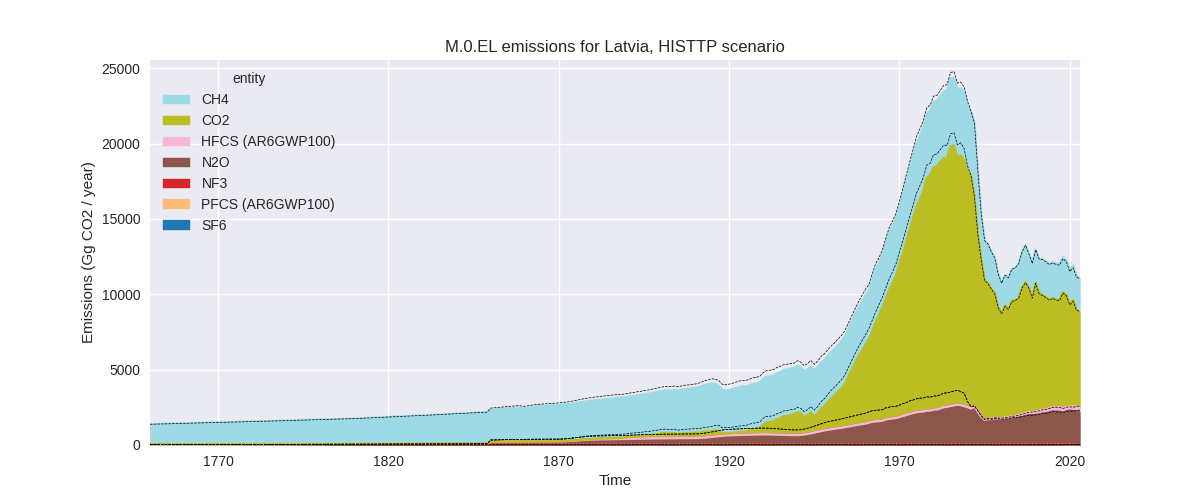
The following figures show the aggregate national total emissions excluding LULUCF AR6GWP100 for the third party priority scenario. The dotted linesshow the v2.6_final data.
Overview over changes
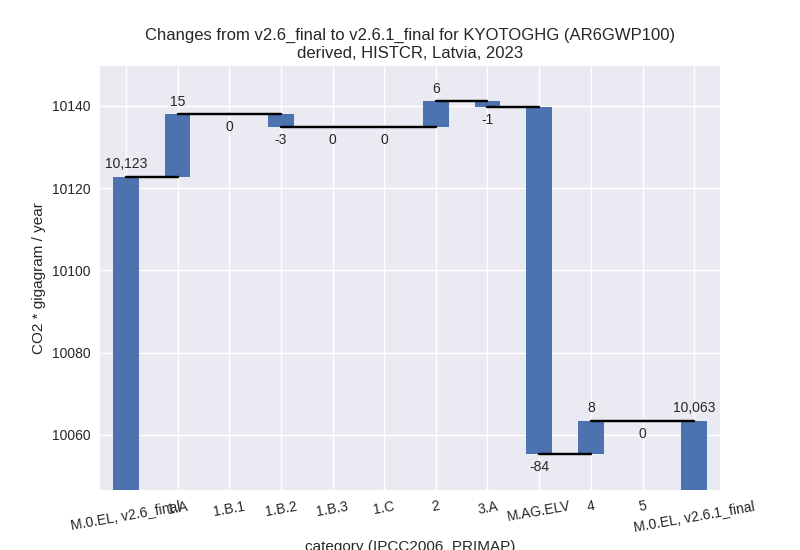
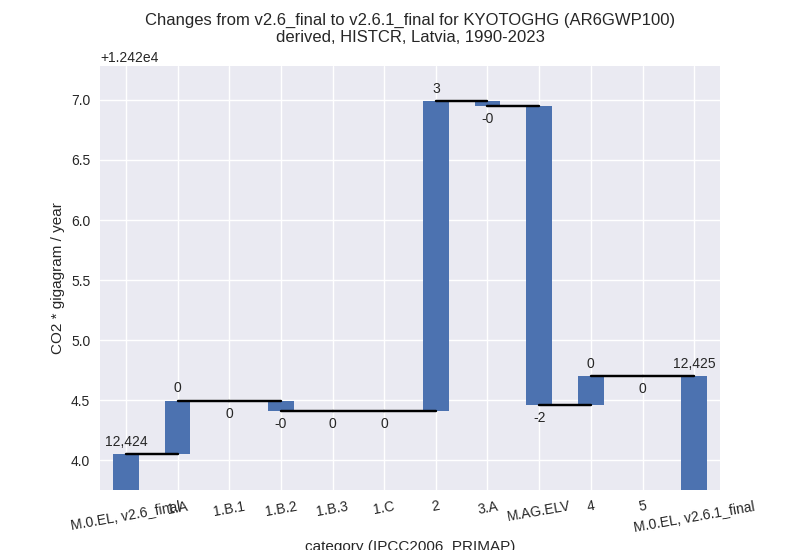
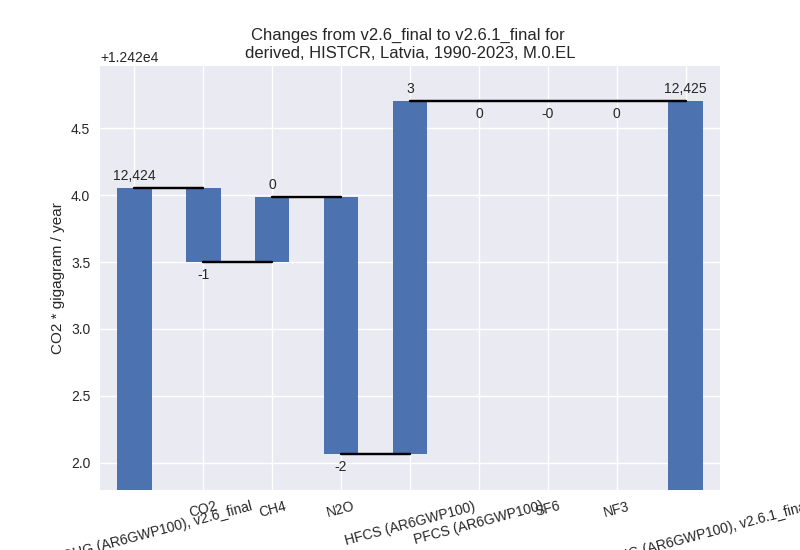
In the country reported priority scenario we have the following changes for aggregate Kyoto GHG and national total emissions excluding LULUCF (M.0.EL):
- Emissions in 2023 have changed by -0.6%% (-59.35 Gg CO2 / year)
- Emissions in 1990-2023 have changed by 0.0%% (0.65 Gg CO2 / year)
In the third party priority scenario we have the following changes for aggregate Kyoto GHG and national total emissions excluding LULUCF (M.0.EL):
- Emissions in 2023 have changed by 0.1%% (12.44 Gg CO2 / year)
- Emissions in 1990-2023 have changed by 0.1%% (6.82 Gg CO2 / year)
Most important changes per scenario and time frame
In the country reported priority scenario the following sector-gas combinations have the highest absolute impact on national total KyotoGHG (AR6GWP100) emissions in 2023 (top 5):
- 1: M.AG.ELV, N2O with -68.15 Gg CO2 / year (-5.9%)
- 2: M.AG.ELV, CO2 with -16.25 Gg CO2 / year (-16.4%)
- 3: 1.A, CH4 with 13.34 Gg CO2 / year (7.1%)
- 4: 4, CH4 with 8.51 Gg CO2 / year (1.6%)
- 5: 2, HFCS (AR6GWP100) with 8.28 Gg CO2 / year (2.8%)
In the country reported priority scenario the following sector-gas combinations have the highest absolute impact on national total KyotoGHG (AR6GWP100) emissions in 1990-2023 (top 5):
- 1: 2, HFCS (AR6GWP100) with 2.64 Gg CO2 / year (1.6%)
- 2: M.AG.ELV, N2O with -2.00 Gg CO2 / year (-0.2%)
- 3: M.AG.ELV, CO2 with -0.48 Gg CO2 / year (-1.2%)
- 4: 1.A, CH4 with 0.39 Gg CO2 / year (0.1%)
- 5: 4, CH4 with 0.25 Gg CO2 / year (0.0%)
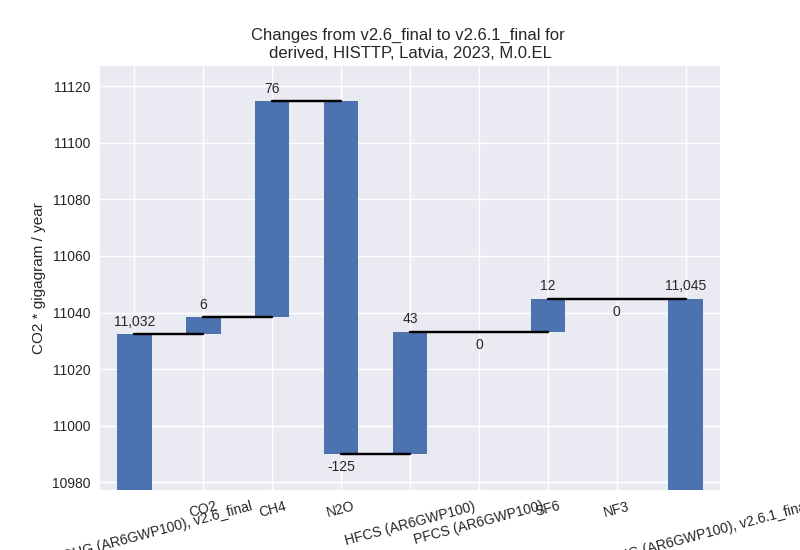
In the third party priority scenario the following sector-gas combinations have the highest absolute impact on national total KyotoGHG (AR6GWP100) emissions in 2023 (top 5):
- 1: M.AG.ELV, N2O with -126.57 Gg CO2 / year (-6.4%)
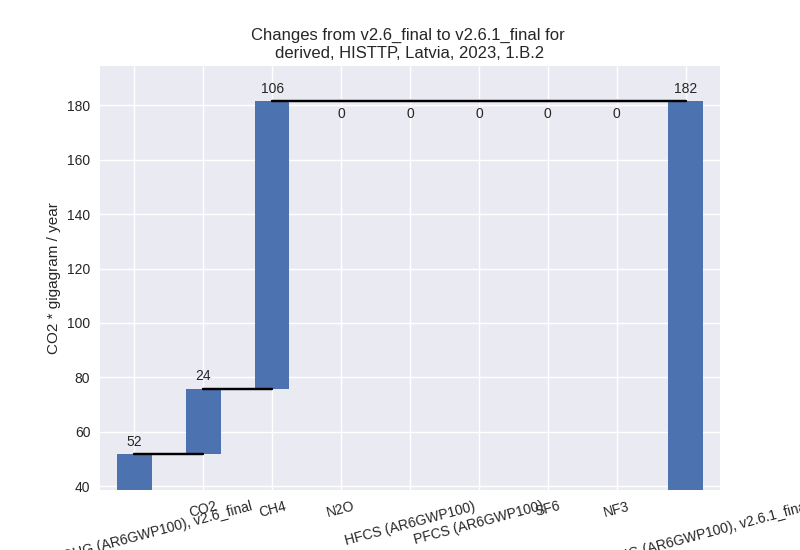
- 2: 1.B.2, CH4 with 105.79 Gg CO2 / year (204.6%)
- 3: 2, HFCS (AR6GWP100) with 43.25 Gg CO2 / year (16.8%)
- 4: 4, CH4 with -42.53 Gg CO2 / year (-5.3%)
- 5: 1.B.2, CO2 with 24.00 Gg CO2 / year (246088.1%)
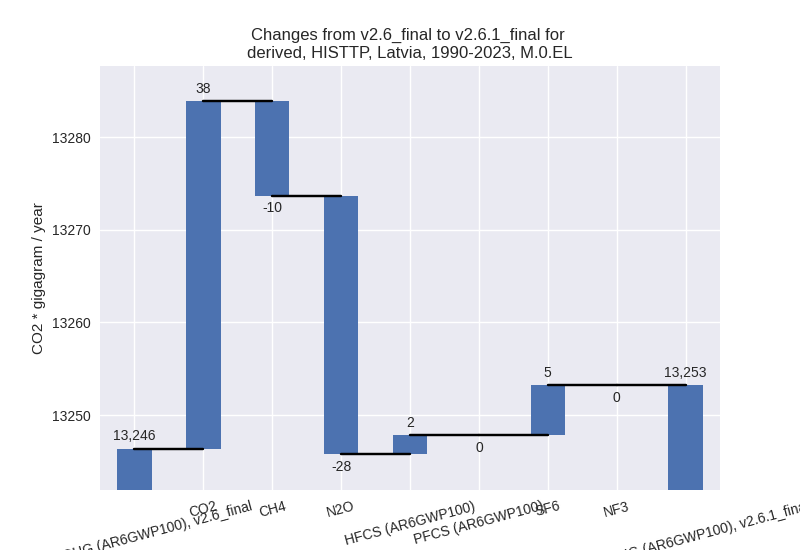
In the third party priority scenario the following sector-gas combinations have the highest absolute impact on national total KyotoGHG (AR6GWP100) emissions in 1990-2023 (top 5):
- 1: 1.B.2, CO2 with 38.06 Gg CO2 / year (451066.8%)
- 2: 4, CH4 with -35.96 Gg CO2 / year (-5.5%)
- 3: 1.B.2, CH4 with 34.64 Gg CO2 / year (58.2%)
- 4: M.AG.ELV, N2O with -15.15 Gg CO2 / year (-0.9%)
- 5: 5, N2O with -12.96 Gg CO2 / year (-17.9%)
Notes on data changes
Here we list notes explaining important emissions changes for the country.
- CRT data has been included but replaces official data reported to the EU which does not show noteworthy differences. Changes in the CR time-series are small, mostly limited to the latest years, and come from updated third party data (EDGAR, FAO) which is used to extrapolate the country reported data.
- Changes in the TP time series are small in total because individual
sector changes cancel.
- The most important change is that FAO emissions in M.AG.ELV pre 1990 are much lower than in the last FAOSTAT data release. They have changed, because the downscaling of the data for the former USSR has changed due to the different sectoral resolution used in the processing of the new FAO data.
- EDGAR data introduces much higher emissions in 1.B.2 and lower waste CH4 emissions. HFC emissions are higher in 2020 because the new EDGAR data add information for 2022 and 2023 which does not follow the decreasing trend of the previous years.
Changes by sector and gas
For each scenario and time frame the changes are displayed for all individual sectors and all individual gases. In the sector plot we use aggregate Kyoto GHGs in AR6GWP100. In the gas plot we usenational total emissions without LULUCF.
country reported scenario
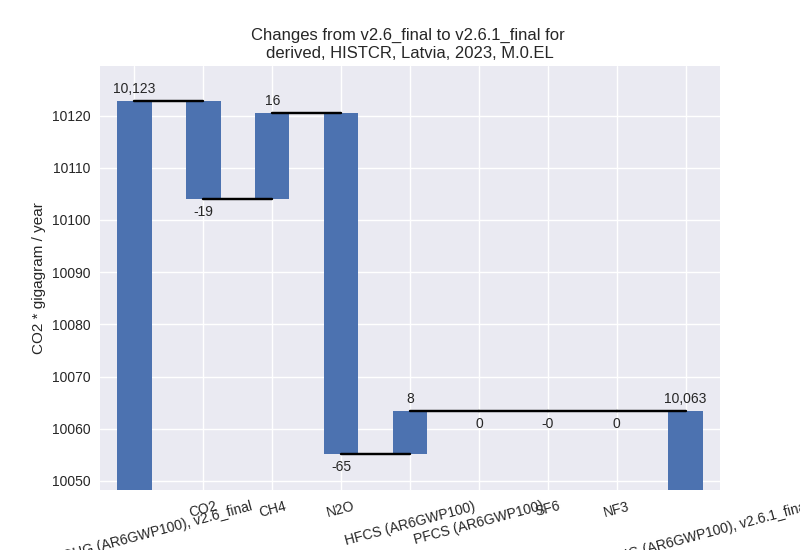
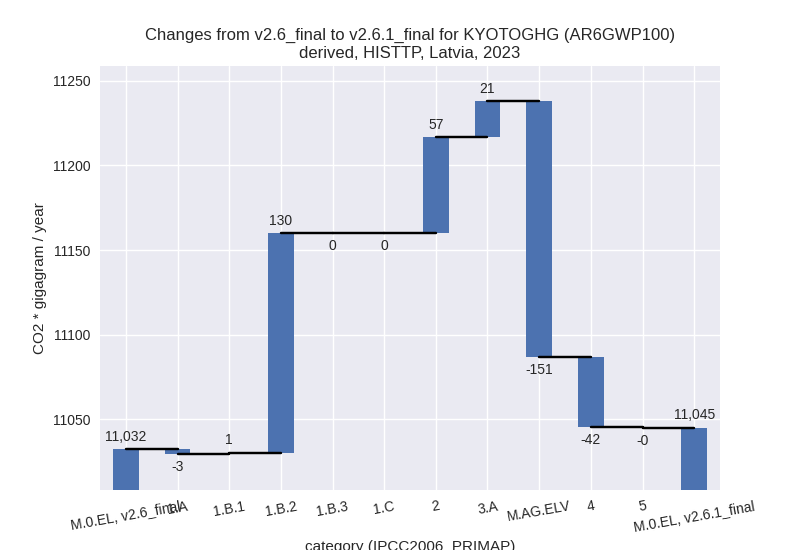
2023
1990-2023
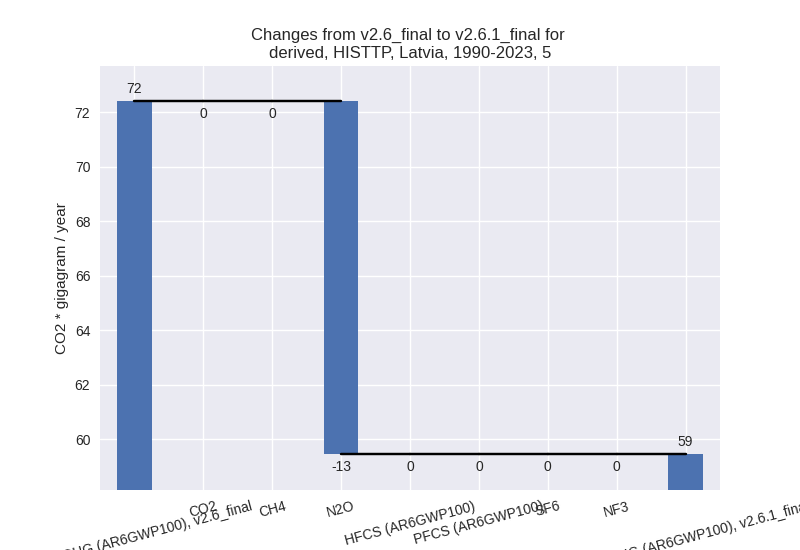
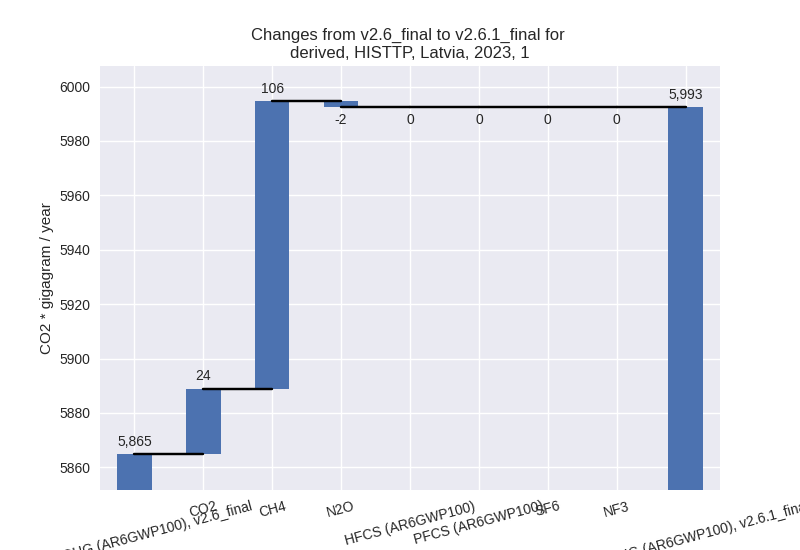
third party scenario
2023
1990-2023
Detailed changes for the scenarios:
country reported scenario (HISTCR):
Most important changes per time frame
For 2023 the following sector-gas combinations have the highest absolute impact on national total KyotoGHG (AR6GWP100) emissions in 2023 (top 5):
- 1: M.AG.ELV, N2O with -68.15 Gg CO2 / year (-5.9%)
- 2: M.AG.ELV, CO2 with -16.25 Gg CO2 / year (-16.4%)
- 3: 1.A, CH4 with 13.34 Gg CO2 / year (7.1%)
- 4: 4, CH4 with 8.51 Gg CO2 / year (1.6%)
- 5: 2, HFCS (AR6GWP100) with 8.28 Gg CO2 / year (2.8%)
For 1990-2023 the following sector-gas combinations have the highest absolute impact on national total KyotoGHG (AR6GWP100) emissions in 1990-2023 (top 5):
- 1: 2, HFCS (AR6GWP100) with 2.64 Gg CO2 / year (1.6%)
- 2: M.AG.ELV, N2O with -2.00 Gg CO2 / year (-0.2%)
- 3: M.AG.ELV, CO2 with -0.48 Gg CO2 / year (-1.2%)
- 4: 1.A, CH4 with 0.39 Gg CO2 / year (0.1%)
- 5: 4, CH4 with 0.25 Gg CO2 / year (0.0%)
Changes in the main sectors for aggregate KyotoGHG (AR6GWP100) are
- 1: Total sectoral emissions in 2022 are 6423.09 Gg CO2 / year which is 63.0% of M.0.EL emissions. 2023 Emissions have changed by 0.2% (12.20 Gg CO2 / year). 1990-2023 Emissions have changed by 0.0% (0.36 Gg CO2 / year).
- 2: Total sectoral emissions in 2022 are 906.12 Gg CO2 / year which is 8.9% of M.0.EL emissions. 2023 Emissions have changed by 0.7% (6.16 Gg CO2 / year). 1990-2023 Emissions have changed by 0.4% (2.58 Gg CO2 / year).
- M.AG: Total sectoral emissions in 2022 are 2283.72
Gg CO2 / year which is 22.4% of M.0.EL emissions. 2023 Emissions have
changed by -3.6% (-85.81 Gg CO2 /
year). 1990-2023 Emissions have changed by -0.1% (-2.52 Gg CO2 / year). For 2023 the
changes per gas
are:

The changes come from the following subsectors:- 3.A: Total sectoral emissions in 2022 are 1095.58 Gg CO2 / year which is 48.0% of category M.AG emissions. 2023 Emissions have changed by -0.1% (-1.40 Gg CO2 / year). 1990-2023 Emissions have changed by -0.0% (-0.04 Gg CO2 / year).
- M.AG.ELV: Total sectoral emissions in 2022 are
1188.14 Gg CO2 / year which is 52.0% of category M.AG emissions. 2023
Emissions have changed by -6.7%
(-84.40 Gg CO2 / year). 1990-2023 Emissions have changed by -0.2% (-2.48 Gg CO2 / year). For 2023 the
changes per gas
are:
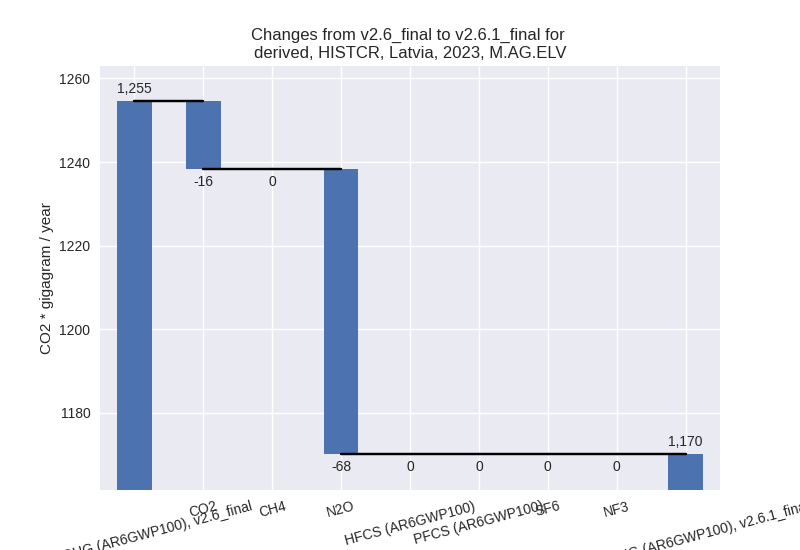
There is no subsector information available in PRIMAP-hist.
- 4: Total sectoral emissions in 2022 are 588.21 Gg CO2 / year which is 5.8% of M.0.EL emissions. 2023 Emissions have changed by 1.4% (8.09 Gg CO2 / year). 1990-2023 Emissions have changed by 0.0% (0.24 Gg CO2 / year).
- 5: No data
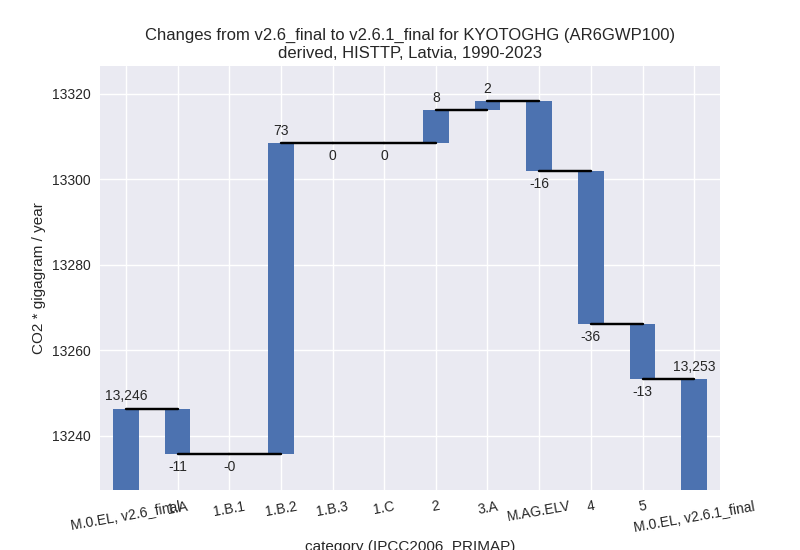
third party scenario (HISTTP):
Most important changes per time frame
For 2023 the following sector-gas combinations have the highest absolute impact on national total KyotoGHG (AR6GWP100) emissions in 2023 (top 5):
- 1: M.AG.ELV, N2O with -126.57 Gg CO2 / year (-6.4%)
- 2: 1.B.2, CH4 with 105.79 Gg CO2 / year (204.6%)
- 3: 2, HFCS (AR6GWP100) with 43.25 Gg CO2 / year (16.8%)
- 4: 4, CH4 with -42.53 Gg CO2 / year (-5.3%)
- 5: 1.B.2, CO2 with 24.00 Gg CO2 / year (246088.1%)
For 1990-2023 the following sector-gas combinations have the highest absolute impact on national total KyotoGHG (AR6GWP100) emissions in 1990-2023 (top 5):
- 1: 1.B.2, CO2 with 38.06 Gg CO2 / year (451066.8%)
- 2: 4, CH4 with -35.96 Gg CO2 / year (-5.5%)
- 3: 1.B.2, CH4 with 34.64 Gg CO2 / year (58.2%)
- 4: M.AG.ELV, N2O with -15.15 Gg CO2 / year (-0.9%)
- 5: 5, N2O with -12.96 Gg CO2 / year (-17.9%)
Changes in the main sectors for aggregate KyotoGHG (AR6GWP100) are
- 1: Total sectoral emissions in 2022 are 6101.96 Gg
CO2 / year which is 54.5% of M.0.EL emissions. 2023 Emissions have
changed by 2.2% (127.70 Gg CO2 /
year). 1990-2023 Emissions have changed by 0.7% (62.05 Gg CO2 / year). For 2023 the
changes per gas
are:
The changes come from the following subsectors:- 1.A: Total sectoral emissions in 2022 are 5903.05 Gg CO2 / year which is 96.7% of category 1 emissions. 2023 Emissions have changed by -0.1% (-3.09 Gg CO2 / year). 1990-2023 Emissions have changed by -0.1% (-10.61 Gg CO2 / year).
- 1.B.1: Total sectoral emissions in 2022 are 22.30
Gg CO2 / year which is 0.4% of category 1 emissions. 2023 Emissions have
changed by 4.7% (1.00 Gg CO2 /
year). 1990-2023 Emissions have changed by -0.2% (-0.04 Gg CO2 / year). For 2023 the
changes per gas
are:
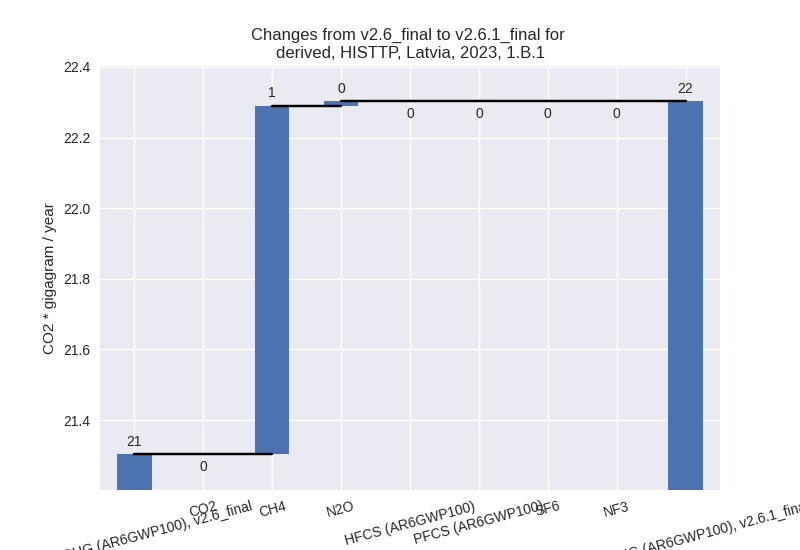
There is no subsector information available in PRIMAP-hist. - 1.B.2: Total sectoral emissions in 2022 are 176.61
Gg CO2 / year which is 2.9% of category 1 emissions. 2023 Emissions have
changed by 250.9% (129.79 Gg CO2 /
year). 1990-2023 Emissions have changed by 122.2% (72.70 Gg CO2 / year). For 2023 the
changes per gas
are:
For 1990-2023 the changes per gas are: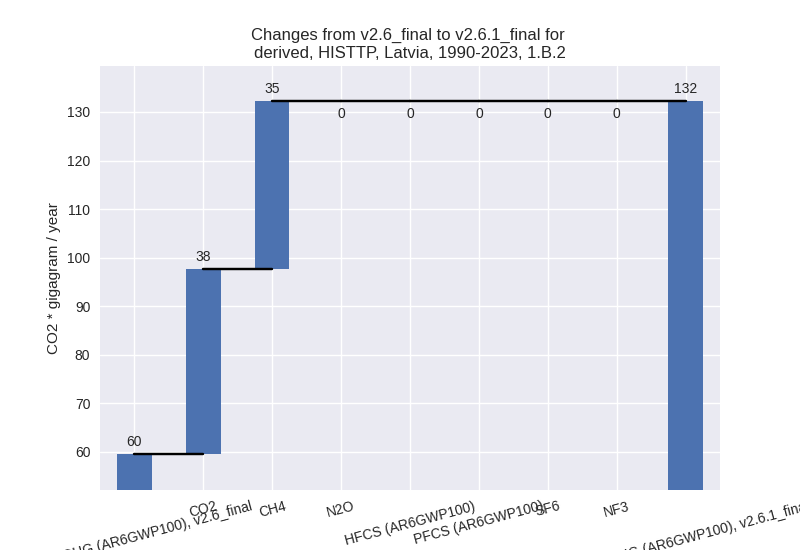
There is no subsector information available in PRIMAP-hist.
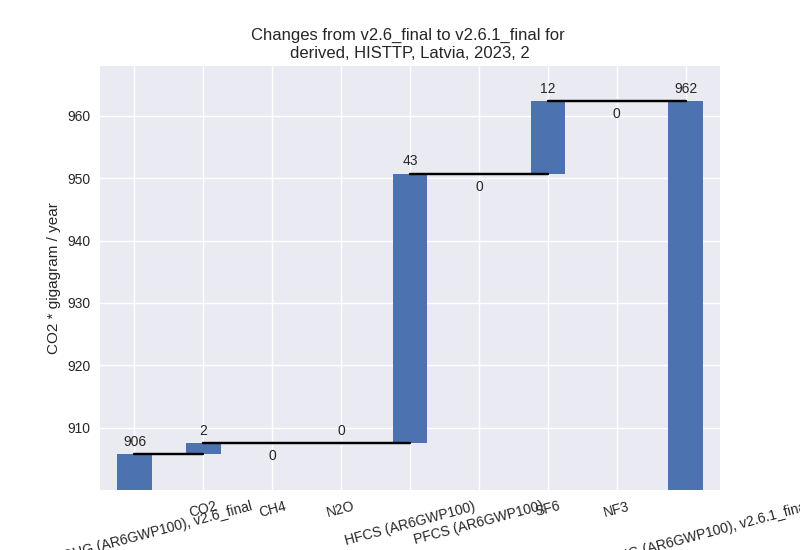
- 2: Total sectoral emissions in 2022 are 960.36 Gg
CO2 / year which is 8.6% of M.0.EL emissions. 2023 Emissions have
changed by 6.2% (56.58 Gg CO2 /
year). 1990-2023 Emissions have changed by 1.3% (7.77 Gg CO2 / year). For 2023 the
changes per gas
are:
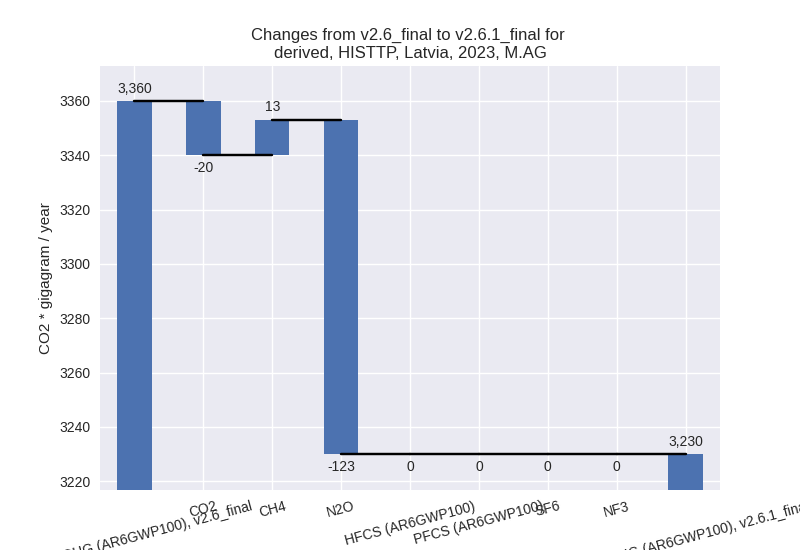
- M.AG: Total sectoral emissions in 2022 are 3262.70
Gg CO2 / year which is 29.2% of M.0.EL emissions. 2023 Emissions have
changed by -3.9% (-129.91 Gg CO2 /
year). 1990-2023 Emissions have changed by -0.4% (-14.15 Gg CO2 / year). For 2023 the
changes per gas
are:
The changes come from the following subsectors:- 3.A: Total sectoral emissions in 2022 are 1145.75 Gg CO2 / year which is 35.1% of category M.AG emissions. 2023 Emissions have changed by 1.9% (21.29 Gg CO2 / year). 1990-2023 Emissions have changed by 0.1% (2.06 Gg CO2 / year).
- M.AG.ELV: Total sectoral emissions in 2022 are
2116.96 Gg CO2 / year which is 64.9% of category M.AG emissions. 2023
Emissions have changed by -6.8%
(-151.20 Gg CO2 / year). 1990-2023 Emissions have changed by -0.9% (-16.21 Gg CO2 / year). For 2023 the
changes per gas
are:
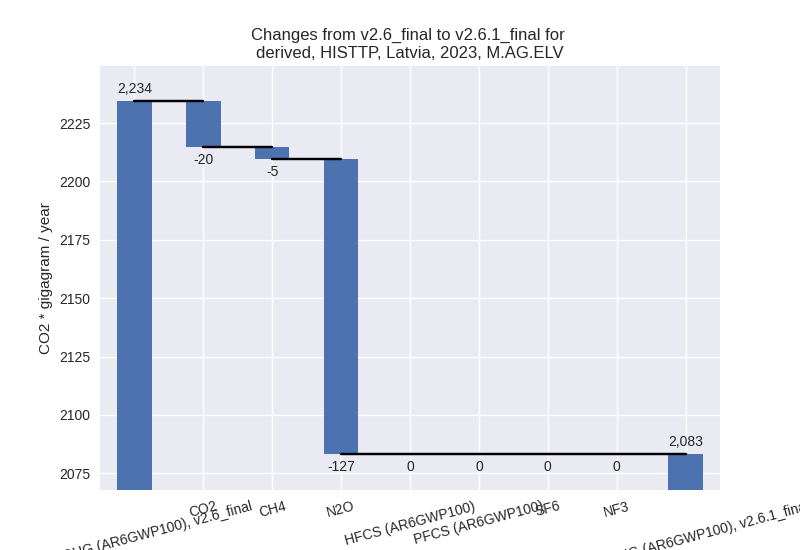
There is no subsector information available in PRIMAP-hist.
- 4: Total sectoral emissions in 2022 are 828.69 Gg
CO2 / year which is 7.4% of M.0.EL emissions. 2023 Emissions have
changed by -4.8% (-41.65 Gg CO2 /
year). 1990-2023 Emissions have changed by -5.1% (-35.88 Gg CO2 / year). For 2023 the
changes per gas
are:
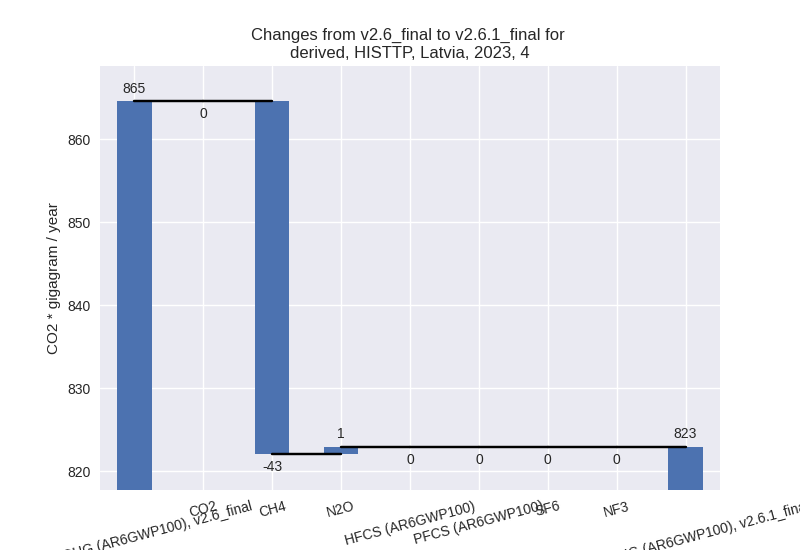
For 1990-2023 the changes per gas are: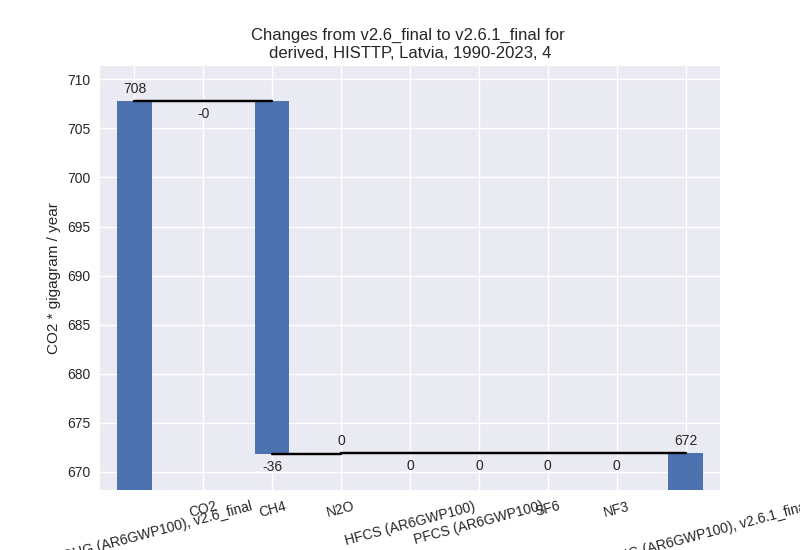
- 5: Total sectoral emissions in 2022 are 38.36 Gg
CO2 / year which is 0.3% of M.0.EL emissions. 2023 Emissions have
changed by -0.8% (-0.28 Gg CO2 /
year). 1990-2023 Emissions have changed by -17.9% (-12.96 Gg CO2 / year). For
1990-2023 the changes per gas
are: